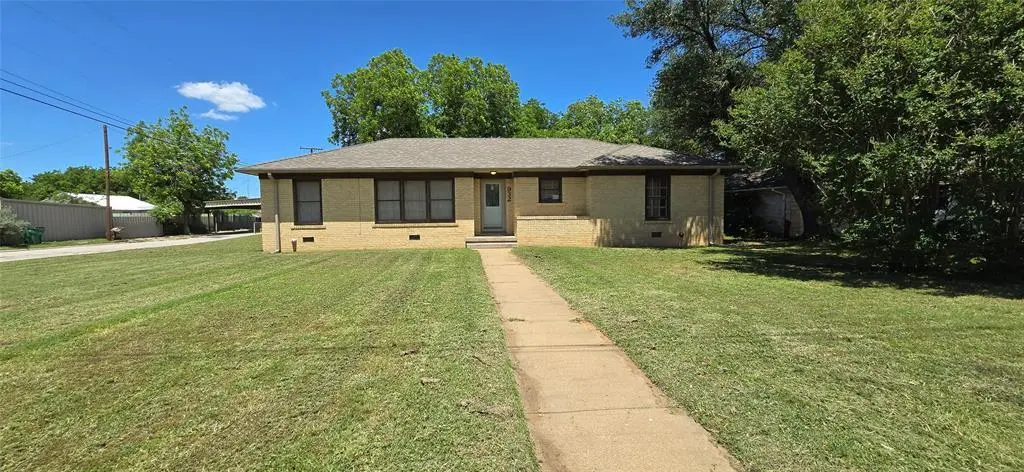
932 W Live Oak St · Jacksboro, TX
Flood risk 1/10 · Minimal
- FEMA flood zone
- X (unshaded)
- Chance of flooding over 30 yrs
- 0.0%
- Est. flood insurance / yr
- $507 – $1,088
Fire risk 7/10 · Major
- Est. fire insurance / yr
- $1,222 – $2,270
Heat risk 6/10 · Moderate
- Hot days now (above 108°F)
- 7 days/yr
- Hot days in 30 yrs
- 20 days/yr
Wind risk 4/10 · Minor
- Chance of severe wind over 30 yrs
- 14.0%
Air-quality risk 2/10 · Minimal
- Unhealthy air days now
- 0 days/yr
- Unhealthy air days in 30 yrs
- 1 days/yr
Risk factors via First Street. Map © Google.
Why this score? — see what drove the D grade
The composite is a weighted blend of 9 inputs, each scored 0–100. Each bar is that input's sub-score; the figure is the points it added to the 100-point composite (weight × sub-score).
- ARV discount +15.0/15.0
- Cash flow +6.7/30.0
- Appreciation +4.3/10.0
- Schools +3.6/10.0
- Livability +3.2/5.0
- 1% rule +2.7/10.0
- Rent growth +2.5/5.0
- Condition / age +2.5/5.0
- DSCR +0.9/10.0
$195,000
🖨 Deal sheet 📄 Offer letter ✓ Due diligence
Listing remarks
Welcome to this spacious corner-lot property in a well-established area of Jacksboro, Texas. Set on a generous . 3-acre lot, this home offers plenty of room to spread out along with great potential for outdoor living. With just under 2,500 square feet, the home features 3 bedrooms, 2 full bathrooms, and two separate living areas, ideal for both everyday living and entertaining. Natural flooring throughout adds character and provides a solid starting point for updates and personal touches. The layout offers both flexibility and function, with ample space ready to be tailored to your needs. This property presents a great opportunity for buyers looking to personalize and create a home that tru
Key facts
- Generous lot
- Corner-lot property
- Natural flooring
Tags
Property features AI
Finance
- Other: Listing status: Active Under Contract; Possession at closing/funding; Photos available (24)
- Financial info: Acceptable financing: Cash, Conventional, 1031 Exchange; No second mortgage reported
- HOA & community: No association
Exterior
- Parking: Attached carport; Covered parking for 2 vehicles; 1 carport space; 2 garage spaces (attached garage)
- Security: No surveillance devices reported
- Utilities: City water; City sewer; Not in a municipal utility district
- Home design: Single family residence; Residential property; One story; Preowned (built in 1960)
- Construction: Slab foundation; Built in 1960
- Exterior features: Lot is less than 0.5 acre (approximately 0.308 acre); Subdivision: Lindsey Add; Use preferred GPS for directions
Interior
- Kitchen: Gas range; Pantry
- Bedrooms: 3 bedrooms (all on the main level); Includes a primary bedroom and a secondary primary-style bedroom
- Flooring: Hardwood flooring
- Bathrooms: 2 full bathrooms
- Heating & cooling: Central heating (electric); Central air; Ceiling fans; Electric cooling components
- Interior features: Natural woodwork; Pantry; Two living areas; One dining area; Five total rooms; One-level layout
- Laundry & utility: No specific laundry details listed
Neighborhood map
What this means for you Summary
Snapshot
- This is a 3-bed/2.0-bath single-family listed at $195k.
Deal economics
- At list price, monthly cash flow is $-313 ($-4k/yr) — negative.
- To cash-flow at today's rent, offer at most $140k (28.4% below list).
- To meet the 1% rule (rent ≥ 1% of price), the offer needs to be $150k (23.1% below list).
- Recommended offer: $140k (28.4% below list) — sets the bar for cash-flow.
Location & tenants
- Location reads 64/100 on livability (#753 in TX) — a middle-class / working-renter tenant base. Strengths: cost of living A+, housing A+, crime A; Watch: health & safety C-, amenities F, commute F.
- Jacksboro ISD (town): math 42% / reading 42% proficiency, ranked #337 of 826 in TX (top 41%) — families likely to look elsewhere, expect single-tenant / working-renter base with shorter leases.
- Zoned schools: Jacksboro El (math 39% / reading 36%, grade F, #1,744 of 4,322 statewide, top 41%, 497 students, 68% FRL) — zoned schools average 68% FRL vs 44% district-wide (23 pts higher); higher-poverty schools than district average — tighter screening recommended.
- Market conditions: 124 active listings in the ZIP; 1 comparable units currently listed for rent nearby; 10 units permitted in Jack County in 2024 (0 in 5+ unit buildings).
Forward outlook
- Local home prices are declining (-1.3%/yr); year-one equity from $1k of loan paydown is wiped out by about $3k of value loss. Plan a longer hold.
Negotiation context
- It's been on market 20 days — a 2% lower offer ($192k) is reasonable based on typical stale-listing flexibility.
- 3 sale attempts with the ask held roughly flat each time — persistent listings suggest the price (not the market) is what's stuck; bring a comps-based counter.
Risks & watch-outs
- Climate carrying-cost: major wildfire risk; extreme-heat days projected 7→20/yr by 2055 (HVAC capex compounding) — expect insurance premiums to compound above CPI over the hold.
Questions for the listing agent
- What do current leases actually rent for vs. the listed asking? Can we see a recent rent roll and the last 12 months of T-12 income?
- Built in 1960 — when were the roof, HVAC, electrical panel, plumbing, and water heater last replaced?
- Is there a deadline driving the sale (1031 exchange, divorce, estate, relocation)? That informs how much negotiation room exists.
- Schools are F-rated, which usually means shorter tenancies and higher turnover. Who's the typical renter profile here, and what's been the actual vacancy rate?
- The area grade is low — what's the realistic commute time and amenity access for the typical tenant pool here? Any planned neighborhood developments (good or bad) we should know about?
- What's the average days-on-market for RENTAL listings here right now (not sales)? A rising rental-DOM trend means longer vacancies and softer asking-rent achievability than the comps imply.
- What's the recent tenant-quality profile in this submarket — average credit score on applications, eviction rate, late-payment / NSF rate, and stable-employment percentage? A property-management company in the area should have these aggregated.
- How much new for-sale + rental construction is in the pipeline within 1–3 miles? Heavy new supply typically softens prices + rents 12–24 months out; constrained supply supports both.
Investment metrics
- 1% rule
- 0.77% ✗
- Cap rate
- 4.37%
- Cash-on-cash
- -6.88%
- DSCR
- 0.69
- GRM
- 10.8
CMA / ARV
- ARV (median comp)
- $244,153
- List price
- $195,000
- Delta
- -20.13%
- Verdict
- UNDERPRICED
- Comps
- 20 within 1.0 mi
Show comp detail 5 sales within ~0.75 mi
| Address | Dist | Beds/Ba | Sqft | Sold | Price | $/sf | Match |
|---|---|---|---|---|---|---|---|
| 539 N Stewart St | 0.60mi | 3/2.0 | 2,511 (+0%) | 1mo | $445,000 | $177 | 71 |
| 526 N 4th St | 0.29mi | 3/2.0 | 2,412 (-3%) | 19mo | $229,900 | $95 | 65 |
| 137 S 7th St | 0.45mi | 2/2.5 (-1) | 2,473 (-1%) | 6mo | $249,900 | $101 | 65 |
| 104 Brad St | 0.37mi | 4/2.5 (+1) | 2,150 (-14%) | 12mo | $259,000 | $120 | 43 |
| 301 W Belknap St | 0.75mi | 3/2.0 | 2,179 (-13%) | 14mo | $153,000 | $70 | 32 |
Match score weights: distance 35% · size 25% · config 20% · recency 20%. Top-matched comps best support the ARV.
Projected returns pro-forma
-1.32% appreciation · 3.0% rent growth · sell at horizon
- IRR
- -16.6%
- Equity multiple
- 0.32×
- Total profit
- $-37,352
- Equity at exit
- $44,047
- IRR
- -9.7%
- Equity multiple
- 0.18×
- Total profit
- $-44,740
- Equity at exit
- $43,723
Cash invested: $54,600 (down + closing). Projections, not guarantees.
Landlord ↔ Tenant lean methodology
- Overall (STATE)
- 87 Strongly Landlord-Friendly
- State Texas
- 87 Strongly Landlord-Friendly · R+5
- County
- — inherits STATE
- City
- — inherits STATE
ZIP-level market 76458
- Home prices YoY
- -0.7%
- Active inventory
- 124
- Price-to-rent
- 10.8×
Monthly cashflow live
- Estimated rent
- $1,500 medium interval (Pro) →
- Mortgage (P&I)
- −$1,023
- Tax from tax record
- −$394 /mo · $4,731/yr
- Insurance
- −$81
- HOA
- −$0
- Vacancy / Maint / Mgmt
- −$315
- Net cashflow
- $-313
Break-even live
UW: 25.0% down · 7.5% · 30yr · 1.5% tax · 5.0% vac · 8.0% maint · 8.0% mgmt
Financing live
Cash to close
- Down payment
- $48,750
- Closing costs
- $5,850
- Reserves months
- —
- Total cash needed
- —
Loan-product check · same deal, 3 products live
Conventional
25% down · 7.5% · 30yr
- Down + closing
- —
- Monthly P&I
- —
- Monthly cashflow
- —
- DSCR
- —
- Eligible?
- —
Personal DTI + credit; lowest rate.
DSCR
20% down · 8.5% · 30yr
- Down + closing
- —
- Monthly P&I
- —
- Monthly cashflow
- —
- DSCR
- —
- Eligible?
- —
No personal income docs; deal must DSCR.
Hard money
10% down · 12.0% · 12mo
- Down + closing
- —
- Monthly P&I
- —
- Monthly cashflow
- —
- DSCR
- —
- Eligible?
- —
Short-term bridge; refi at stabilization.
Rent comps 1 comps
| Address | Beds | Baths | Sqft | Rent | $/sqft | DOM | Units | Dist |
|---|---|---|---|---|---|---|---|---|
| 147 Hillcrest St Jacksboro, TX | 3.0 | 2.0 | 1741 | $1,500 | $0.86 | 43d | 1 | 0.87mi |
Listing history 15 events
-
2026-05-14historical Active Option Contract 872-char remark
-
2026-05-04$195,000 Active 872-char remark
-
2026-04-16historical
-
2026-03-22price $114,900
-
2026-02-16status Active
-
2026-02-01status Pending
-
2026-01-22historical Active Option Contract
-
2026-01-09price $119,900
-
2025-12-28price $129,900
-
2025-12-03price $139,900
-
2025-11-09price $146,900
-
2025-10-23price $154,900
-
2025-10-16price $169,900
-
2025-10-15$1,699,200 Active
-
2023-02-24soldstatus
ⓘ Source: listings_history table (triggers on properties + properties_extension) + one-shot
backfill from property_details.listing_events for pre-trigger history.
Tax reassessment forecast TX · Resets to sale price
- Current annual tax
- $4,731 · $394/mo
- Projected year-2 tax
- $4,731 · $394/mo
- Expected delta
- $0/yr ($0/mo · 0.0%)
ⓘ Screening estimate from a state-policy table — verify with the county assessor before closing.
Climate risk First Street
- Flood 1/10 Low FEMA zone X (unshaded) · 0% chance over 30 yrs
- Wildfire 7/10 Severe
- Heat 6/10 Major 7 d/yr ≥108°F today · 20 d/yr by 30 yrs out
- Wind 4/10 Moderate 14% chance of damaging wind over 30 yrs
- Air quality 2/10 Low 0 unhealthy d/yr today · 1 by 30 yrs out
Nearby sold comps map
Loading sold comps map…
Walkable amenities ~0.75 mi
Loading nearby amenities…
Taxation est. · year 1
- Rental income
- $18,000
- − Mortgage interest
- −$10,923
- − Property taxes
- −$4,731
- − Insurance
- −$975
- − Repairs & maintenance
- −$1,440
- − Management
- −$1,440
- − Depreciation
- −$5,673
- Taxable loss
- −$7,182
- Est. tax savings @ 24.0%
- +$1,724
- After-tax cash flow
- $-2,034/yr
For passive investors: Depreciation is non-cash, so a rental often shows a tax loss while cash-flowing — sheltering income. Rental losses are passive: they offset passive income freely, and up to $25,000/yr can offset ordinary (W-2) income if you actively participate and your MAGI is under $100k (phasing out to $0 by $150k); unused losses carry forward. On sale, claimed depreciation is recaptured at up to 25%, and gains may owe capital-gains tax (a 1031 exchange can defer both). Figures are a year-1 estimate at your 24.0% rate — not tax advice; consult a CPA.
Schools (NCES district)
- District
- Jacksboro ISD
- NCES district ID
- 4824530
- Math proficiency
- 42% ▼ -3.00%
- Reading proficiency
- 42% ▬ 0.00%
- Median HH income
- $47,739
- Composite
- 35.94/100
- National rank
- #4802
- State rank
- #337 of 826 in TX
Livability — Jacksboro
- Score
- 64/100
- State rank
- #753
- US rank
- #13881
Category grades
Schools grade is shown separately in the Schools card above.
Census & demographics
- Census place
- Jacksboro, TX
- Population (ZIP)
- 6,103
Population outlook (Jack County) Hauer SSP2
- Today (2025)
- 8,560 people
- By 2030
- 8,423 · -1.6%
- By 2040
- 8,433 · -1.5%
- By 2050
- 8,605 · +0.5%
- By 2075
- 9,047 · +5.7%
- By 2100
- 8,844 · +3.3%
Race, ethnicity, and origin ACS 2023
- Neighborhood character
- Predominantly White (70%)
- Race & ethnicity
- White 70% Hispanic / Latino 23% Two or more races 7% Black 5%
- Hispanic origin (detail)
- Mexican 20%
- Common ancestry
- Italian 2% Lithuanian 2% Slovak 1%
- Foreign-born
- 6% · Canada
- Languages at home
- 83% English-only · Spanish 16%
Political lean MEDSL · Jack
- 2024 margin
- Solid R (+82.3) · D 8.6% · R 90.9%
- 2008→2024 swing
- -14.2pp toward R · 2008: -68.1pp · 2024: -82.3pp
- All cycles
- 2024: R+82.3 2020: R+81.6 2016: R+79.6 2012: R+78.3 2008: R+68.1
Not yet ingested
- Civics
- —
Market trends
- HPI YoY
- ▼ -1.32%
- Current HPI
- 202.1533
- Rent YoY
- —
- Metro
- —
- State GDP YoY
- ▲ 3.95%
- F500 in state
- 110
Industry mix (Fortune 500 HQ in TX)
| Industry | F500 HQs | Revenue |
|---|---|---|
| Energy | 16 | $1,198B |
|
||
| Technology | 5 | $198B |
|
||
| Engineering / Construction | 4 | $72B |
|
||
| Energy Services | 3 | $60B |
|
||
| Utilities | 3 | $41B |
|
||
| Healthcare | 2 | $330B |
|
||
Price history
-88.5% since first listed16 events — show timeline
- 2026-05-25 Pending — NTREIS
- 2026-05-14 Contingent — NTREIS
- 2026-05-04 Listed $195,000 NTREIS
- 2026-04-16 Listing Removed — NTREIS
- 2026-03-22 Price Changed $114,900 NTREIS
- 2026-02-16 Relisted — NTREIS
- 2026-02-01 Pending — NTREIS
- 2026-01-22 Contingent — NTREIS
- 2026-01-09 Price Changed $119,900 NTREIS
- 2025-12-28 Price Changed $129,900 NTREIS
- 2025-12-03 Price Changed $139,900 NTREIS
- 2025-11-09 Price Changed $146,900 NTREIS
- 2025-10-23 Price Changed $154,900 NTREIS
- 2025-10-16 Price Changed $169,900 NTREIS
- 2025-10-15 Listed $1,699,200 NTREIS
- 2023-02-24 Sold (Public Records) — Public Records
Property tax history
+10.0%/yrLatest (2025): $4,731 · +77.6% YoY. Source: county tax records.
Cash-flow waterfall
monthlySold comps — $/sqft
last 12 mo · ≤1 miLoading sold comps…