8221 Ilex #55 · Fontana, CA
Flood risk 1/10 · Minimal
- FEMA flood zone
- X (unshaded)
- Chance of flooding over 30 yrs
- 0.0%
- Est. flood insurance / yr
- $507 – $1,088
Fire risk 1/10 · Minimal
- Est. fire insurance / yr
- $659 – $1,223
Heat risk 8/10 · Major
- Hot days now (above 102°F)
- 7 days/yr
- Hot days in 30 yrs
- 20 days/yr
Wind risk 1/10 · Minimal
- Chance of severe wind over 30 yrs
- —
Air-quality risk 10/10 · Severe
- Unhealthy air days now
- 26 days/yr
- Unhealthy air days in 30 yrs
- 30 days/yr
Risk factors via First Street. Map © Google.
Why this score? — see what drove the C+ grade
The composite is a weighted blend of 9 inputs, each scored 0–100. Each bar is that input's sub-score; the figure is the points it added to the 100-point composite (weight × sub-score).
- Cash flow +30.0/30.0
- DSCR +10.0/10.0
- 1% rule +7.9/10.0
- Schools +4.1/10.0
- Condition / age +4.0/5.0
- Livability +3.2/5.0
- Rent growth +3.1/5.0
- ARV discount +0.0/15.0
- Appreciation +0.0/10.0
$269,000
🖨 Deal sheet 📄 Offer letter ✓ Due diligence
Listing remarks
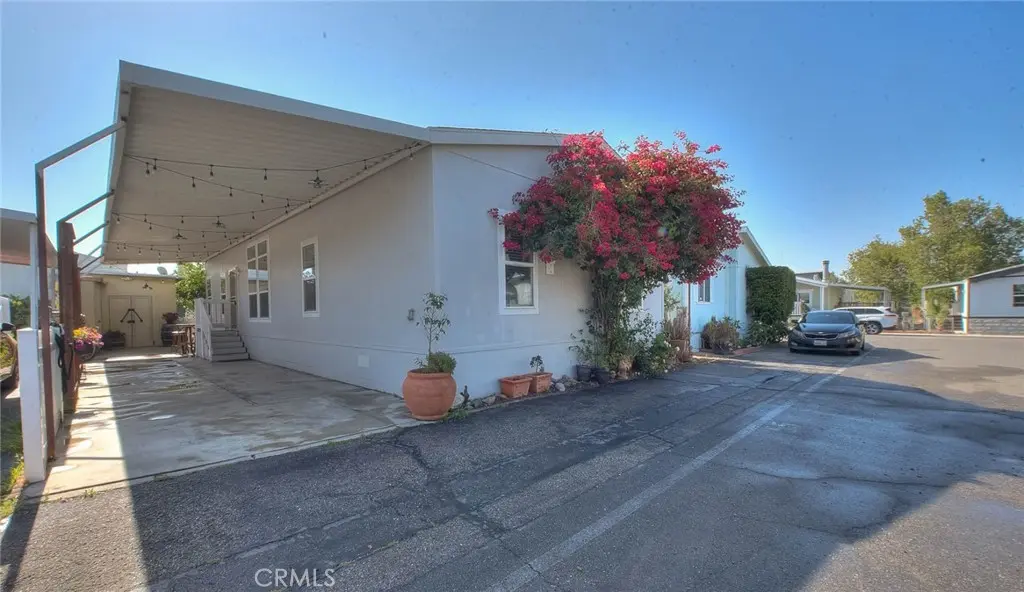
Welcome to 8221 Ilex St #55, Fontana a beautifully designed manufactured home offering the perfect blend of comfort, style, and affordability. This spacious residence features 9 foot ceilings, 4 bedrooms, 2 bathrooms, and approximately 1,415 square feet of well planned living space and huge storage space, providing plenty of room for families, entertaining, or working from home. Built in 2019, the home offers modern finishes and a contemporary layout designed for today's lifestyle. Step inside to discover an open-concept floor plan filled with natural light, creating a warm and inviting atmosphere from the moment you enter. The spacious kitchen flows seamlessly into the living and dining ar
Key facts
- Clubhouse
- Off street parking
- Spacious kitchen
Tags
Property features AI
Finance
- HOA & community: Land lease (approx. $825/month); Located in Starlite Mobile Home Community
Exterior
- Parking: Attached carport; Guest parking; Additional parking space
- Utilities: Public/district water; Public sewer; Natural gas connected; Electricity connected
- Home design: Single-story mobile home; Front-facing entry; Mobile home remains on site; Estimated year built
- Construction: Composition shingle roof; Mobile home dimensions approximately 27' x 52'; One total story
- Exterior features: Community pool; Sidewalks
Interior
- Kitchen: Remodeled kitchen; Formica counters; Walk-in pantry; Range with stove hood; Dishwasher
- Bedrooms: Primary bedroom (ground level)
- Flooring: Laminate flooring
- Bathrooms: 2 full bathrooms; Double sinks in primary bathroom; Shower and shower-in-tub; Privacy toilet door; Formica counters in bathrooms
- Heating & cooling: Central cooling; Central furnace heating
- Interior features: Front entry; Entry at ground level; Walk-in closet; Primary bedroom
- Laundry & utility: Dedicated laundry room; Washer hookup; Gas dryer hookup
Neighborhood map
What this means for you Summary
Snapshot
- This is a 4-bed/2.0-bath manufactured listed at $269k. Condition is rated good.
Deal economics
- At list price, monthly cash flow is $1k ($14k/yr) — positive.
- The deal already cash-flows at list — no discount required.
- Meets the 1% rule at list price ($3k rent vs $269k).
- Cap rate 11.4% vs local median 3.2% in Fontana — top-decile yield for the area; either an underpriced asset or a hidden risk that comps aren't pricing in. Stress-test before assuming the spread holds.
Location & tenants
- Location reads 64/100 on livability (#415 in CA) — a middle-class / working-renter tenant base. Strengths: housing A+, commute A-, employment A-; Watch: schools F, amenities F, cost of living F.
- Fontana Unified (suburban): math 25% / reading 71% proficiency, ranked #156 of 517 in CA (top 30%) — families likely to look elsewhere, expect single-tenant / working-renter base with shorter leases; 71% free/reduced lunch — lower-income household profile, screen leases tightly.
- Market conditions: Rents rising (+2.3%/yr); 115 active listings in the ZIP; 15 comparable units currently listed for rent nearby; rentals leasing fast (median 2d on market — plan ~1-2 weeks tenant-placement turnaround); solid renter incomes; 5,458 units permitted in San Bernardino County in 2024 (1,500 in 5+ unit buildings).
- At $3,458/mo this rent would consume 53% of the median local household income ($78k/yr) (locally 3437% of renters already pay >50% of income on rent) — very limited rent-growth headroom before tenants either downsize or default.
Forward outlook
- Local home prices are declining (-3.0%/yr); year-one equity from $2k of loan paydown is wiped out by about $8k of value loss. Plan a longer hold.
- San Bernardino County population projected at +15% by 2050 — modest demand growth; plan on rents tracking national, not racing it.
- At projected returns (-3.0% appreciation + 2.3% rent growth), your $75k cash investment doubles in ~7 years — after that, you're playing with house money.
Negotiation context
- Only 13 days on market — expect competitive offers; lowballing is unlikely to land.
Risks & watch-outs
- Climate carrying-cost: extreme-heat days projected 7→20/yr by 2055 (HVAC capex compounding) — expect insurance premiums to compound above CPI over the hold.
Questions for the listing agent
- Is there a deadline driving the sale (1031 exchange, divorce, estate, relocation)? That informs how much negotiation room exists.
- Schools are F-rated, which usually means shorter tenancies and higher turnover. Who's the typical renter profile here, and what's been the actual vacancy rate?
- What's the average days-on-market for RENTAL listings here right now (not sales)? A rising rental-DOM trend means longer vacancies and softer asking-rent achievability than the comps imply.
- What's the recent tenant-quality profile in this submarket — average credit score on applications, eviction rate, late-payment / NSF rate, and stable-employment percentage? A property-management company in the area should have these aggregated.
- How much new for-sale + rental construction is in the pipeline within 1–3 miles? Heavy new supply typically softens prices + rents 12–24 months out; constrained supply supports both.
Investment metrics
- 1% rule
- 1.29% ✓
- Cap rate
- 11.42%
- Cash-on-cash
- 18.32%
- DSCR
- 1.82
- GRM
- 6.5
CMA / ARV
- ARV (on-the-fly)
- $189,610
- Comps found
- 2
Show comp detail 2 sales within ~0.75 mi
| Address | Dist | Beds/Ba | Sqft | Sold | Price | $/sf | Match |
|---|---|---|---|---|---|---|---|
| 8191 Calabash #38 | 0.67mi | 3/2.0 (-1) | 1,344 (-5%) | 4mo | $166,000 | $124 | 52 |
| 8191 Calabash Ave #39 | 0.67mi | 4/2.0 | 1,344 (-5%) | 21mo | $180,100 | $134 | 43 |
Match score weights: distance 35% · size 25% · config 20% · recency 20%. Top-matched comps best support the ARV.
Projected returns pro-forma
-3.0% appreciation · 2.34% rent growth · sell at horizon
- IRR
- 9.3%
- Equity multiple
- 1.36×
- Total profit
- $27,267
- Equity at exit
- $40,109
- IRR
- 17.9%
- Equity multiple
- 2.44×
- Total profit
- $108,355
- Equity at exit
- $23,258
Cash invested: $75,320 (down + closing). Projections, not guarantees.
Landlord ↔ Tenant lean methodology
- Overall (STATE)
- 18 Strongly Tenant-Friendly
- State California
- 18 Strongly Tenant-Friendly · D+13
- County
- — inherits STATE
- City
- — inherits STATE
ZIP-level market 92335
- Rents YoY
- 2.3%
- Active inventory
- 115
- Price-to-rent
- 6.5×
Monthly cashflow live
- Estimated rent
- $3,458 high interval (Pro) →
- Mortgage (P&I)
- −$1,411
- Tax from tax record
- −$58 /mo · $702/yr
- Insurance
- −$112
- HOA
- −$0
- Vacancy / Maint / Mgmt
- −$726
- Net cashflow
- $1,150
Break-even live
UW: 25.0% down · 7.5% · 30yr · 1.5% tax · 5.0% vac · 8.0% maint · 8.0% mgmt
Financing live
Cash to close
- Down payment
- $67,250
- Closing costs
- $8,070
- Reserves months
- —
- Total cash needed
- —
Loan-product check · same deal, 3 products live
Conventional
25% down · 7.5% · 30yr
- Down + closing
- —
- Monthly P&I
- —
- Monthly cashflow
- —
- DSCR
- —
- Eligible?
- —
Personal DTI + credit; lowest rate.
DSCR
20% down · 8.5% · 30yr
- Down + closing
- —
- Monthly P&I
- —
- Monthly cashflow
- —
- DSCR
- —
- Eligible?
- —
No personal income docs; deal must DSCR.
Hard money
10% down · 12.0% · 12mo
- Down + closing
- —
- Monthly P&I
- —
- Monthly cashflow
- —
- DSCR
- —
- Eligible?
- —
Short-term bridge; refi at stabilization.
Rent comps 15 comps
| Address | Beds | Baths | Sqft | Rent | $/sqft | DOM | Units | Dist |
|---|---|---|---|---|---|---|---|---|
| 13245 Flagstaff Dr Rancho Cucamonga, CA | 3.0 | 2.0 | 1839 | $3,500 | $1.90 | 1d | 1 | 0.32mi |
| 13665 Arrow Blvd Fontana, CA | 3.0 | 2.0 | 1625 | $3,000 | $1.85 | 43d | 1 | 0.47mi |
| 12995 Chestnut Ave Rancho Cucamonga, CA | 3.0 | 1.0 | 1066 | $2,900 | $2.72 | 1d | 1 | 0.56mi |
| 12915 Foothill Blvd Rancho Cucamonga, CA | 1.0–3.0 | 1.0–2.0 | 1039 | $4,194 | $4.03 | 1d | 13 | 0.61mi |
| 8493 Etiwanda Ave Rancho Cucamonga, CA | 2.0–3.0 | 1.0–2.0 | 977 | $2,895 | $2.96 | 1d | 3 | 0.74mi |
| 8186 Banana Ave Fontana, CA | 2.0–4.0 | 2.0–3.5 | 1686 | $4,387 | $2.60 | 1d | 14 | 0.81mi |
| 13742 Lighthouse Ct Fontana, CA | 4.0 | 3.0 | 1857 | $3,600 | $1.94 | 1d | 1 | 0.83mi |
| 13632 Cabrillo Ct Fontana, CA | 3.0 | 2.5 | 1447 | $3,200 | $2.21 | 1d | 1 | 0.84mi |
| 8185 Banana Ave Unit 9 Fontana, CA | 4.0 | 2.5 | 1790 | $3,300 | $1.84 | 43d | 1 | 0.86mi |
| 8185 Banana Ave Unit 23 Fontana, CA | 4.0 | 2.5 | 1790 | $3,300 | $1.84 | 10d | 1 | 0.86mi |
| 8153 Banana Ave Fontana, CA | 3.0 | 2.0 | 1300 | $3,000 | $2.31 | 19d | 4 | 0.86mi |
| 8285 Cashmere Ct Fontana, CA | 4.0 | 2.0 | 1690 | $3,700 | $2.19 | 1d | 1 | 0.88mi |
| 14136 Farralon Ct Fontana, CA | 4.0 | 3.0 | 1783 | $3,400 | $1.91 | 2d | 1 | 1.07mi |
| 7894 Ocean Ct Fontana, CA | 3.0 | 2.5 | 1839 | $3,300 | $1.79 | 10d | 1 | 1.19mi |
| 7691 Creole Pl Unit 6 Rancho Cucamonga, CA | 3.0 | 3.5 | 1560 | $3,600 | $2.31 | 1d | 1 | 1.34mi |
Listing history 11 events
-
2026-06-18days on market $269,000 Active 13 DOM
-
2026-06-17days on market $269,000 Active 12 DOM
-
2026-06-16days on market $269,000 Active 11 DOM
-
2026-06-15days on market $269,000 Active 10 DOM
-
2026-06-13days on market $269,000 Active 8 DOM
-
2026-06-13pricedays on market $269,000 Active 7 DOM
-
2026-06-10remarks 699-char remark
-
2026-06-09days on market $250,000 Active 4 DOM
-
2026-06-08days on market $250,000 Active 3 DOM
-
2026-06-07remarks 693-char remark
-
2026-06-07$250,000 Active 2 DOM
ⓘ Source: listings_history table (triggers on properties + properties_extension) + one-shot
backfill from property_details.listing_events for pre-trigger history.
Tax reassessment forecast CA · Resets to sale price
- Current annual tax
- $702 · $58/mo
- Projected year-2 tax
- $2,044 · $170/mo
- Expected delta
- +$1,343/yr (+$112/mo · 191.3%)
ⓘ Screening estimate from a state-policy table — verify with the county assessor before closing.
Climate risk First Street
- Flood 1/10 Low FEMA zone X (unshaded) · 0% chance over 30 yrs
- Wildfire 1/10 Low
- Heat 8/10 Severe 7 d/yr ≥102°F today · 20 d/yr by 30 yrs out
- Wind 1/10 Low
- Air quality 10/10 Extreme 26 unhealthy d/yr today · 30 by 30 yrs out
Nearby sold comps map
Loading sold comps map…
Walkable amenities ~0.75 mi
Loading nearby amenities…
Taxation est. · year 1
- Rental income
- $41,490
- − Mortgage interest
- −$15,068
- − Property taxes
- −$702
- − Insurance
- −$1,345
- − Repairs & maintenance
- −$3,319
- − Management
- −$3,319
- − Depreciation
- −$7,825
- Taxable income
- $9,911
- Est. tax owed @ 24.0%
- −$2,379
- After-tax cash flow
- $11,424/yr
For passive investors: Depreciation is non-cash, so a rental often shows a tax loss while cash-flowing — sheltering income. Rental losses are passive: they offset passive income freely, and up to $25,000/yr can offset ordinary (W-2) income if you actively participate and your MAGI is under $100k (phasing out to $0 by $150k); unused losses carry forward. On sale, claimed depreciation is recaptured at up to 25%, and gains may owe capital-gains tax (a 1031 exchange can defer both). Figures are a year-1 estimate at your 24.0% rate — not tax advice; consult a CPA.
Condition & rehab AI · 12 photos
This well-maintained manufactured home offers a good condition with modern finishes and a spacious floor plan, ideal for both resale and rental.
Value-add opportunities
- Resale Paint exterior — Enhances curb appeal
- Rental Replace ceiling fans — Improves comfort and energy efficiency
Renovation cost estimate screening
Value-add ROI direction
- Resale Paint exterior — Enhances curb appeal ↑
- Rental Replace ceiling fans — Improves comfort and energy efficiency ↑
ⓘ Cost ranges are severity-bucket heuristics (US national rule-of-thumb). Get contractor quotes + a written scope before underwriting a rehab budget.
Schools (NCES district)
- District
- Fontana Unified
- NCES district ID
- 0613920
- Math proficiency
- 25% ▬ 0.00%
- Reading proficiency
- 71% ▲ 30.00%
- Median HH income
- $53,912
- Composite
- 41.31/100
- National rank
- #3510
- State rank
- #156 of 517 in CA
Livability — Fontana
- Score
- 64/100
- State rank
- #415
- US rank
- #14177
Category grades
Schools grade is shown separately in the Schools card above.
Census & demographics
- County
- San Bernardino County · 2,030,291 people
- City population
- 203,028
- Metro
- Riverside-San Bernardino-Ontario, CA
- Population (ZIP)
- 97,511
- Household income
- $77,949
- Rent vs Own
- Severe rent burden
- 3437.0
Population outlook (San Bernardino County) Hauer SSP2
- Today (2025)
- 2,300,329 people
- By 2030
- 2,378,907 · +3.4%
- By 2040
- 2,523,137 · +9.7%
- By 2050
- 2,642,388 · +14.9%
- By 2075
- 2,880,769 · +25.2%
- By 2100
- 2,909,436 · +26.5%
Race, ethnicity, and origin ACS 2023
- Neighborhood character
- Predominantly Hispanic (84%)
- Race & ethnicity
- Hispanic / Latino 84% Two or more races 13% White 8% Black 4% Asian 2% Native American 2%
- Hispanic origin (detail)
- Mexican 74%
- Common ancestry
- Italian 1%
- Foreign-born
- 34% · Canada, Vietnam
- Languages at home
- 27% English-only · Spanish 69% Arabic 1%
Political lean MEDSL · San Bernardino
- 2024 margin
- Toss-up / Even · D 47.5% · R 49.7% · Other 2.8%
- 2008→2024 swing
- -8.5pp toward R · 2008: 6.3pp · 2024: -2.1pp
- All cycles
- 2024: R+2.1 2020: D+10.7 2016: D+9.8 2012: D+5.4 2008: D+6.3
Not yet ingested
- Civics
- —
Market trends
- HPI YoY
- ▼ -804.67%
- Current HPI
- 507.5862
- Rent YoY
- ▲ 2.34%
- Metro
- Riverside-San Bernardino-Ontario, CA
- State GDP YoY
- ▲ 3.21%
- F500 in state
- 116
Industry mix (Fortune 500 HQ in CA)
| Industry | F500 HQs | Revenue |
|---|---|---|
| Technology | 27 | $1,492B |
|
||
| Financial Services | 3 | $174B |
|
||
| Retail | 3 | $44B |
|
||
| Insurance | 3 | $26B |
|
||
| Media / Entertainment | 2 | $115B |
|
||
| Pharmaceuticals / Biotech | 2 | $62B |
|
||
Price history
1 event — show timeline
- 2026-06-05 Listed $250,000 CRMLS
Property tax history
-1.6%/yrLatest (2025): $702 · +5.4% YoY. Source: county tax records.
Cash-flow waterfall
monthlySold comps — $/sqft
last 12 mo · ≤1 miLoading sold comps…