440 Division Ave · Drain, OR
Flood risk 7/10 · Major
- FEMA flood zone
- AE
- Chance of flooding over 30 yrs
- 0.99%
- Est. flood insurance / yr
- $1,737 – $8,500
Fire risk 6/10 · Moderate
- Est. fire insurance / yr
- $498 – $926
Heat risk 5/10 · Moderate
- Hot days now (above 93°F)
- 8 days/yr
- Hot days in 30 yrs
- 18 days/yr
Wind risk 1/10 · Minimal
- Chance of severe wind over 30 yrs
- —
Air-quality risk 10/10 · Severe
- Unhealthy air days now
- 14 days/yr
- Unhealthy air days in 30 yrs
- 14 days/yr
Risk factors via First Street. Map © Google.
Why this score? — see what drove the B grade
The composite is a weighted blend of 9 inputs, each scored 0–100. Each bar is that input's sub-score; the figure is the points it added to the 100-point composite (weight × sub-score).
- Cash flow +30.0/30.0
- 1% rule +10.0/10.0
- DSCR +10.0/10.0
- ARV discount +7.5/15.0
- Schools +4.4/10.0
- Livability +3.6/5.0
- Rent growth +2.5/5.0
- Condition / age +2.5/5.0
- Appreciation +0.0/10.0
$50,000
🖨 Deal sheet 📄 Offer letter ✓ Due diligence
Listing remarks
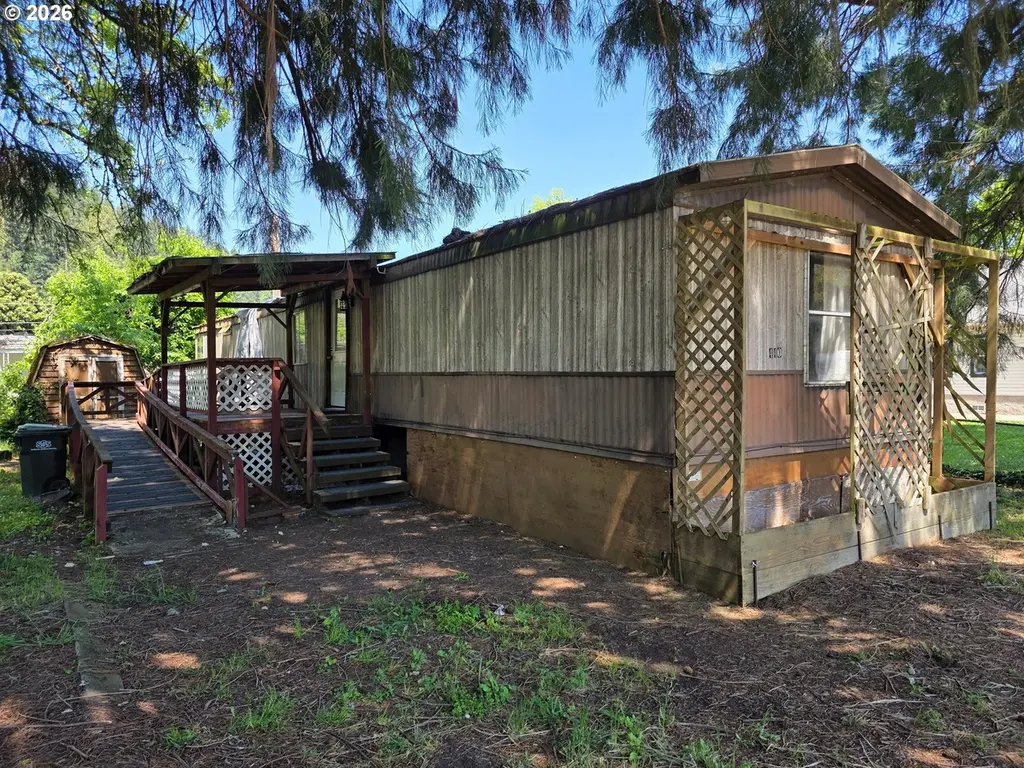
Investor alert!! Fixer 1988 single-wide on flat lot. Home is a 3 bedroom, 2 bath, 924 square feet. Fix up the home or replace with new double-wide or stick home!
Key facts
- 4,791 sq ft lot
- Built 1988
- Listed 31 days
Property features AI
Finance
- Other: Lot is approximately 0.11 acres (level)
- HOA & community: Not a senior community; No land lease
Exterior
- Parking: Off-street parking
- Utilities: Electric hot water and fuel; Public water; Public sewer; Cable and fiber optics internet available
- Home design: Manufactured home on real property; Residential property; Fixer condition; Main living area on a single level; No view
- Construction: Built in 1988; Metal roof; Skirting foundation
- Exterior features: Aluminum exterior; Level lot; Paved road access
Interior
- Kitchen: Kitchen on main level
- Bedrooms: Primary bedroom on main level; Second bedroom on main level; Third bedroom on main level
- Bathrooms: Two full bathrooms (both on main level)
- Heating & cooling: Forced air heating; No cooling
- Interior features: Crawl space basement; Dining room; Family room; Great room; Living room
Neighborhood map
What this means for you Summary
Snapshot
- This is a 3-bed/2.0-bath single-family listed at $50k.
Deal economics
- At list price, monthly cash flow is $40 ($479/yr) — positive.
- The deal already cash-flows at list — no discount required.
- Meets the 1% rule at list price ($990 rent vs $50k).
- Recommended offer: $48k (3.0% below list) — sets the bar for market timing.
Location & tenants
- Location reads 72/100 on livability (#106 in OR) — a middle-class / working-renter tenant base. Strengths: cost of living A+, housing A+, health & safety A+; Watch: crime F, amenities F, commute F.
- North Douglas SD 22 (rural): math 45% / reading 55% proficiency, ranked #43 of 183 in OR (top 24%) — acceptable for families but not a draw, mixed tenant base, ~2y average lease.
- Zoned schools: North Douglas Elementary School (math 27% / reading 54%, grade F, #167 of 412 statewide, top 41%, 223 students, 76% FRL); North Douglas High School (math 30% / reading 90%, grade C+, #21 of 143 statewide, top 15%, 123 students, 70% FRL) — zoned schools average 73% FRL vs 54% district-wide (20 pts higher); higher-poverty schools than district average — tighter screening recommended.
- Market conditions: 15 active listings in the ZIP; 1 comparable units currently listed for rent nearby; 190 units permitted in Douglas County in 2024 (0 in 5+ unit buildings).
Forward outlook
- Local home prices are declining (-3.0%/yr); year-one equity from $346 of loan paydown is wiped out by about $2k of value loss. Plan a longer hold.
- Douglas County population projected at -13% by 2050 — secular population decline; favor cash flow + early exit over multi-decade hold.
Negotiation context
- It's been on market 31 days — a 3% lower offer ($48k) is reasonable based on typical stale-listing flexibility.
- 2 sale attempts; this cycle's ask has dropped $10k (17%) from the opening price — seller is motivated, your offer sets the floor, not the list.
- Current owner paid $8k; list at $50k implies a 567% gain — meaningful room to come down on a strong offer.
Risks & watch-outs
- Watch-outs: flood insurance adds $427/mo.
- Climate carrying-cost: in FEMA flood zone AE (mandatory federal flood insurance); major wildfire risk; extreme-heat days projected 8→18/yr by 2055 (HVAC capex compounding) — expect insurance premiums to compound above CPI over the hold.
Questions for the listing agent
- It's been on market 31 days. Have you received any prior offers? Is the seller open to a 3% concession, seller financing, or rate buy-down credit?
- What's the actual annual flood-insurance premium (NFIP or private), and is the property in a SFHA with mandatory coverage?
- Is there a deadline driving the sale (1031 exchange, divorce, estate, relocation)? That informs how much negotiation room exists.
- Crime grade is F in this area — have there been break-ins, vandalism, or insurance claims at this property in the last 3 years? What carrier currently insures it and at what premium?
- What's the average days-on-market for RENTAL listings here right now (not sales)? A rising rental-DOM trend means longer vacancies and softer asking-rent achievability than the comps imply.
- What's the recent tenant-quality profile in this submarket — average credit score on applications, eviction rate, late-payment / NSF rate, and stable-employment percentage? A property-management company in the area should have these aggregated.
- How much new for-sale + rental construction is in the pipeline within 1–3 miles? Heavy new supply typically softens prices + rents 12–24 months out; constrained supply supports both.
Investment metrics
- 1% rule
- 1.98% ✓
- Cap rate
- 17.49%
- Cash-on-cash
- 39.98%
- DSCR
- 2.78
- GRM
- 4.2
CMA / ARV
- ARV (on-the-fly)
- $255,948
- Comps found
- 8
Show comp detail 8 sales within ~0.75 mi
| Address | Dist | Beds/Ba | Sqft | Sold | Price | $/sf | Match |
|---|---|---|---|---|---|---|---|
| 422 Elder St | 0.10mi | 3/1.0 | 1,008 (+9%) | 2mo | $295,000 | $293 | 75 |
| 317 S Cedar St | 0.04mi | 2/1.0 (-1) | 1,020 (+10%) | 9mo | $220,000 | $216 | 64 |
| 420 W D Ave | 0.29mi | 2/1.0 (-1) | 900 (-3%) | 16mo | $239,000 | $266 | 60 |
| 535 Elder St | 0.16mi | 3/1.0 | 840 (-9%) | 16mo | $240,000 | $286 | 60 |
| 504 Silver Ave | 0.35mi | 2/1.0 (-1) | 856 (-7%) | 4mo | $234,100 | $273 | 58 |
| 556 Payton Ave | 0.12mi | 2/1.0 (-1) | 1,040 (+13%) | 14mo | $253,000 | $243 | 53 |
| 303 Kent St | 0.49mi | 2/1.0 (-1) | 956 (+4%) | 13mo | $264,800 | $277 | 51 |
| 401 Lane Ave | 0.34mi | 3/1.0 | 1,056 (+14%) | 23mo | $325,000 | $308 | 37 |
Match score weights: distance 35% · size 25% · config 20% · recency 20%. Top-matched comps best support the ARV.
Projected returns pro-forma
-3.0% appreciation · 3.0% rent growth · sell at horizon
- IRR
- -10.3%
- Equity multiple
- 0.62×
- Total profit
- $-5,304
- Equity at exit
- $7,455
- IRR
- -0.3%
- Equity multiple
- 0.98×
- Total profit
- $-297
- Equity at exit
- $4,323
Cash invested: $14,000 (down + closing). Projections, not guarantees.
Landlord ↔ Tenant lean methodology
- Overall (STATE)
- 28 Tenant-Leaning
- State Oregon
- 28 Tenant-Leaning · D+6
- County
- — inherits STATE
- City
- — inherits STATE
ZIP-level market 97435
- Home prices YoY
- -9.2%
- Active inventory
- 15
- Price-to-rent
- 4.2×
Monthly cashflow live
- Estimated rent
- $990 medium interval (Pro) →
- Mortgage (P&I)
- −$262
- Tax from tax record
- −$33 /mo · $392/yr
- Insurance
- −$21
- Flood insurance flood zone
- −$427 /mo · $5,118/yr
- HOA
- −$0
- Vacancy / Maint / Mgmt
- −$208
- Net cashflow
- $40
Break-even live
UW: 25.0% down · 7.5% · 30yr · 1.5% tax · 5.0% vac · 8.0% maint · 8.0% mgmt
Financing live
Cash to close
- Down payment
- $12,500
- Closing costs
- $1,500
- Reserves months
- —
- Total cash needed
- —
Loan-product check · same deal, 3 products live
Conventional
25% down · 7.5% · 30yr
- Down + closing
- —
- Monthly P&I
- —
- Monthly cashflow
- —
- DSCR
- —
- Eligible?
- —
Personal DTI + credit; lowest rate.
DSCR
20% down · 8.5% · 30yr
- Down + closing
- —
- Monthly P&I
- —
- Monthly cashflow
- —
- DSCR
- —
- Eligible?
- —
No personal income docs; deal must DSCR.
Hard money
10% down · 12.0% · 12mo
- Down + closing
- —
- Monthly P&I
- —
- Monthly cashflow
- —
- DSCR
- —
- Eligible?
- —
Short-term bridge; refi at stabilization.
Rent comps 1 comps
| Address | Beds | Baths | Sqft | Rent | $/sqft | DOM | Units | Dist |
|---|---|---|---|---|---|---|---|---|
| 189 E C Ave Drain, OR | 3.0 | 2.0 | 1092 | $990 | $0.91 | 13d | 1 | 0.39mi |
Listing history 8 events
-
2026-06-13statusdays on market $50,000 Pending 31 DOM
-
2026-06-10days on market $50,000 Active 30 DOM
-
2026-06-09pricestatusdays on market $50,000 Active 29 DOM
-
2026-06-01status $60,000 Pending 28 DOM
-
2026-05-31days on market $60,000 Active 28 DOM
-
2026-05-30days on market $60,000 Active 27 DOM
-
2026-05-03$60,000 Active 161-char remark
-
2001-04-06soldstatus $7,500
ⓘ Source: listings_history table (triggers on properties + properties_extension) + one-shot
backfill from property_details.listing_events for pre-trigger history.
Tax reassessment forecast OR · Resets to sale price
- Current annual tax
- $392 · $33/mo
- Projected year-2 tax
- $485 · $40/mo
- Expected delta
- +$93/yr (+$8/mo · 23.8%)
ⓘ Screening estimate from a state-policy table — verify with the county assessor before closing.
Climate risk First Street
- Flood 7/10 Severe FEMA zone AE · 99% chance over 30 yrs
- Wildfire 6/10 Major
- Heat 5/10 Major 8 d/yr ≥93°F today · 18 d/yr by 30 yrs out
- Wind 1/10 Low
- Air quality 10/10 Extreme 14 unhealthy d/yr today · 14 by 30 yrs out
Nearby sold comps map
Loading sold comps map…
Walkable amenities ~0.75 mi
Loading nearby amenities…
Taxation est. · year 1
- Rental income
- $11,880
- − Mortgage interest
- −$2,801
- − Property taxes
- −$392
- − Insurance
- −$5,368
- − Repairs & maintenance
- −$950
- − Management
- −$950
- − Depreciation
- −$1,455
- Taxable loss
- −$36
- Est. tax savings @ 24.0%
- +$9
- After-tax cash flow
- $487/yr
For passive investors: Depreciation is non-cash, so a rental often shows a tax loss while cash-flowing — sheltering income. Rental losses are passive: they offset passive income freely, and up to $25,000/yr can offset ordinary (W-2) income if you actively participate and your MAGI is under $100k (phasing out to $0 by $150k); unused losses carry forward. On sale, claimed depreciation is recaptured at up to 25%, and gains may owe capital-gains tax (a 1031 exchange can defer both). Figures are a year-1 estimate at your 24.0% rate — not tax advice; consult a CPA.
Schools (NCES district)
- District
- North Douglas SD 22
- NCES district ID
- 4104350
- Math proficiency
- 45% ▲ 5.00%
- Reading proficiency
- 55% ▲ 5.00%
- Median HH income
- $42,306
- Composite
- 44.05/100
- National rank
- #6253
- State rank
- #43 of 183 in OR
Livability — Drain
- Score
- 72/100
- State rank
- #106
- US rank
- #5935
Category grades
Schools grade is shown separately in the Schools card above.
Census & demographics
- Census place
- Drain, OR
- Population (ZIP)
- 2,383
Population outlook (Douglas County) Hauer SSP2
- Today (2025)
- 105,191 people
- By 2030
- 102,664 · -2.4%
- By 2040
- 96,668 · -8.1%
- By 2050
- 91,279 · -13.2%
- By 2075
- 79,395 · -24.5%
- By 2100
- 66,107 · -37.2%
Race, ethnicity, and origin ACS 2023
- Neighborhood character
- Predominantly White (85%)
- Race & ethnicity
- White 85% Two or more races 7% Hispanic / Latino 4% Native American 3% Asian 2%
- Common ancestry
- Portuguese 5% Lithuanian 4% Slovak 2%
- Foreign-born
- 5% · Canada
- Languages at home
- 93% English-only · Spanish 2% German/W. Germanic 2% Other Indo-European 2%
Political lean MEDSL · Douglas
- 2024 margin
- Solid R (+37.7) · D 29.9% · R 67.6% · Other 2.5%
- 2008→2024 swing
- -17.6pp toward R · 2008: -20.1pp · 2024: -37.7pp
- All cycles
- 2024: R+37.7 2020: R+37.5 2016: R+39.4 2012: R+27.6 2008: R+20.1
Not yet ingested
- Civics
- —
Market trends
- HPI YoY
- ▼ -33.35%
- Current HPI
- 330.8867
- Rent YoY
- —
- Metro
- —
- State GDP YoY
- ▲ 2.05%
- F500 in state
- 2
Industry mix (Fortune 500 HQ in OR)
| Industry | F500 HQs | Revenue |
|---|---|---|
| Consumer Goods | 1 | $51B |
|
||
Price history
+566.7% since first listed6 events — show timeline
- 2026-06-11 Pending — RMLS
- 2026-06-09 Relisted — RMLS
- 2026-06-09 Price Changed $50,000 RMLS
- 2026-06-01 Pending — RMLS
- 2026-05-03 Listed $60,000 RMLS
- 2001-04-06 Sold (Public Records) $7,500 Public Records
Property tax history
+3.0%/yrLatest (2025): $392 · +3.3% YoY. Source: county tax records.
Cash-flow waterfall
monthlySold comps — $/sqft
last 12 mo · ≤1 miLoading sold comps…