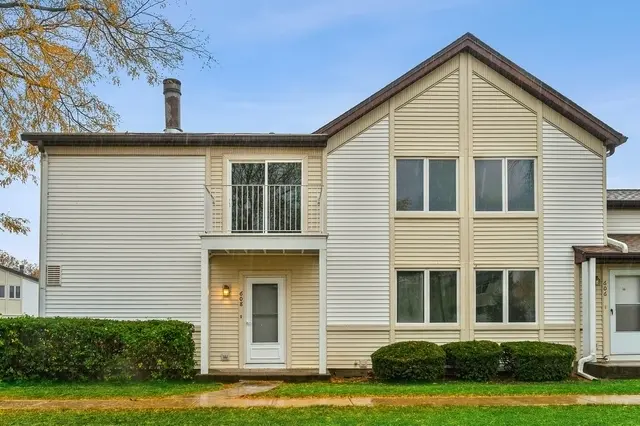
608 Inverrary Ln #608 · Buffalo Grove, IL
Flood risk 4/10 · Minor
- FEMA flood zone
- X (unshaded)
- Chance of flooding over 30 yrs
- 0.22%
- Est. flood insurance / yr
- $473 – $860
Fire risk 1/10 · Minimal
- Est. fire insurance / yr
- $804 – $1,492
Heat risk 3/10 · Minor
- Hot days now (above 99°F)
- 7 days/yr
- Hot days in 30 yrs
- 14 days/yr
Wind risk 2/10 · Minimal
- Chance of severe wind over 30 yrs
- 0.0%
Air-quality risk 4/10 · Minor
- Unhealthy air days now
- 4 days/yr
- Unhealthy air days in 30 yrs
- 5 days/yr
Risk factors via First Street. Map © Google.
Why this score? — see what drove the D grade
The composite is a weighted blend of 9 inputs, each scored 0–100. Each bar is that input's sub-score; the figure is the points it added to the 100-point composite (weight × sub-score).
- Cash flow +9.9/30.0
- ARV discount +8.0/15.0
- Schools +7.1/10.0
- 1% rule +4.0/10.0
- Condition / age +4.0/5.0
- Livability +3.9/5.0
- DSCR +2.8/10.0
- Rent growth +2.5/5.0
- Appreciation +0.0/10.0
$275,000
🖨 Deal sheet 📄 Offer letter ✓ Due diligence
Listing remarks
Beautifully updated 2 bedroom, 1 bath condo in desirable Inverrary featuring refinished SOLID hardwood floors, soft neutral Stonington Gray paint, and an open floor plan perfect for everyday living and entertaining. Spacious living room with cozy gas fireplace and newer PELLA sliding glass door leading to the NEW private balcony. Updated kitchen boasts white quartzite countertops, farmhouse sink, stainless steel appliances, breakfast bar seating, abundant real wood cabinetry, and dining area adjacent to the kitchen. The spacious primary suite offers wonderful natural light, walk-in closet, newer carpeting, cordless blinds, and updated private bath with newer vanity, Kohler toilet, mirror, m
Key facts
- Open floor plan
- Gas fireplace
- Farmhouse sink
Tags
Property features AI
Finance
- Other: Six-unit building; Living area reported from plans; Some unfinished lower area and total finished/unfinshed area recorded
- HOA & community: Monthly association fee of $230; Association fee covers water, parking, insurance, exterior maintenance, lawn care, scavenger and snow removal; Manager off-site; Pets allowed (cats and dogs); Association amenities include park and in-ground pool; school bus service noted
Exterior
- Parking: One garage space (attached garage, garage owned) with garage door opener; Two parking spaces total (includes unassigned/owned parking); Asphalt parking surface
- Utilities: Lake Michigan water source; Public sewer and storm sewer
- Home design: Attached single (end unit) condominium; Entry level 1; Rehab completed in 2022; Originally built approximately 51–60 years ago; Asphalt roof
- Construction: Aluminum siding; Concrete perimeter foundation
- Exterior features: Balcony; Common grounds; Zero lot line
Interior
- Kitchen: Range; Microwave; Dishwasher; Refrigerator; Eating area with breakfast bar and island
- Bedrooms: Master bedroom (second level) with full bath and blinds; Second bedroom (second level) with blinds
- Flooring: Hardwood in main living areas; Carpet in bedrooms; Stone flooring at foyer
- Bathrooms: One full bathroom with soaking tub
- Heating & cooling: Natural gas heating; Central air conditioning
- Interior features: Open floor plan with dining combo; Granite counters; Storage; Walk-in closet(s); Screens, drapes and other window treatments; One gas log fireplace located in living room (also noted at other rooms)
- Laundry & utility: Washer and dryer included; Washer hookup in common area / private laundry hookup noted
Neighborhood map
What this means for you Summary
Snapshot
- This is a 2-bed/1.0-bath condo listed at $275k. Condition is rated good.
Deal economics
- At list price, monthly cash flow is $-172 ($-2k/yr) — negative.
- To cash-flow at today's rent, offer at most $250k (9.0% below list).
- To meet the 1% rule (rent ≥ 1% of price), the offer needs to be $248k (9.8% below list).
- Recommended offer: $248k (9.8% below list) — sets the bar for 1% rule.
- Cap rate 5.5% vs local median 3.3% in Buffalo Grove — top-decile yield for the area; either an underpriced asset or a hidden risk that comps aren't pricing in. Stress-test before assuming the spread holds.
Location & tenants
- Location reads 77/100 on livability (#163 in IL, #3,025 nationally) — a middle-class / working-renter tenant base. Strengths: crime A+, employment A+, housing A+; Watch: amenities C-, health & safety C-, commute F.
- Adlai E Stevenson Hsd 125 (suburban): math 72% / reading 73% proficiency, ranked #3 of 620 in IL (top 0%) — strong family-tenant draw, lease renewals of 3-5y typical.
- Zoned schools: Adlai E Stevenson High School (math 72% / reading 73%, grade B+, #7 of 693 statewide, top 1%, 4,489 students, 0% FRL).
- Market conditions: 117 active listings in the ZIP; 30 comparable units currently listed for rent nearby; rentals leasing fast (median 7d on market — plan ~1-2 weeks tenant-placement turnaround); high-income renter base; 948 units permitted in Lake County in 2024 (424 in 5+ unit buildings).
- This rent is only 16% of the median local income ($183k/yr) — well below the 30% rent-burden line; pricing power to push rent on renewal without tenant pushback.
Forward outlook
- Local home prices are declining (-3.0%/yr); year-one equity from $2k of loan paydown is wiped out by about $8k of value loss. Plan a longer hold.
- Lake County population projected to shrink 8% by 2050 — rents likely to lag national; underwrite the cash flow, not the appreciation.
Negotiation context
- It's been on market 16 days — a 2% lower offer ($271k) is reasonable based on typical stale-listing flexibility.
- 6 sale attempts since 4y ago with the ask held roughly flat each time — persistent listings suggest the price (not the market) is what's stuck; bring a comps-based counter.
- Current owner paid $212k; 30% above their basis — modest negotiation headroom, anchor on the comps not their cost.
Questions for the listing agent
- What do current leases actually rent for vs. the listed asking? Can we see a recent rent roll and the last 12 months of T-12 income?
- Built in 1975 — when were the roof, HVAC, electrical panel, plumbing, and water heater last replaced?
- What does the HOA fee cover, when was the last increase, and are there any pending special assessments or reserve-fund shortfalls?
- Any open or pending special assessments — roof, HVAC, plumbing, elevator, façade? What's the per-unit balance and payoff schedule, and is the seller paying it off at close or rolling it to the buyer?
- Is there a deadline driving the sale (1031 exchange, divorce, estate, relocation)? That informs how much negotiation room exists.
- Schools are A-rated — typically a magnet for longer-tenancy family renters. What's the average tenant stay here, and is there a school-zone premium baked into asking?
- The area grade is low — what's the realistic commute time and amenity access for the typical tenant pool here? Any planned neighborhood developments (good or bad) we should know about?
- What's the average days-on-market for RENTAL listings here right now (not sales)? A rising rental-DOM trend means longer vacancies and softer asking-rent achievability than the comps imply.
- What's the recent tenant-quality profile in this submarket — average credit score on applications, eviction rate, late-payment / NSF rate, and stable-employment percentage? A property-management company in the area should have these aggregated.
- How much new apartment / multifamily construction is in the pipeline within 1–3 miles? Heavy new supply (>2% of stock underway) typically softens rents 12–24 months out; light construction supports rent growth.
Investment metrics
- 1% rule
- 0.90% ✗
- Cap rate
- 5.54%
- Cash-on-cash
- -2.68%
- DSCR
- 0.88
- GRM
- 9.2
CMA / ARV
- ARV (median comp)
- $277,929
- List price
- $275,000
- Delta
- -1.05%
- Verdict
- FAIR
- Comps
- 20 within 1.0 mi
Projected returns pro-forma
-3.0% appreciation · 3.0% rent growth · sell at horizon
- IRR
- -20.7%
- Equity multiple
- 0.28×
- Total profit
- $-55,329
- Equity at exit
- $41,003
- IRR
- -13.7%
- Equity multiple
- 0.20×
- Total profit
- $-61,547
- Equity at exit
- $23,777
Cash invested: $77,000 (down + closing). Projections, not guarantees.
Landlord ↔ Tenant lean methodology
- Overall (STATE)
- 43 Moderately Tenant-Leaning
- State Illinois
- 43 Moderately Tenant-Leaning · D+7
- County
- — inherits STATE
- City
- — inherits STATE
ZIP-level market 60015
- Active inventory
- 117
- Price-to-rent
- 9.2×
Monthly cashflow live
- Estimated rent
- $2,479 high interval (Pro) →
- Mortgage (P&I)
- −$1,442
- Tax est. 1.5%
- −$344 /mo · $4,125/yr
- Insurance
- −$115
- HOA
- −$230
- Vacancy / Maint / Mgmt
- −$521
- Net cashflow
- $-172
Break-even live
UW: 25.0% down · 7.5% · 30yr · 1.5% tax · 5.0% vac · 8.0% maint · 8.0% mgmt
Financing live
Cash to close
- Down payment
- $68,750
- Closing costs
- $8,250
- Reserves months
- —
- Total cash needed
- —
Loan-product check · same deal, 3 products live
Conventional
25% down · 7.5% · 30yr
- Down + closing
- —
- Monthly P&I
- —
- Monthly cashflow
- —
- DSCR
- —
- Eligible?
- —
Personal DTI + credit; lowest rate.
DSCR
20% down · 8.5% · 30yr
- Down + closing
- —
- Monthly P&I
- —
- Monthly cashflow
- —
- DSCR
- —
- Eligible?
- —
No personal income docs; deal must DSCR.
Hard money
10% down · 12.0% · 12mo
- Down + closing
- —
- Monthly P&I
- —
- Monthly cashflow
- —
- DSCR
- —
- Eligible?
- —
Short-term bridge; refi at stabilization.
Rent comps 30 comps
| Address | Beds | Baths | Sqft | Rent | $/sqft | DOM | Units | Dist |
|---|---|---|---|---|---|---|---|---|
| 536 Inverrary Ln Deerfield, IL | 2.0 | 1.5 | 1000 | $2,450 | $2.45 | 24d | 1 | 0.02mi |
| 544 Inverrary Ln Deerfield, IL | 2.0 | 1.5 | 922 | $2,650 | $2.87 | 24d | 1 | 0.03mi |
| 1411 Johnson Dr Unit 1326 Buffalo Grove, IL | 1.0 | 1.0 | 715 | $1,660 | $2.32 | 21d | 1 | 0.04mi |
| 746 Inverrary Ln Deerfield, IL | 2.0 | 1.5 | 992 | $2,500 | $2.52 | 24d | 1 | 0.10mi |
| 360 W Inverrary Ln Deerfield, IL | 2.0 | 2.5 | 1090 | $2,600 | $2.39 | 24d | 1 | 0.16mi |
| 341 Redwing Dr Deerfield, IL | 2.0 | 2.5 | 1386 | $2,650 | $1.91 | 4d | 1 | 0.20mi |
| 1701 Johnson Dr Buffalo Grove, IL | 1.0–2.0 | 1.0–2.0 | 795 | $2,590 | $3.26 | 2d | 38 | 0.36mi |
| 146 W Inverrary Ln Unit 146 Deerfield, IL | 2.0 | 1.0 | 992 | $2,349 | $2.37 | 7d | 1 | 0.36mi |
| 146 W Inverrary Ln Unit 146 Deerfield, IL | 2.0 | 1.0 | 992 | $2,400 | $2.42 | 24d | 1 | 0.36mi |
| 1216 Inverrary Ln #1216 Deerfield, IL | 2.0 | 1.0 | 1100 | $2,075 | $1.89 | 24d | 1 | 0.39mi |
| 1128 Johnson Dr Unit 3521 Buffalo Grove, IL | 2.0 | 2.0 | 975 | $2,150 | $2.21 | 21d | 1 | 0.43mi |
| 1326 Inverrary Ln #1326 Deerfield, IL | 3.0 | 1.0 | 992 | $2,100 | $2.12 | 20d | 1 | 0.45mi |
| 1225 Deerfield Pkwy Buffalo Grove, IL | 1.0–3.0 | 1.0–2.0 | 1000 | $2,290 | $2.29 | 1d | 17 | 0.58mi |
| 11 Marquette Pl Buffalo Grove, IL | 3.0 | 2.0 | 1330 | $2,950 | $2.22 | 1d | 1 | 0.62mi |
| 733 Plum Tree Ct Unit C2 Wheeling, IL | 2.0 | 1.0 | 1100 | $2,150 | $1.95 | 1d | 1 | 0.95mi |
| 272 Le Parc Cir Buffalo Grove, IL | 3.0 | 2.5 | 1450 | $3,200 | $2.21 | 1d | 1 | 0.99mi |
| 614 Le Parc Cir Unit 22-2 Buffalo Grove, IL | 2.0 | 1.0 | 1239 | $2,200 | $1.78 | 24d | 1 | 1.03mi |
| 1106 Wildberry Ct Unit B1 Wheeling, IL | 2.0 | 2.0 | 1100 | $2,500 | $2.27 | 10d | 1 | 1.09mi |
| 1106 Wildberry Ct Unit B1 Wheeling, IL | 2.0 | 2.0 | 1100 | $2,350 | $2.14 | 2d | 1 | 1.09mi |
| 1182 Northbury Ln Unit D2 Wheeling, IL | 2.0 | 2.0 | 1200 | $2,095 | $1.75 | 1d | 1 | 1.10mi |
| 1180 Northbury Ln Wheeling, IL | 3.0 | 2.0 | 1305 | $2,650 | $2.03 | 1d | 1 | 1.11mi |
| 576 Greystone Ln Unit C2 Wheeling, IL | 2.0 | 1.0 | 1200 | $2,400 | $2.00 | 12d | 1 | 1.13mi |
| 200 Hudson Ct Wheeling, IL | 1.0–2.0 | 1.0–2.0 | 954 | $2,665 | $2.79 | 1d | 11 | 1.18mi |
| 1168 Middlebury Ln Unit A1 Wheeling, IL | 3.0 | 2.0 | 1200 | $2,700 | $2.25 | 10d | 1 | 1.19mi |
| 250 McHenry Rd Wheeling, IL | 1.0–3.0 | 1.0–2.0 | 1185 | $3,140 | $2.65 | 1d | 33 | 1.26mi |
| 1160 Windbrooke Dr Unit 2 Buffalo Grove, IL | 1.0 | 1.0 | 800 | $1,950 | $2.44 | 24d | 1 | 1.34mi |
| 444 Parkway Dr Lincolnshire, IL | 2.0 | 1.0–2.0 | 887 | $3,999 | $4.51 | 1d | 16 | 1.34mi |
| 450 Manda Ln Wheeling, IL | 1.0–2.0 | 1.0–2.0 | 806 | $1,962 | $2.43 | 1d | 38 | 1.36mi |
| 1160 Windbrooke Dr Buffalo Grove, IL | 1.0–2.0 | 1.0–2.0 | 891 | $2,560 | $2.87 | 3d | 12 | 1.37mi |
| 500 W Dundee Rd Wheeling, IL | 2.0 | 1.0–2.0 | 1013 | $3,142 | $3.10 | 1d | 30 | 1.39mi |
HOA detail condo
- Monthly dues
- $230 · $2,760/yr
- Likely covers
- gas
- Assessments
- None detected in remarks — confirm with the listing agent.
Listing history 24 events
-
2026-06-18days on market $275,000 Active 16 DOM
-
2026-06-17days on market $275,000 Active 15 DOM
-
2026-06-16days on market $275,000 Active 14 DOM
-
2026-06-15days on market $275,000 Active 13 DOM
-
2026-06-13days on market $275,000 Active 11 DOM
-
2026-06-12days on market $275,000 Active 10 DOM
-
2026-06-09days on market $275,000 Active 7 DOM
-
2026-06-08days on market $275,000 Active 6 DOM
-
2026-06-07days on market $275,000 Active 5 DOM
-
2026-06-04days on market $275,000 Active 2 DOM
-
2026-06-02days on market $275,000 Active 1 DOM
-
2026-06-02days on market $275,000 Active 21 DOM
-
2026-06-01days on market $275,000 Active 20 DOM
-
2026-05-31days on market $275,000 Active 19 DOM
-
2026-05-13$2,500
-
2026-05-12$275,000 Active 1315-char remark
-
2026-01-31historical
-
2025-06-03Active
-
2023-11-08historical
-
2023-08-28Active
-
2023-01-04soldstatus $212,000 Closed
-
2022-12-28status Pending
-
2022-12-02historical Contingent - Continue to Show
-
2022-11-01$235,000 Active
ⓘ Source: listings_history table (triggers on properties + properties_extension) + one-shot
backfill from property_details.listing_events for pre-trigger history.
Climate risk First Street
- Flood 4/10 Moderate FEMA zone X (unshaded) · 22% chance over 30 yrs
- Wildfire 1/10 Low
- Heat 3/10 Moderate 7 d/yr ≥99°F today · 14 d/yr by 30 yrs out
- Wind 2/10 Low 0% chance of damaging wind over 30 yrs
- Air quality 4/10 Moderate 4 unhealthy d/yr today · 5 by 30 yrs out
Nearby sold comps map
Loading sold comps map…
Walkable amenities ~0.75 mi
Loading nearby amenities…
Taxation est. · year 1
- Rental income
- $29,751
- − Mortgage interest
- −$15,404
- − Property taxes
- −$4,125
- − Insurance
- −$1,375
- − Repairs & maintenance
- −$2,380
- − Management
- −$2,380
- − HOA
- −$2,760
- − Depreciation
- −$8,000
- Taxable loss
- −$6,673
- Est. tax savings @ 24.0%
- +$1,602
- After-tax cash flow
- $-461/yr
For passive investors: Depreciation is non-cash, so a rental often shows a tax loss while cash-flowing — sheltering income. Rental losses are passive: they offset passive income freely, and up to $25,000/yr can offset ordinary (W-2) income if you actively participate and your MAGI is under $100k (phasing out to $0 by $150k); unused losses carry forward. On sale, claimed depreciation is recaptured at up to 25%, and gains may owe capital-gains tax (a 1031 exchange can defer both). Figures are a year-1 estimate at your 24.0% rate — not tax advice; consult a CPA.
Condition & rehab AI · 12 photos
This well-maintained and updated condo is move-in ready with good condition and minimal repairs needed.
Value-add opportunities
- Both painting — fresh paint can enhance curb appeal and interior aesthetics
- Both landscaping — improved landscaping can increase curb appeal and property value
- Resale minor kitchen appliances — replacing outdated appliances can attract more buyers
Renovation cost estimate screening
Value-add ROI direction
- Both painting — fresh paint can enhance curb appeal and interior aesthetics ↑
- Both landscaping — improved landscaping can increase curb appeal and property value ↑
- Resale minor kitchen appliances — replacing outdated appliances can attract more buyers ↑
ⓘ Cost ranges are severity-bucket heuristics (US national rule-of-thumb). Get contractor quotes + a written scope before underwriting a rehab budget.
Schools (NCES district)
- District
- Adlai E Stevenson Hsd 125
- NCES district ID
- 1732580
- Math proficiency
- 72% ▼ -4.00%
- Reading proficiency
- 73% ▼ -2.00%
- Median HH income
- $146,434
- Composite
- 70.66/100
- National rank
- #253
- State rank
- #3 of 620 in IL
Livability — Buffalo Grove
- Score
- 77/100
- State rank
- #163
- US rank
- #3025
Category grades
Schools grade is shown separately in the Schools card above.
Census & demographics
- County
- Lake County · 591,991 people
- City population
- 42,872
- Metro
- Chicago-Naperville-Elgin, IL-IN-WI
- Population (ZIP)
- 28,096
- Household income
- $183,125
- Rent vs Own
- Severe rent burden
- 450.0
Population outlook (Lake County) Hauer SSP2
- Today (2025)
- 700,217 people
- By 2030
- 693,290 · -1.0%
- By 2040
- 673,588 · -3.8%
- By 2050
- 643,556 · -8.1%
- By 2075
- 562,792 · -19.6%
- By 2100
- 457,715 · -34.6%
Race, ethnicity, and origin ACS 2023
- Neighborhood character
- Predominantly White (84%)
- Race & ethnicity
- White 84% Asian 8% Hispanic / Latino 5% Two or more races 3% Black 1%
- Common ancestry
- Romanian 11% Scotch-Irish 10% Italian 4%
- Foreign-born
- 14% · China, South Korea, Canada
- Languages at home
- 82% English-only · Russian/Polish/Slavic 6% Other Indo-European 3% Spanish 3%
Political lean MEDSL · Lake
- 2024 margin
- Strong D (+20.8) · D 59.7% · R 38.9% · Other 1.4%
- 2008→2024 swing
- +1.1pp toward D · 2008: 19.6pp · 2024: 20.8pp
- All cycles
- 2024: D+20.8 2020: D+24.1 2016: D+20.3 2012: D+8.1 2008: D+19.6
Not yet ingested
- Civics
- —
Market trends
- HPI YoY
- ▼ -318.91%
- Current HPI
- 184.8993
- Rent YoY
- —
- Metro
- Chicago-Naperville-Elgin, IL-IN-WI
- State GDP YoY
- ▲ 1.59%
- F500 in state
- 60
Industry mix (Fortune 500 HQ in IL)
| Industry | F500 HQs | Revenue |
|---|---|---|
| Insurance | 4 | $201B |
|
||
| Consumer Goods | 4 | $87B |
|
||
| Industrial Machinery | 3 | $64B |
|
||
| Healthcare | 2 | $55B |
|
||
| Retail / Pharmacy | 1 | $148B |
|
||
| Agriculture / Food | 1 | $86B |
|
||
Price history
-99.0% since first listed13 events — show timeline
- 2026-06-17 Price Changed $2,450 MRED
- 2026-06-02 Listing Removed — MRED as Distributed by MLS Grid
- 2026-06-02 Listed $275,000 MRED as Distributed by MLS Grid
- 2026-05-13 Listed for Rent $2,500 MRED
- 2026-05-12 Listed — MRED as Distributed by MLS Grid
- 2026-01-31 Listing Removed — MRED as Distributed by MLS Grid
- 2025-06-03 Listed — MRED as Distributed by MLS Grid
- 2023-11-08 Listing Removed — MRED as Distributed by MLS Grid
- 2023-08-28 Listed — MRED as Distributed by MLS Grid
- 2023-01-04 Sold (MLS) $212,000 MRED as Distributed by MLS Grid
- 2022-12-28 Pending — MRED as Distributed by MLS Grid
- 2022-12-02 Contingent — MRED as Distributed by MLS Grid
- 2022-11-01 Listed $235,000 MRED as Distributed by MLS Grid
Cash-flow waterfall
monthlySold comps — $/sqft
last 12 mo · ≤1 miLoading sold comps…