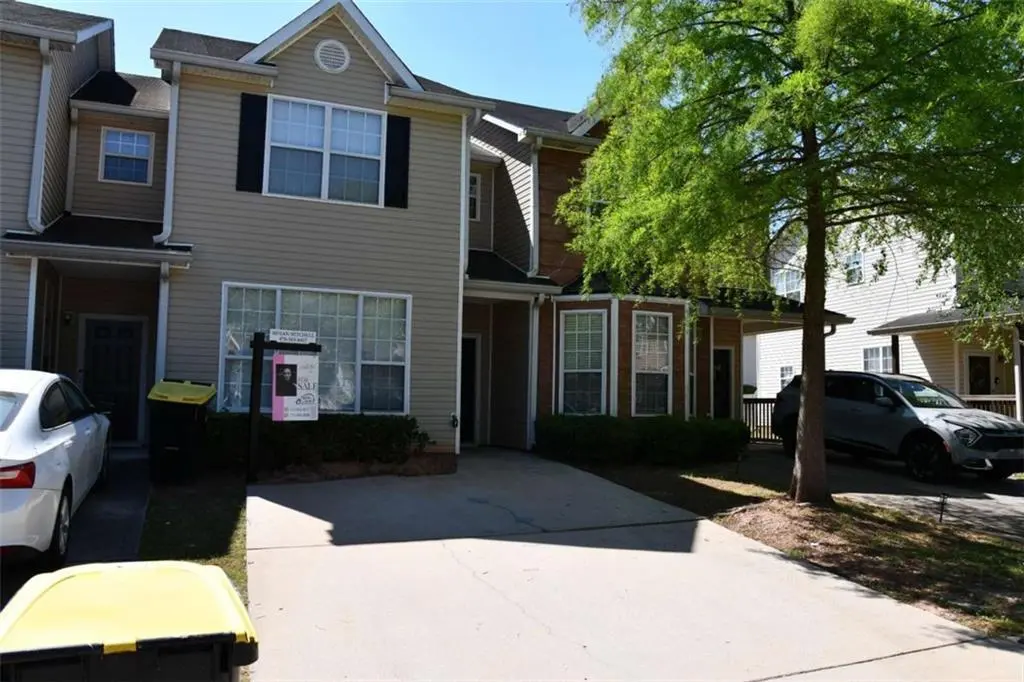
11322 Michelle Way · Lovejoy, GA
Flood risk 1/10 · Minimal
- FEMA flood zone
- X (unshaded)
- Chance of flooding over 30 yrs
- 0.0%
- Est. flood insurance / yr
- $507 – $1,088
Fire risk 3/10 · Minor
- Est. fire insurance / yr
- $963 – $1,789
Heat risk 6/10 · Moderate
- Hot days now (above 105°F)
- 7 days/yr
- Hot days in 30 yrs
- 19 days/yr
Wind risk 6/10 · Moderate
- Chance of severe wind over 30 yrs
- 27.0%
Air-quality risk 4/10 · Minor
- Unhealthy air days now
- 4 days/yr
- Unhealthy air days in 30 yrs
- 5 days/yr
Risk factors via First Street. Map © Google.
Why this score? — see what drove the C- grade
The composite is a weighted blend of 9 inputs, each scored 0–100. Each bar is that input's sub-score; the figure is the points it added to the 100-point composite (weight × sub-score).
- Cash flow +20.1/30.0
- ARV discount +11.4/15.0
- DSCR +6.4/10.0
- 1% rule +5.9/10.0
- Rent growth +3.1/5.0
- Livability +3.1/5.0
- Condition / age +2.5/5.0
- Schools +1.3/10.0
- Appreciation +0.0/10.0
$174,999
🖨 Deal sheet 📄 Offer letter ✓ Due diligence
Listing remarks
This well-maintained 3-bedroom, 2.5-bath townhome offers a spacious open layout perfect for everyday living and entertaining. The kitchen flows into the living and dining areas, while upstairs features a private owner's suite and two additional bedrooms ideal for guests or a home office. Conveniently located near shopping, dining, and major highways, this home is perfect for first-time buyers or those looking for low-maintenance living. Preferred lender: Rick Guerrero with The Mortgage Firm . Ask about available buyer incentives! Schedule your showing today
Key facts
- $40 HOA
- Built 2004
- Listed 40 days
Property features AI
Finance
- Other: Directions: use GPS; County: Clayton, GA
- HOA & community: HOA exists; Annual association fee of $480; Association covers grounds and structure maintenance
Exterior
- Parking: Parking pad
- Utilities: Public water; Public sewer; Cable available; Electricity available; Natural gas available; Phone available
- Home design: Two levels; Resale property; Entry level and other room types include attic and other
- Construction: Brick and vinyl siding exterior; Composition roof; Slab foundation
- Exterior features: Homeowners association; Water frontage: none
Interior
- Kitchen: Eat-in kitchen; Dishwasher; Refrigerator
- Bedrooms: Three bedrooms on upper level; Bedroom features: none specified
- Flooring: Carpet; Laminate
- Bathrooms: Two full bathrooms; One half bathroom (main level)
- Heating & cooling: Central heating; Electric heating available; Natural gas heating available; Central air conditioning; Ceiling fans; Electric cooling available; Gas cooling available
- Interior features: High-speed internet available; Walk-in closet(s); 2+ common walls
- Laundry & utility: Laundry located in kitchen; Electric water heater
Neighborhood map
What this means for you Summary
Snapshot
- This is a 3-bed/2.0-bath townhouse listed at $175k.
Deal economics
- At list price, monthly cash flow is $219 ($3k/yr) — positive.
- The deal already cash-flows at list — no discount required.
- Meets the 1% rule at list price ($2k rent vs $175k).
- Recommended offer: $170k (3.0% below list) — sets the bar for market timing.
- Cap rate 7.8% vs local median 4.4% in Lovejoy — top-decile yield for the area; either an underpriced asset or a hidden risk that comps aren't pricing in. Stress-test before assuming the spread holds.
Location & tenants
- Location reads 62/100 on livability (#317 in GA) — a middle-class / working-renter tenant base. Strengths: cost of living A+, housing A+; Watch: employment C-, schools F, amenities F.
- Clayton County (suburban): math 11% / reading 20% proficiency, ranked #155 of 174 in GA (top 89%) — low school quality limits family demand, transient renter base, plan for 1-2y turnover; 78% free/reduced lunch — lower-income household profile, screen leases tightly.
- Market conditions: Rents rising (+2.2%/yr); 547 active listings in the ZIP; 38 comparable units currently listed for rent nearby; rentals at typical pace (median 24d on market — plan ~3-4 weeks tenant-placement turnaround); 45% of comp listings sitting > 30 days — soft ceiling on asking rent; solid renter incomes; 865 units permitted in Clayton County in 2024 (448 in 5+ unit buildings).
Forward outlook
- Local home prices are declining (-3.0%/yr); year-one equity from $1k of loan paydown is wiped out by about $5k of value loss. Plan a longer hold.
- Clayton County population projected at +29% by 2050 — long-run rental-demand tailwind backs the buy-and-hold thesis.
Negotiation context
- It's been on market 41 days — a 3% lower offer ($170k) is reasonable based on typical stale-listing flexibility.
- 4 sale attempts since 12y ago with the ask held roughly flat each time — persistent listings suggest the price (not the market) is what's stuck; bring a comps-based counter.
- Current owner paid $114k; list at $175k implies a 53% gain — meaningful room to come down on a strong offer.
Risks & watch-outs
- Climate carrying-cost: major wind risk, 27% chance of damaging wind over 30y; extreme-heat days projected 7→19/yr by 2055 (HVAC capex compounding) — expect insurance premiums to compound above CPI over the hold.
Questions for the listing agent
- It's been on market 41 days. Have you received any prior offers? Is the seller open to a 3% concession, seller financing, or rate buy-down credit?
- What does the HOA fee cover, when was the last increase, and are there any pending special assessments or reserve-fund shortfalls?
- Is there a deadline driving the sale (1031 exchange, divorce, estate, relocation)? That informs how much negotiation room exists.
- Schools are F-rated, which usually means shorter tenancies and higher turnover. Who's the typical renter profile here, and what's been the actual vacancy rate?
- What's the average days-on-market for RENTAL listings here right now (not sales)? A rising rental-DOM trend means longer vacancies and softer asking-rent achievability than the comps imply.
- What's the recent tenant-quality profile in this submarket — average credit score on applications, eviction rate, late-payment / NSF rate, and stable-employment percentage? A property-management company in the area should have these aggregated.
- How much new for-sale + rental construction is in the pipeline within 1–3 miles? Heavy new supply typically softens prices + rents 12–24 months out; constrained supply supports both.
Investment metrics
- 1% rule
- 1.09% ✓
- Cap rate
- 7.79%
- Cash-on-cash
- 5.36%
- DSCR
- 1.24
- GRM
- 7.6
CMA / ARV
- ARV (median comp)
- $191,757
- List price
- $174,999
- Delta
- -8.74%
- Verdict
- FAIR
- Comps
- 20 within 1.0 mi
Show comp detail 12 sales within ~0.75 mi
| Address | Dist | Beds/Ba | Sqft | Sold | Price | $/sf | Match |
|---|---|---|---|---|---|---|---|
| 2296 Nicole Dr | 0.09mi | 3/2.5 | 1,584 (+10%) | 1mo | $200,000 | $126 | 77 |
| 2351 Brianna Dr | 0.17mi | 4/2.5 (+1) | 1,654 (+15%) | 3mo | $190,000 | $115 | 58 |
| 11522 Kimberly Way | 0.50mi | 3/2.5 | 1,579 (+10%) | 1mo | $275,491 | $174 | 58 |
| 11514 Kimberly Way | 0.49mi | 3/2.5 | 1,579 (+10%) | 2mo | $285,990 | $181 | 58 |
| 11518 Kimberly Way | 0.50mi | 3/2.5 | 1,579 (+10%) | 2mo | $275,491 | $174 | 57 |
| 11524 Kimberly Way | 0.53mi | 3/2.5 | 1,579 (+10%) | 0mo | $245,490 | $155 | 57 |
| 11526 Kimberly Way | 0.50mi | 3/2.5 | 1,579 (+10%) | 1mo | $286,490 | $181 | 57 |
| 11535 Kimberly Way Lot 11 | 0.51mi | 3/2.5 | 1,579 (+10%) | 2mo | $269,990 | $171 | 56 |
| 11531 Kimberly Way Lot 09 | 0.53mi | 3/2.5 | 1,579 (+10%) | 1mo | $279,990 | $177 | 56 |
| 11552 Kimberly Way #29 | 0.54mi | 3/2.5 | 1,579 (+10%) | 2mo | $269,990 | $171 | 55 |
| 11541 Kimberly Way | 0.55mi | 3/2.5 | 1,579 (+10%) | 2mo | $269,590 | $171 | 55 |
| 11539 Kimberly Way Lot 13 | 0.55mi | 3/2.5 | 1,579 (+10%) | 3mo | $269,990 | $171 | 54 |
Match score weights: distance 35% · size 25% · config 20% · recency 20%. Top-matched comps best support the ARV.
Projected returns pro-forma
-3.0% appreciation · 2.2% rent growth · sell at horizon
- IRR
- -8.9%
- Equity multiple
- 0.68×
- Total profit
- $-15,866
- Equity at exit
- $26,093
- IRR
- -0.5%
- Equity multiple
- 0.97×
- Total profit
- $-1,711
- Equity at exit
- $15,131
Cash invested: $49,000 (down + closing). Projections, not guarantees.
Landlord ↔ Tenant lean methodology
- Overall (STATE)
- 90 Strongly Landlord-Friendly
- State Georgia
- 90 Strongly Landlord-Friendly · R+3
- County
- — inherits STATE
- City
- — inherits STATE
ZIP-level market 30228
- Home prices YoY
- -24.3%
- Rents YoY
- 2.2%
- Active inventory
- 547
- Price-to-rent
- 7.6×
Monthly cashflow live
- Estimated rent
- $1,912 high interval (Pro) →
- Mortgage (P&I)
- −$918
- Tax from tax record
- −$261 /mo · $3,133/yr
- Insurance
- −$73
- HOA
- −$40
- Vacancy / Maint / Mgmt
- −$402
- Net cashflow
- $219
Break-even live
UW: 25.0% down · 7.5% · 30yr · 1.5% tax · 5.0% vac · 8.0% maint · 8.0% mgmt
Financing live
Cash to close
- Down payment
- $43,750
- Closing costs
- $5,250
- Reserves months
- —
- Total cash needed
- —
Loan-product check · same deal, 3 products live
Conventional
25% down · 7.5% · 30yr
- Down + closing
- —
- Monthly P&I
- —
- Monthly cashflow
- —
- DSCR
- —
- Eligible?
- —
Personal DTI + credit; lowest rate.
DSCR
20% down · 8.5% · 30yr
- Down + closing
- —
- Monthly P&I
- —
- Monthly cashflow
- —
- DSCR
- —
- Eligible?
- —
No personal income docs; deal must DSCR.
Hard money
10% down · 12.0% · 12mo
- Down + closing
- —
- Monthly P&I
- —
- Monthly cashflow
- —
- DSCR
- —
- Eligible?
- —
Short-term bridge; refi at stabilization.
Rent comps 38 comps
| Address | Beds | Baths | Sqft | Rent | $/sqft | DOM | Units | Dist |
|---|---|---|---|---|---|---|---|---|
| 11352 Michelle Way Lovejoy, GA | 3.0 | 2.5 | 1440 | $1,485 | $1.03 | 12d | 1 | 0.06mi |
| 2251 Nicole Dr #119 Hampton, GA | 3.0 | 2.5 | 1324 | $1,700 | $1.28 | 24d | 1 | 0.07mi |
| 2275 Nicole Dr Lovejoy, GA | 4.0 | 2.0 | 1800 | $1,835 | $1.02 | 5d | 1 | 0.08mi |
| 2306 Nicole Dr Lovejoy, GA | 3.0 | 2.5 | 1324 | $1,800 | $1.36 | 43d | 1 | 0.11mi |
| 2411 Brianna Dr Lovejoy, GA | 3.0 | 2.0 | 1432 | $1,826 | $1.28 | 2d | 1 | 0.13mi |
| 2361 Brianna Dr Lovejoy, GA | 3.0 | 2.5 | 1384 | $1,525 | $1.10 | 21d | 1 | 0.17mi |
| 2367 Brianna Dr Lovejoy, GA | 3.0 | 2.5 | 1440 | $1,695 | $1.18 | 43d | 1 | 0.17mi |
| 2257 Sugarleaf Trl Lovejoy, GA | 3.0 | 2.0 | 1624 | $1,775 | $1.09 | 43d | 1 | 0.19mi |
| 11523 Vinea Ln Lovejoy, GA | 3.0 | 2.0 | 1557 | $1,850 | $1.19 | 43d | 1 | 0.22mi |
| 11560 Winston Dr Lovejoy, GA | 3.0 | 3.0 | 1710 | $2,710 | $1.58 | 43d | 1 | 0.37mi |
| 10938 Wheeler Trce Lovejoy, GA | 3.0 | 3.0 | 1692 | $1,879 | $1.11 | 43d | 1 | 0.45mi |
| 11649 Mendenhall Ct Hampton, GA | 3.0 | 2.5 | 1568 | $2,300 | $1.47 | 20d | 1 | 0.52mi |
| 11531 Kimberly Way Lovejoy, GA | 3.0 | 2.5 | 1579 | $2,200 | $1.39 | 4d | 1 | 0.53mi |
| 11522 Kimberly Way Lovejoy, GA | 3.0 | 2.5 | 1700 | $2,200 | $1.29 | 4d | 1 | 0.53mi |
| 11866 Registry Blvd Unit 1 Hampton, GA | 3.0 | 2.0 | 1488 | $1,650 | $1.11 | 24d | 1 | 0.57mi |
| 2056 Registry Pl Lovejoy, GA | 3.0 | 2.0 | 1488 | $1,825 | $1.23 | 43d | 1 | 0.60mi |
| 11722 Chatham Dr Hampton, GA | 3.0 | 2.5 | 1600 | $2,300 | $1.44 | 24d | 1 | 0.60mi |
| 1992 Lovejoy Rd Lovejoy, GA | 1.0–3.0 | 1.0–2.0 | 1085 | $1,902 | $1.75 | 1d | 25 | 0.64mi |
| 11236 James Madison Dr Hampton, GA | 3.0 | 2.5 | 1518 | $1,870 | $1.23 | 43d | 1 | 0.74mi |
| 2019 Grove Way Lovejoy, GA | 3.0 | 2.5 | 1524 | $1,395 | $0.92 | 43d | 1 | 0.78mi |
| 1902 Grove Way Lovejoy, GA | 3.0 | 2.5 | 1592 | $1,555 | $0.98 | 3d | 1 | 0.79mi |
| 11942 Fuller St Lovejoy, GA | 3.0 | 2.5 | 1421 | $1,639 | $1.15 | 43d | 1 | 0.81mi |
| 11940 Fuller St Lovejoy, GA | 3.0 | 2.5 | 1421 | $1,699 | $1.20 | 43d | 1 | 0.82mi |
| 1863 Grove Way Lovejoy, GA | 3.0 | 2.5 | 1592 | $1,660 | $1.04 | 24d | 1 | 0.82mi |
| 10997 Big Sky Dr Lovejoy, GA | 2.0 | 1.0 | 1110 | $1,250 | $1.13 | 5d | 1 | 0.87mi |
| 1578 Onalee Dr Hampton, GA | 3.0 | 2.5 | 1709 | $1,800 | $1.05 | 24d | 1 | 0.89mi |
| 11877 Fuller St Lovejoy, GA | 3.0 | 2.5 | 1386 | $1,609 | $1.16 | 24d | 1 | 0.92mi |
| 1781 Fielding Way Lovejoy, GA | 3.0 | 2.5 | 1370 | $1,545 | $1.13 | 43d | 1 | 0.93mi |
| 11015 Tara Blvd Lovejoy, GA | 1.0–3.0 | 1.0–2.0 | 1113 | $1,815 | $1.63 | 43d | 1 | 0.95mi |
| 2762 Hunters Ct Hampton, GA | 3.0 | 2.5 | 1702 | $1,870 | $1.10 | 20d | 1 | 1.03mi |
| 10911 Tara Blvd Lovejoy, GA | 1.0–3.0 | 1.0–2.0 | 1150 | $1,795 | $1.56 | 43d | 1 | 1.06mi |
| 12227 Tara Blvd Lovejoy, GA | 1.0–3.0 | 1.0–2.0 | 1179 | $1,913 | $1.62 | 1d | 13 | 1.08mi |
| 11035 Shannon Cir Hampton, GA | 3.0 | 2.0 | 1320 | $1,606 | $1.22 | 12d | 1 | 1.14mi |
| 30 Winston Way Hampton, GA | 3.0 | 2.0 | 924 | $1,400 | $1.52 | 43d | 1 | 1.19mi |
| 10887 Tara Blvd Hampton, GA | 3.0 | 2.5 | 1756 | $2,032 | $1.16 | 4d | 10 | 1.26mi |
| 1591 Elizabeth Ln Hampton, GA | 3.0 | 2.0 | 1352 | $1,591 | $1.18 | 43d | 1 | 1.32mi |
| 1652 Thorn Ridge Trl Hampton, GA | 3.0 | 2.0 | 1360 | $1,960 | $1.44 | 43d | 1 | 1.40mi |
| 10903 Thrasher Rd Hampton, GA | 3.0 | 2.0 | 1412 | $1,725 | $1.22 | 21d | 1 | 1.42mi |
HOA detail
- Monthly dues
- $40 · $480/yr
Listing history 23 events
-
2026-06-15days on market $174,999 Active 41 DOM
-
2026-06-13days on market $174,999 Active 39 DOM
-
2026-06-09days on market $174,999 Active 35 DOM
-
2026-06-08days on market $174,999 Active 34 DOM
-
2026-06-07days on market $174,999 Active 33 DOM
-
2026-06-04days on market $174,999 Active 30 DOM
-
2026-06-03days on market $174,999 Active 29 DOM
-
2026-06-02days on market $174,999 Active 28 DOM
-
2026-06-01days on market $174,999 Active 27 DOM
-
2026-05-31days on market $174,999 Active 26 DOM
-
2026-05-05$174,999 Active 572-char remark
-
2026-04-30price $174,999 572-char remark
-
2026-04-17$179,999 New 572-char remark
-
2026-03-20soldstatus $114,042
-
2026-03-20soldstatus $114,042
-
2026-02-04historical $1,395
-
2026-01-01price $1,395
-
2025-11-21$1,495
-
2021-12-13soldstatus $2,514,000
-
2014-07-16historical
-
2014-07-15status Back On Market
-
2014-07-08status Under Contract
-
2014-04-15$65,000 New
ⓘ Source: listings_history table (triggers on properties + properties_extension) + one-shot
backfill from property_details.listing_events for pre-trigger history.
Tax reassessment forecast GA · Resets to sale price
- Current annual tax
- $3,133 · $261/mo
- Projected year-2 tax
- $3,133 · $261/mo
- Expected delta
- $0/yr ($0/mo · 0.0%)
ⓘ Screening estimate from a state-policy table — verify with the county assessor before closing.
Climate risk First Street
- Flood 1/10 Low FEMA zone X (unshaded) · 0% chance over 30 yrs
- Wildfire 3/10 Moderate
- Heat 6/10 Major 7 d/yr ≥105°F today · 19 d/yr by 30 yrs out
- Wind 6/10 Major 27% chance of damaging wind over 30 yrs
- Air quality 4/10 Moderate 4 unhealthy d/yr today · 5 by 30 yrs out
Nearby sold comps map
Loading sold comps map…
Walkable amenities ~0.75 mi
Loading nearby amenities…
Taxation est. · year 1
- Rental income
- $22,945
- − Mortgage interest
- −$9,803
- − Property taxes
- −$3,133
- − Insurance
- −$875
- − Repairs & maintenance
- −$1,836
- − Management
- −$1,836
- − HOA
- −$480
- − Depreciation
- −$5,091
- Taxable loss
- −$108
- Est. tax savings @ 24.0%
- +$26
- After-tax cash flow
- $2,652/yr
For passive investors: Depreciation is non-cash, so a rental often shows a tax loss while cash-flowing — sheltering income. Rental losses are passive: they offset passive income freely, and up to $25,000/yr can offset ordinary (W-2) income if you actively participate and your MAGI is under $100k (phasing out to $0 by $150k); unused losses carry forward. On sale, claimed depreciation is recaptured at up to 25%, and gains may owe capital-gains tax (a 1031 exchange can defer both). Figures are a year-1 estimate at your 24.0% rate — not tax advice; consult a CPA.
Schools (NCES district)
- District
- Clayton County
- NCES district ID
- 1301230
- Math proficiency
- 11% ▼ -13.00%
- Reading proficiency
- 20% ▼ -9.00%
- Median HH income
- $42,266
- Composite
- 13.41/100
- National rank
- #9527
- State rank
- #155 of 174 in GA
Livability — Lovejoy
- Score
- 62/100
- State rank
- #317
- US rank
- #17071
Category grades
Schools grade is shown separately in the Schools card above.
Census & demographics
- Census place
- Lovejoy, GA
- County
- Henry County · 316,359 people
- City population
- 606
- Metro
- Atlanta-Sandy Springs-Alpharetta, GA
- Population (ZIP)
- 52,402
- Household income
- $82,619
- Rent vs Own
- Severe rent burden
- 1285.0
Population outlook (Clayton County) Hauer SSP2
- Today (2025)
- 310,777 people
- By 2030
- 329,762 · +6.1%
- By 2040
- 368,052 · +18.4%
- By 2050
- 401,196 · +29.1%
- By 2075
- 472,488 · +52.0%
- By 2100
- 500,446 · +61.0%
Race, ethnicity, and origin ACS 2023
- Neighborhood character
- Majority Black (63%)
- Race & ethnicity
- Black 63% White 23% Hispanic / Latino 8% Two or more races 6% Asian 2%
- Hispanic origin (detail)
- Mexican 5% Puerto Rican 1%
- Common ancestry
- Hispanic 4% Lithuanian 1% Italian 1%
- Foreign-born
- 9% · Canada, Vietnam, Jamaica
- Languages at home
- 89% English-only · Spanish 6% French/Haitian/Cajun 2% Vietnamese 1%
Political lean MEDSL · Clayton
- 2024 margin
- Solid D (+69.2) · D 84.3% · R 15.1%
- 2008→2024 swing
- +2.8pp toward D · 2008: 66.4pp · 2024: 69.2pp
- All cycles
- 2024: D+69.2 2020: D+70.9 2016: D+71.9 2012: D+70.1 2008: D+66.4
Not yet ingested
- Civics
- —
Market trends
- HPI YoY
- ▼ -71.11%
- Current HPI
- 222.0357
- Rent YoY
- ▲ 2.20%
- Metro
- Atlanta-Sandy Springs-Alpharetta, GA
- State GDP YoY
- ▲ 2.66%
- F500 in state
- 28
Industry mix (Fortune 500 HQ in GA)
| Industry | F500 HQs | Revenue |
|---|---|---|
| Paper / Packaging | 2 | $29B |
|
||
| Retail | 1 | $160B |
|
||
| Transportation / Logistics | 1 | $91B |
|
||
| Airlines | 1 | $62B |
|
||
| Consumer Goods | 1 | $47B |
|
||
| Utilities | 1 | $25B |
|
||
Price history
+169.2% since first listed13 events — show timeline
- 2026-06-15 Listing Removed — GAMLS
- 2026-04-30 Price Changed $174,999 GAMLS
- 2026-04-17 Listed $179,999 GAMLS
- 2026-03-20 Sold (Public Records) $114,042 Public Records
- 2026-03-20 Sold (Public Records) $114,042 Public Records
- 2026-02-04 Rental Removed $1,395 GAMLS
- 2026-01-01 Price Changed $1,395 GAMLS
- 2025-11-21 Listed for Rent $1,495 GAMLS
- 2021-12-13 Sold (Public Records) $2,514,000 Public Records
- 2014-07-16 Listing Removed — GAMLS
- 2014-07-15 Relisted — GAMLS
- 2014-07-08 Pending — GAMLS
- 2014-04-15 Listed $65,000 GAMLS
Property tax history
+5.0%/yrLatest (2025): $3,133 · -0.2% YoY. Source: county tax records.
Cash-flow waterfall
monthlySold comps — $/sqft
last 12 mo · ≤1 miLoading sold comps…