7429 Saint Lukes Rd · Land O' Lakes, FL
Flood risk 1/10 · Minimal
- FEMA flood zone
- X (unshaded)
- Chance of flooding over 30 yrs
- 0.0%
- Est. flood insurance / yr
- $507 – $1,088
Fire risk 6/10 · Moderate
- Est. fire insurance / yr
- $947 – $1,759
Heat risk 10/10 · Severe
- Hot days now (above 109°F)
- 7 days/yr
- Hot days in 30 yrs
- 26 days/yr
Wind risk 9/10 · Severe
- Chance of severe wind over 30 yrs
- 99.0%
Air-quality risk 2/10 · Minimal
- Unhealthy air days now
- 1 days/yr
- Unhealthy air days in 30 yrs
- 1 days/yr
Risk factors via First Street. Map © Google.
Why this score? — see what drove the B- grade
The composite is a weighted blend of 9 inputs, each scored 0–100. Each bar is that input's sub-score; the figure is the points it added to the 100-point composite (weight × sub-score).
- Cash flow +30.0/30.0
- 1% rule +10.0/10.0
- DSCR +10.0/10.0
- ARV discount +4.7/15.0
- Schools +4.3/10.0
- Livability +2.5/5.0
- Condition / age +2.5/5.0
- Rent growth +1.6/5.0
- Appreciation +0.0/10.0
$165,000
🖨 Deal sheet 📄 Offer letter ✓ Due diligence
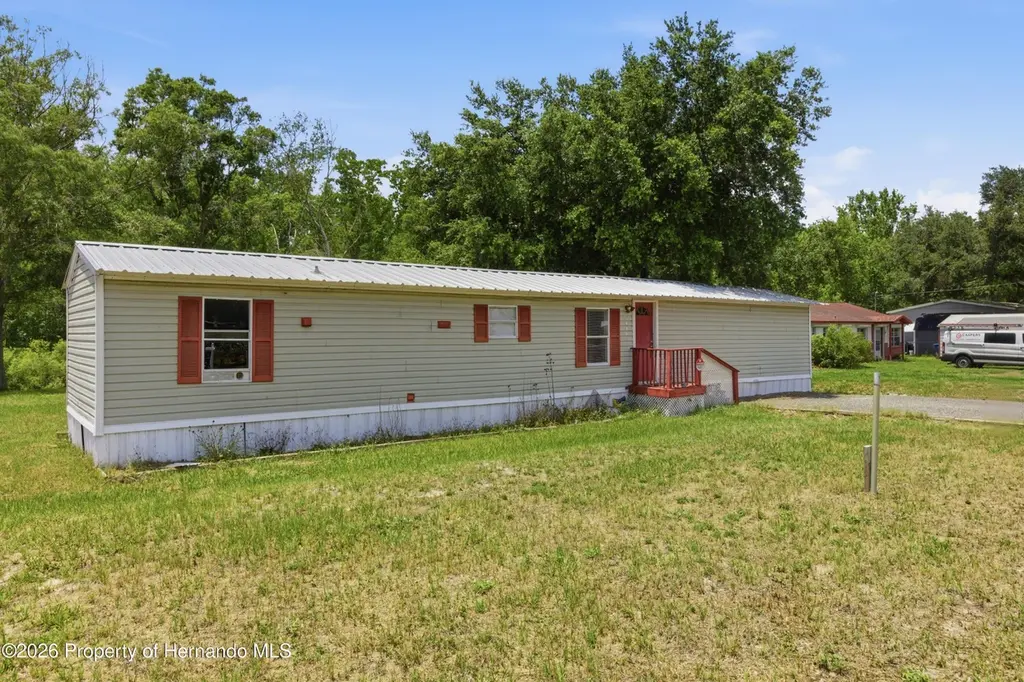
Listing remarks
Welcome to this great fixer-upper opportunity! This 3-bedroom, 2-bath mobile home situated on over a quarter acre of land, offering the perfect blend of comfort, space, and privacy. This property features an inviting living area, a functional updated kitchen with ample cabinet space, and a split-bedroom floor plan designed for everyday living. Step outside and enjoy the oversized yard with endless possibilities -- perfect for entertaining, gardening, pets, RV/boat parking and hookup, or simply relaxing and enjoying the extra outdoor space. Whether you're a first-time homebuyer, looking to downsize, or searching for an investment opportunity, this property offers affordability without sacrif
Key facts
- Oversized yard
- Rv boat parking
- Updated kitchen
Tags
Property features AI
Finance
- Other: Property condition: fixer; Current use: manufactured home
Exterior
- Parking: RV access/parking
- Utilities: Private water; Cable available; Water available; Sewer: unknown
- Home design: Residential mobile home; Single wide; One story; Attached property
- Construction: Vinyl siding
- Exterior features: Lot features: other; 0.27-acre lot; Zoned R1-MH (Residential single-family housing)
Interior
- Kitchen: Dishwasher; Electric range; Microwave
- Bedrooms: Single-wide mobile home layout
- Flooring: Carpet; Laminate
- Bathrooms: 2 full bathrooms
- Heating & cooling: Central heating; Central air conditioning
- Interior features: Unfurnished; 3 total rooms
Neighborhood map
What this means for you Summary
Snapshot
- This is a 3-bed/2.0-bath manufactured listed at $165k.
Deal economics
- At list price, monthly cash flow is $941 ($11k/yr) — positive.
- The deal already cash-flows at list — no discount required.
- Meets the 1% rule at list price ($3k rent vs $165k).
- Cap rate 13.1% vs local median 3.7% in Land O' Lakes — top-decile yield for the area; either an underpriced asset or a hidden risk that comps aren't pricing in. Stress-test before assuming the spread holds.
Location & tenants
- Location reads: area grade B — affects rentability + tenant quality, not the cash-flow math above.
- Pasco (suburban): math 50% / reading 52% proficiency, ranked #32 of 73 in FL (top 44%) — acceptable for families but not a draw, mixed tenant base, ~2y average lease.
- Market conditions: Rents falling (-3.8%/yr); 712 active listings in the ZIP; 1 comparable units currently listed for rent nearby; high-income renter base; 6,765 units permitted in Pasco County in 2024 (1,250 in 5+ unit buildings).
Forward outlook
- Local home prices are declining (-3.0%/yr); year-one equity from $1k of loan paydown is wiped out by about $5k of value loss. Plan a longer hold.
- Pasco County population projected at +29% by 2050 — long-run rental-demand tailwind backs the buy-and-hold thesis.
- At projected returns (-3.0% appreciation + 0.0% rent growth), your $46k cash investment doubles in ~6 years — after that, you're playing with house money.
Negotiation context
- Only 4 days on market — expect competitive offers; lowballing is unlikely to land.
- 4 sale attempts since 15y ago with the ask held roughly flat each time — persistent listings suggest the price (not the market) is what's stuck; bring a comps-based counter.
- Current owner paid $40k; list at $165k implies a 318% gain — meaningful room to come down on a strong offer.
Risks & watch-outs
- Climate carrying-cost: severe wind risk, 99% chance of damaging wind over 30y; major wildfire risk; extreme-heat days projected 7→26/yr by 2055 (HVAC capex compounding) — expect insurance premiums to compound above CPI over the hold.
Questions for the listing agent
- Is there a deadline driving the sale (1031 exchange, divorce, estate, relocation)? That informs how much negotiation room exists.
- What's the average days-on-market for RENTAL listings here right now (not sales)? A rising rental-DOM trend means longer vacancies and softer asking-rent achievability than the comps imply.
- What's the recent tenant-quality profile in this submarket — average credit score on applications, eviction rate, late-payment / NSF rate, and stable-employment percentage? A property-management company in the area should have these aggregated.
- How much new for-sale + rental construction is in the pipeline within 1–3 miles? Heavy new supply typically softens prices + rents 12–24 months out; constrained supply supports both.
Investment metrics
- 1% rule
- 1.54% ✓
- Cap rate
- 13.13%
- Cash-on-cash
- 24.43%
- DSCR
- 2.09
- GRM
- 5.4
CMA / ARV
- ARV (on-the-fly)
- $155,232
- Comps found
- 2
Show comp detail 2 sales within ~0.75 mi
| Address | Dist | Beds/Ba | Sqft | Sold | Price | $/sf | Match |
|---|---|---|---|---|---|---|---|
| 7619 Del Prado Ct | 0.20mi | 2/2.0 (-1) | 924 (0%) | 6mo | $155,000 | $168 | 81 |
| 7420 Moffitt Rd | 0.13mi | 2/2.0 (-1) | 840 (-9%) | 12mo | $140,000 | $167 | 64 |
Match score weights: distance 35% · size 25% · config 20% · recency 20%. Top-matched comps best support the ARV.
Projected returns pro-forma
-3.0% appreciation · 0.0% rent growth · sell at horizon
- IRR
- 14.4%
- Equity multiple
- 1.56×
- Total profit
- $25,725
- Equity at exit
- $24,602
- IRR
- 20.9%
- Equity multiple
- 2.53×
- Total profit
- $70,777
- Equity at exit
- $14,266
Cash invested: $46,200 (down + closing). Projections, not guarantees.
Landlord ↔ Tenant lean methodology
- Overall (STATE)
- 87 Strongly Landlord-Friendly
- State Florida
- 87 Strongly Landlord-Friendly · R+3
- County
- — inherits STATE
- City
- — inherits STATE
ZIP-level market 34638
- Home prices YoY
- -16.0%
- Rents YoY
- -3.8%
- Active inventory
- 712
- Price-to-rent
- 5.4×
Monthly cashflow live
- Estimated rent
- $2,536 medium interval (Pro) →
- Mortgage (P&I)
- −$865
- Tax from tax record
- −$129 /mo · $1,545/yr
- Insurance
- −$69
- HOA
- −$0
- Vacancy / Maint / Mgmt
- −$533
- Net cashflow
- $941
Break-even live
UW: 25.0% down · 7.5% · 30yr · 1.5% tax · 5.0% vac · 8.0% maint · 8.0% mgmt
Financing live
Cash to close
- Down payment
- $41,250
- Closing costs
- $4,950
- Reserves months
- —
- Total cash needed
- —
Loan-product check · same deal, 3 products live
Conventional
25% down · 7.5% · 30yr
- Down + closing
- —
- Monthly P&I
- —
- Monthly cashflow
- —
- DSCR
- —
- Eligible?
- —
Personal DTI + credit; lowest rate.
DSCR
20% down · 8.5% · 30yr
- Down + closing
- —
- Monthly P&I
- —
- Monthly cashflow
- —
- DSCR
- —
- Eligible?
- —
No personal income docs; deal must DSCR.
Hard money
10% down · 12.0% · 12mo
- Down + closing
- —
- Monthly P&I
- —
- Monthly cashflow
- —
- DSCR
- —
- Eligible?
- —
Short-term bridge; refi at stabilization.
Rent comps 1 comps
| Address | Beds | Baths | Sqft | Rent | $/sqft | DOM | Units | Dist |
|---|---|---|---|---|---|---|---|---|
| 20191 Sabal Palm Ct Land O' Lakes, FL | 1.0–3.0 | 1.0–2.5 | 1404 | $3,338 | $2.38 | 2d | 20 | 1.19mi |
Listing history 11 events
-
2026-05-23status Pending
-
2026-05-16$165,000 Active
-
2014-02-26soldstatus $39,500
-
2013-08-09historical
-
2013-06-24$43,950
-
2013-05-06historical
-
2012-05-10$35,000
-
2012-01-06soldstatus $18,575
-
2011-06-09$27,300
-
2004-08-04soldstatus $55,000
-
1999-08-24soldstatus $45,900
ⓘ Source: listings_history table (triggers on properties + properties_extension) + one-shot
backfill from property_details.listing_events for pre-trigger history.
Tax reassessment forecast FL · Resets to sale price
- Current annual tax
- $1,545 · $129/mo
- Projected year-2 tax
- $1,545 · $129/mo
- Expected delta
- $0/yr ($0/mo · 0.0%)
ⓘ Screening estimate from a state-policy table — verify with the county assessor before closing.
Climate risk First Street
- Flood 1/10 Low FEMA zone X (unshaded) · 0% chance over 30 yrs
- Wildfire 6/10 Major
- Heat 10/10 Extreme 7 d/yr ≥109°F today · 26 d/yr by 30 yrs out
- Wind 9/10 Extreme 99% chance of damaging wind over 30 yrs
- Air quality 2/10 Low 1 unhealthy d/yr today · 1 by 30 yrs out
Nearby sold comps map
Loading sold comps map…
Walkable amenities ~0.75 mi
Loading nearby amenities…
Taxation est. · year 1
- Rental income
- $30,429
- − Mortgage interest
- −$9,243
- − Property taxes
- −$1,545
- − Insurance
- −$825
- − Repairs & maintenance
- −$2,434
- − Management
- −$2,434
- − Depreciation
- −$4,800
- Taxable income
- $9,149
- Est. tax owed @ 24.0%
- −$2,196
- After-tax cash flow
- $9,091/yr
For passive investors: Depreciation is non-cash, so a rental often shows a tax loss while cash-flowing — sheltering income. Rental losses are passive: they offset passive income freely, and up to $25,000/yr can offset ordinary (W-2) income if you actively participate and your MAGI is under $100k (phasing out to $0 by $150k); unused losses carry forward. On sale, claimed depreciation is recaptured at up to 25%, and gains may owe capital-gains tax (a 1031 exchange can defer both). Figures are a year-1 estimate at your 24.0% rate — not tax advice; consult a CPA.
Schools (NCES district)
- District
- Pasco
- NCES district ID
- 1201530
- Math proficiency
- 50% ▼ -10.00%
- Reading proficiency
- 52% ▼ -5.00%
- Median HH income
- $45,039
- Composite
- 43.14/100
- National rank
- #3074
- State rank
- #32 of 73 in FL
Livability — Land O' Lakes
No livability data for this city. (Only ~50 U.S. cities are tracked.)
Census & demographics
- County
- Pasco County · 524,098 people
- Metro
- Tampa-St. Petersburg-Clearwater, FL
- Population (ZIP)
- 37,644
- Household income
- $123,899
- Rent vs Own
- Severe rent burden
- 354.0
Population outlook (Pasco County) Hauer SSP2
- Today (2025)
- 570,045 people
- By 2030
- 605,844 · +6.3%
- By 2040
- 674,806 · +18.4%
- By 2050
- 736,022 · +29.1%
- By 2075
- 862,900 · +51.4%
- By 2100
- 906,364 · +59.0%
Race, ethnicity, and origin ACS 2023
- Neighborhood character
- Diverse neighborhood (Simpson 0.59)
- Race & ethnicity
- White 58% Hispanic / Latino 25% Two or more races 16% Black 6% Asian 4%
- Hispanic origin (detail)
- Mexican 1% Puerto Rican 6% Cuban 4% Dominican 3%
- Common ancestry
- Lithuanian 3% Romanian 3% Slovak 2%
- Foreign-born
- 17% · Canada, Jamaica
- Languages at home
- 76% English-only · Spanish 16% Other Indo-European 2% Arabic 2%
Political lean MEDSL · Pasco
- 2024 margin
- Strong R (+25.2) · D 36.9% · R 62.1% · Other 1.0%
- 2008→2024 swing
- -21.6pp toward R · 2008: -3.6pp · 2024: -25.2pp
- All cycles
- 2024: R+25.2 2020: R+20.1 2016: R+21.6 2012: R+6.7 2008: R+3.6
Not yet ingested
- Civics
- —
Market trends
- HPI YoY
- ▼ -57.02%
- Current HPI
- 299.2018
- Rent YoY
- ▼ -3.78%
- Metro
- Tampa-St. Petersburg-Clearwater, FL
- State GDP YoY
- ▲ 3.28%
- F500 in state
- 36
Industry mix (Fortune 500 HQ in FL)
| Industry | F500 HQs | Revenue |
|---|---|---|
| Industrial Technology | 2 | $29B |
|
||
| Insurance | 2 | $17B |
|
||
| Retail | 1 | $60B |
|
||
| Technology Distribution | 1 | $58B |
|
||
| Homebuilding | 1 | $35B |
|
||
| Technology Manufacturing | 1 | $35B |
|
||
Price history
+259.5% since first listed11 events — show timeline
- 2026-05-23 Pending — HCAR
- 2026-05-16 Listed $165,000 HCAR
- 2014-02-26 Sold (Public Records) $39,500 Public Records
- 2013-08-09 Listing Removed — Stellar MLS as Distributed by MLS Grid
- 2013-06-24 Listed $43,950 Stellar MLS as Distributed by MLS Grid
- 2013-05-06 Listing Removed — Stellar MLS as Distributed by MLS Grid
- 2012-05-10 Listed $35,000 Stellar MLS as Distributed by MLS Grid
- 2012-01-06 Sold (MLS) $18,575 Stellar MLS as Distributed by MLS Grid
- 2011-06-09 Listed $27,300 Stellar MLS as Distributed by MLS Grid
- 2004-08-04 Sold (Public Records) $55,000 Public Records
- 1999-08-24 Sold (Public Records) $45,900 Public Records
Property tax history
+6.2%/yrLatest (2025): $1,545 · -0.1% YoY. Source: county tax records.
Cash-flow waterfall
monthlySold comps — $/sqft
last 12 mo · ≤1 miLoading sold comps…