 Fourplex
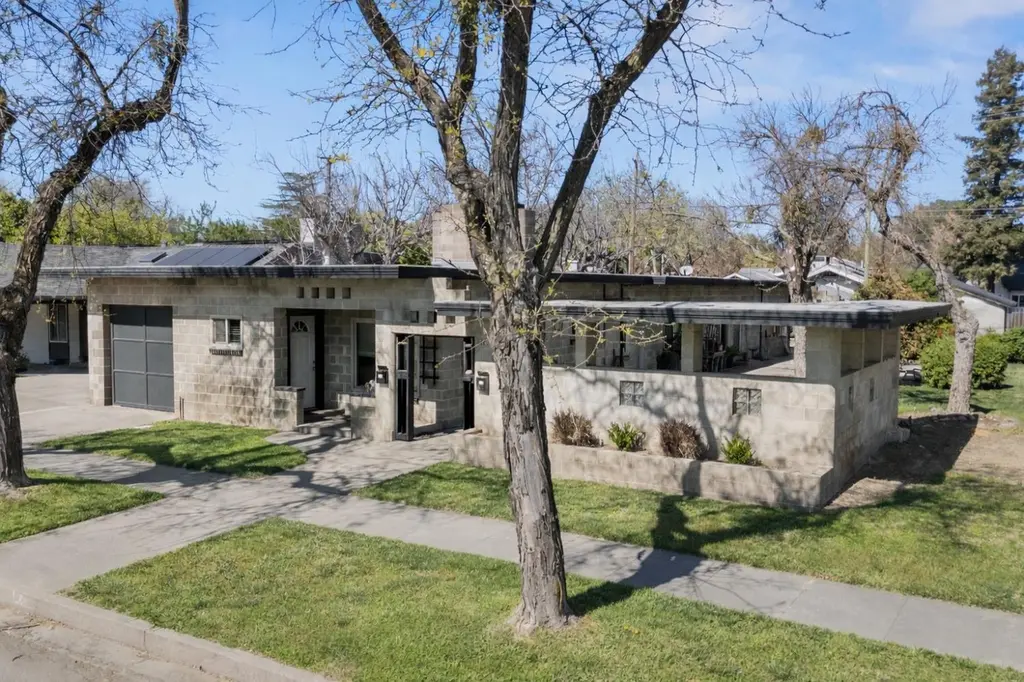
724 - 730 Webster St · Colusa, CA
Flood risk 7/10 · Major
- FEMA flood zone
- X (shaded)
- Chance of flooding over 30 yrs
- 0.77%
- Est. flood insurance / yr
- $507 – $1,088
Fire risk 5/10 · Moderate
- Est. fire insurance / yr
- $659 – $1,223
Heat risk 7/10 · Major
- Hot days now (above 104°F)
- 7 days/yr
- Hot days in 30 yrs
- 15 days/yr
Wind risk 1/10 · Minimal
- Chance of severe wind over 30 yrs
- —
Air-quality risk 10/10 · Severe
- Unhealthy air days now
- 28 days/yr
- Unhealthy air days in 30 yrs
- 30 days/yr
Risk factors via First Street. Map © Google.
Why this score? — see what drove the B- grade
The composite is a weighted blend of 9 inputs, each scored 0–100. Each bar is that input's sub-score; the figure is the points it added to the 100-point composite (weight × sub-score).
- Cash flow +28.9/30.0
- ARV discount +11.6/15.0
- DSCR +10.0/10.0
- 1% rule +7.4/10.0
- Livability +3.5/5.0
- Schools +2.7/10.0
- Rent growth +2.5/5.0
- Condition / age +2.5/5.0
- Appreciation +0.0/10.0
$385,000
🖨 Deal sheet 📄 Offer letter ✓ Due diligence
Multi-family units
County records classify this as Multi-Family (2-4 Unit). Listing-text estimate: 4 units. confirmed
Listing remarks
Charming 1950 cinderblock duplex offering character, convenience, and reliable rental income. Both units are currently rented, making this an excellent opportunity for investors. The 2-bedroom, 1-bath unit features a full kitchen, dining area, and living room with a cozy fireplace, along with new central heat and air. The second unit provides a comfortable 1-bedroom, 1-bath layout. Each residence includes an attached garage with laundry hookups, and tenants can enjoy a private courtyard area perfect for outdoor relaxation. Situated in a prime location just half a block from a park and across the street from a school, this duplex offers convenience and strong rental appeal.
Key facts
- Full kitchen
- Attached garage
- Cinderblock duplex
Tags
Neighborhood map
What this means for you Summary
Snapshot
- This is a 4 × 3-bed/1.0-bath units multifamily listed at $385k.
Deal economics
- At list price, monthly cash flow is $1k ($15k/yr) — positive. Per door: $310/mo.
- The deal already cash-flows at list — no discount required.
- Meets the 1% rule at list price ($5k rent vs $385k).
- Recommended offer: $350k (9.0% below list) — sets the bar for market timing.
- Cap rate 10.4% vs local median 1.2% in Colusa — top-decile yield for the area; either an underpriced asset or a hidden risk that comps aren't pricing in. Stress-test before assuming the spread holds.
Location & tenants
- Location reads 69/100 on livability (#263 in CA) — a middle-class / working-renter tenant base. Strengths: housing A+, health & safety A+; Watch: amenities F, commute F, cost of living F.
- Colusa Unified (town): math 22% / reading 40% proficiency, ranked #321 of 517 in CA (top 62%) — families likely to look elsewhere, expect single-tenant / working-renter base with shorter leases.
- Market conditions: 43 active listings in the ZIP; 2 comparable units currently listed for rent nearby; 57 units permitted in Colusa County in 2024 (31 in 5+ unit buildings).
Forward outlook
- Local home prices are declining (-3.0%/yr); year-one equity from $3k of loan paydown is wiped out by about $12k of value loss. Plan a longer hold.
- Colusa County population projected to shrink 6% by 2050 — rents likely to lag national; underwrite the cash flow, not the appreciation.
- At projected returns (-3.0% appreciation + 3.0% rent growth), your $108k cash investment doubles in ~9 years — after that, you're playing with house money.
Negotiation context
- It's been on market 94 days — a 9% lower offer ($350k) is reasonable based on typical stale-listing flexibility.
- Current owner paid $280k; 38% above their basis — modest negotiation headroom, anchor on the comps not their cost.
Risks & watch-outs
- Watch-outs: flood insurance adds $66/mo; built in 1950 — expect roof / HVAC / electrical / plumbing capex.
- Climate carrying-cost: major flood risk; moderate wildfire risk; extreme-heat days projected 7→15/yr by 2055 (HVAC capex compounding) — expect insurance premiums to compound above CPI over the hold.
Questions for the listing agent
- It's been on market 94 days. Have you received any prior offers? Is the seller open to a 9% concession, seller financing, or rate buy-down credit?
- Can we see the unit-by-unit rent roll, current vacancy, and any below-market leases? What's the average tenancy length?
- What capital expenditures (roof, boiler, parking lot, exteriors) have been made in the last 5 years, and what's planned in the next 2?
- Built in 1950 — when were the roof, HVAC, electrical panel, plumbing, and water heater last replaced?
- What's the actual annual flood-insurance premium (NFIP or private), and is the property in a SFHA with mandatory coverage?
- Why hasn't it sold? Are there any deal-killer items the seller is aware of (foundation, flood, title, zoning, code violations)?
- Is there a deadline driving the sale (1031 exchange, divorce, estate, relocation)? That informs how much negotiation room exists.
- What's the average days-on-market for RENTAL listings here right now (not sales)? A rising rental-DOM trend means longer vacancies and softer asking-rent achievability than the comps imply.
- What's the recent tenant-quality profile in this submarket — average credit score on applications, eviction rate, late-payment / NSF rate, and stable-employment percentage? A property-management company in the area should have these aggregated.
- How much new apartment / multifamily construction is in the pipeline within 1–3 miles? Heavy new supply (>2% of stock underway) typically softens rents 12–24 months out; light construction supports rent growth.
Investment metrics
- 1% rule
- 1.24% ✓
- Cap rate
- 10.37%
- Cash-on-cash
- 14.55%
- DSCR
- 1.65
- GRM
- 6.7
CMA / ARV
- ARV (median comp)
- $423,246
- List price
- $385,000
- Delta
- -9.04%
- Verdict
- FAIR
- Comps
- 6 within 1.0 mi
Show comp detail 1 sale within ~0.75 mi
| Address | Dist | Beds/Ba | Sqft | Sold | Price | $/sf | Match |
|---|---|---|---|---|---|---|---|
| 1120 - 1122 Oak St | 0.36mi | 3/1.0 (+1) | 1,220 (-1%) | 9mo | $265,000 | $217 | 69 |
Match score weights: distance 35% · size 25% · config 20% · recency 20%. Top-matched comps best support the ARV.
Projected returns pro-forma
-3.0% appreciation · 3.0% rent growth · sell at horizon
- IRR
- 4.0%
- Equity multiple
- 1.15×
- Total profit
- $16,594
- Equity at exit
- $57,405
- IRR
- 13.5%
- Equity multiple
- 2.08×
- Total profit
- $116,121
- Equity at exit
- $33,288
Cash invested: $107,800 (down + closing). Projections, not guarantees.
Landlord ↔ Tenant lean methodology
- Overall (STATE)
- 18 Strongly Tenant-Friendly
- State California
- 18 Strongly Tenant-Friendly · D+13
- County
- — inherits STATE
- City
- — inherits STATE
ZIP-level market 95932
- Active inventory
- 43
- Price-to-rent
- 26.9×
Monthly cashflow live
- Estimated rent
- $4,768 medium interval (Pro) →
- Mortgage (P&I)
- −$2,019
- Tax from tax record
- −$281 /mo · $3,368/yr
- Insurance
- −$160
- Flood insurance flood zone
- −$66 /mo · $798/yr
- HOA
- −$0
- Vacancy / Maint / Mgmt
- −$1,001
- Net cashflow
- $1,240
Break-even live
4-unit breakdown (identical units grouped — click to expand)
| Units | Beds | Baths | Est. rent |
|---|---|---|---|
| 4× units | 3 | 1 | $4,768 |
| #1 | 3 | 1 | $1,192 |
| #2 | 3 | 1 | $1,192 |
| #3 | 3 | 1 | $1,192 |
| #4 | 3 | 1 | $1,192 |
| Total (4 units) | $4,768 | ||
UW: 25.0% down · 7.5% · 30yr · 1.5% tax · 5.0% vac · 8.0% maint · 8.0% mgmt
Financing live
Cash to close
- Down payment
- $96,250
- Closing costs
- $11,550
- Reserves months
- —
- Total cash needed
- —
Loan-product check · same deal, 3 products live
Conventional
25% down · 7.5% · 30yr
- Down + closing
- —
- Monthly P&I
- —
- Monthly cashflow
- —
- DSCR
- —
- Eligible?
- —
Personal DTI + credit; lowest rate.
DSCR
20% down · 8.5% · 30yr
- Down + closing
- —
- Monthly P&I
- —
- Monthly cashflow
- —
- DSCR
- —
- Eligible?
- —
No personal income docs; deal must DSCR.
Hard money
10% down · 12.0% · 12mo
- Down + closing
- —
- Monthly P&I
- —
- Monthly cashflow
- —
- DSCR
- —
- Eligible?
- —
Short-term bridge; refi at stabilization.
Rent comps 2 comps
| Address | Beds | Baths | Sqft | Rent | $/sqft | DOM | Units | Dist |
|---|---|---|---|---|---|---|---|---|
| 419 14th St Colusa, CA | 3.0 | 1.0 | 960 | $1,800 | $1.88 | 13d | 1 | 0.51mi |
| 1717 State Hwy 20 Colusa, CA | 2.0–3.0 | 1.0–2.0 | 803 | $950 | $1.18 | 13d | 1 | 0.87mi |
Listing history 19 events
-
2026-06-19days on market $385,000 Active 94 DOM
-
2026-06-18days on market $385,000 Active 93 DOM
-
2026-06-17days on market $385,000 Active 92 DOM
-
2026-06-16days on market $385,000 Active 91 DOM
-
2026-06-15days on market $385,000 Active 90 DOM
-
2026-06-14days on market $385,000 Active 88 DOM
-
2026-06-12days on market $385,000 Active 87 DOM
-
2026-06-09days on market $385,000 Active 84 DOM
-
2026-06-08days on market $385,000 Active 83 DOM
-
2026-06-07days on market $385,000 Active 82 DOM
-
2026-06-07days on market $385,000 Active 81 DOM
-
2026-06-04days on market $385,000 Active 78 DOM
-
2026-06-02days on market $385,000 Active 77 DOM
-
2026-06-01days on market $385,000 Active 76 DOM
-
2026-05-31days on market $385,000 Active 75 DOM
-
2026-05-31days on market $385,000 Active 74 DOM
-
2023-08-18soldstatus $280,000
-
2020-12-21soldstatus $50,000
-
2000-08-14soldstatus $93,000
ⓘ Source: listings_history table (triggers on properties + properties_extension) + one-shot
backfill from property_details.listing_events for pre-trigger history.
Tax reassessment forecast CA · Resets to sale price
- Current annual tax
- $3,368 · $281/mo
- Projected year-2 tax
- $3,368 · $281/mo
- Expected delta
- $0/yr ($0/mo · 0.0%)
ⓘ Screening estimate from a state-policy table — verify with the county assessor before closing.
Climate risk First Street
- Flood 7/10 Severe FEMA zone X (shaded) · 77% chance over 30 yrs
- Wildfire 5/10 Major
- Heat 7/10 Severe 7 d/yr ≥104°F today · 15 d/yr by 30 yrs out
- Wind 1/10 Low
- Air quality 10/10 Extreme 28 unhealthy d/yr today · 30 by 30 yrs out
Nearby sold comps map
Loading sold comps map…
Walkable amenities ~0.75 mi
Loading nearby amenities…
Taxation est. · year 1
- Rental income
- $57,216
- − Mortgage interest
- −$21,566
- − Property taxes
- −$3,368
- − Insurance
- −$2,722
- − Repairs & maintenance
- −$4,577
- − Management
- −$4,577
- − Depreciation
- −$11,200
- Taxable income
- $9,205
- Est. tax owed @ 24.0%
- −$2,209
- After-tax cash flow
- $12,674/yr
For passive investors: Depreciation is non-cash, so a rental often shows a tax loss while cash-flowing — sheltering income. Rental losses are passive: they offset passive income freely, and up to $25,000/yr can offset ordinary (W-2) income if you actively participate and your MAGI is under $100k (phasing out to $0 by $150k); unused losses carry forward. On sale, claimed depreciation is recaptured at up to 25%, and gains may owe capital-gains tax (a 1031 exchange can defer both). Figures are a year-1 estimate at your 24.0% rate — not tax advice; consult a CPA.
Schools (NCES district)
- District
- Colusa Unified
- NCES district ID
- 0609570
- Math proficiency
- 22% ▼ -11.00%
- Reading proficiency
- 40% ▼ -5.00%
- Median HH income
- $49,803
- Composite
- 26.94/100
- National rank
- #7080
- State rank
- #321 of 517 in CA
Livability — Colusa
- Score
- 69/100
- State rank
- #263
- US rank
- #8719
Category grades
Schools grade is shown separately in the Schools card above.
Census & demographics
- Census place
- Colusa, CA
- Population (ZIP)
- 7,672
Population outlook (Colusa County) Hauer SSP2
- Today (2025)
- 21,153 people
- By 2030
- 20,974 · -0.8%
- By 2040
- 20,559 · -2.8%
- By 2050
- 19,830 · -6.3%
- By 2075
- 17,194 · -18.7%
- By 2100
- 13,264 · -37.3%
Race, ethnicity, and origin ACS 2023
- Neighborhood character
- Diverse neighborhood (Simpson 0.58)
- Race & ethnicity
- Hispanic / Latino 52% White 39% Two or more races 18% Black 3% Native American 3% Asian 1%
- Hispanic origin (detail)
- Mexican 50%
- Common ancestry
- Russian 2% Lithuanian 2% Slovak 1%
- Foreign-born
- 23% · Canada
- Languages at home
- 56% English-only · Spanish 42% Other Indo-European 1%
Political lean MEDSL · Colusa
- 2024 margin
- Strong R (+28.2) · D 34.6% · R 62.9% · Other 2.5%
- 2008→2024 swing
- -10.1pp toward R · 2008: -18.1pp · 2024: -28.2pp
- All cycles
- 2024: R+28.2 2020: R+16.6 2016: R+13.5 2012: R+21.7 2008: R+18.1
Not yet ingested
- Civics
- —
Market trends
- HPI YoY
- ▼ -154.03%
- Current HPI
- 172.0023
- Rent YoY
- —
- Metro
- —
- State GDP YoY
- ▲ 3.21%
- F500 in state
- 116
Industry mix (Fortune 500 HQ in CA)
| Industry | F500 HQs | Revenue |
|---|---|---|
| Technology | 27 | $1,492B |
|
||
| Financial Services | 3 | $174B |
|
||
| Retail | 3 | $44B |
|
||
| Insurance | 3 | $26B |
|
||
| Media / Entertainment | 2 | $115B |
|
||
| Pharmaceuticals / Biotech | 2 | $62B |
|
||
Price history
+201.1% since first listed3 events — show timeline
- 2023-08-18 Sold (Public Records) $280,000 Public Records
- 2020-12-21 Sold (Public Records) $50,000 Public Records
- 2000-08-14 Sold (Public Records) $93,000 Public Records
Property tax history
+8.8%/yrLatest (2025): $3,368 · +6.1% YoY. Source: county tax records.
Cash-flow waterfall
monthlySold comps — $/sqft
last 12 mo · ≤1 miLoading sold comps…