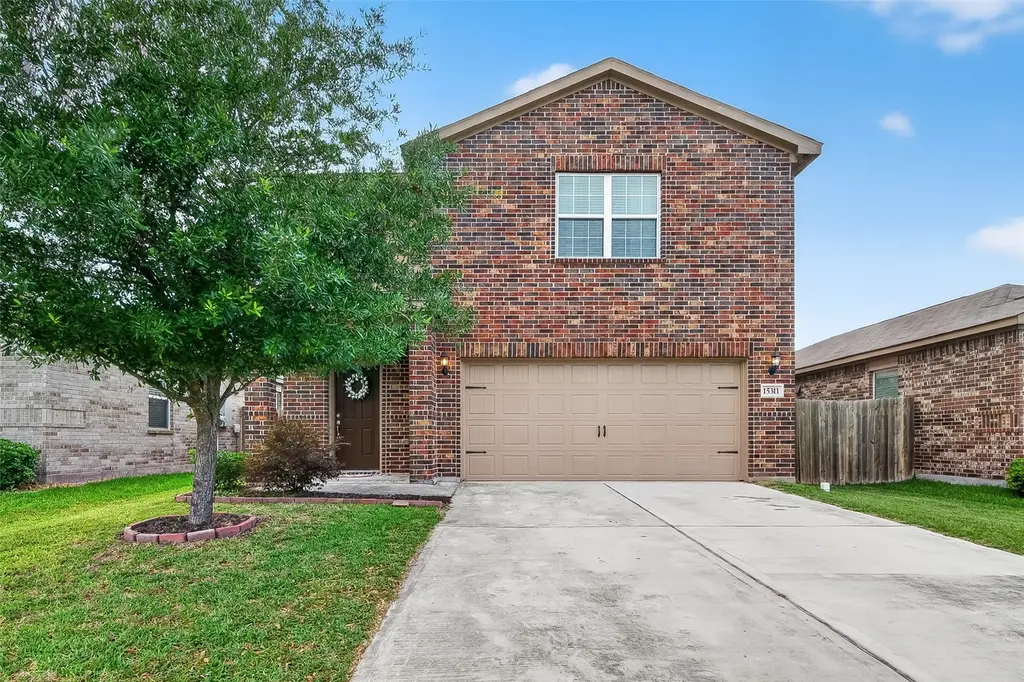
15311 Crescent Brookfield Dr · Atascocita, TX
Flood risk 1/10 · Minimal
- FEMA flood zone
- X (unshaded)
- Chance of flooding over 30 yrs
- 0.0%
- Est. flood insurance / yr
- $507 – $1,088
Fire risk 4/10 · Minor
- Est. fire insurance / yr
- $1,222 – $2,270
Heat risk 9/10 · Severe
- Hot days now (above 110°F)
- 7 days/yr
- Hot days in 30 yrs
- 24 days/yr
Wind risk 9/10 · Severe
- Chance of severe wind over 30 yrs
- 99.0%
Air-quality risk 3/10 · Minor
- Unhealthy air days now
- 2 days/yr
- Unhealthy air days in 30 yrs
- 3 days/yr
Risk factors via First Street. Map © Google.
Why this score? — see what drove the D- grade
The composite is a weighted blend of 9 inputs, each scored 0–100. Each bar is that input's sub-score; the figure is the points it added to the 100-point composite (weight × sub-score).
- ARV discount +15.0/15.0
- Cash flow +6.6/30.0
- 1% rule +4.7/10.0
- Schools +3.9/10.0
- Livability +3.5/5.0
- Condition / age +2.5/5.0
- Rent growth +1.8/5.0
- DSCR +0.9/10.0
- Appreciation +0.0/10.0
$239,900
🖨 Deal sheet 📄 Offer letter ✓ Due diligence
Listing remarks MLS
The Rayburn by LGI Homes features a thoughtful design and over 2,100 square feet of space in a beautiful, two-story package. This 3-bedroom, 2.5-bathroom home is show-stopper with its soaring formal entryway, oversized bedrooms with walk-in closets, and game room upstairs. A breakfast bar overlooking the large living room provides additional space for dining and entertaining. This home includes over $10,000 worth of upgrades, such as granite countertops, wood cabinets and a fenced backyard. From Beltway 8, exit John Ralston and head North on John Ralston to Thompson Bend. Turn into Reserve at Park Lakes on Thompson Bend. LGI Homes Information Center located at corner of Thompson Bend and Central Lakes Drive.
Key facts
- 4,948 sq ft lot
- 2 garage spots
- Built 2020
Property features AI
Finance
- Other: Builder: LGI
- HOA & community: Homeowners association managed by Principal Mgmt Group of Houston; Annual association fee of $386
Exterior
- Parking: Attached garage with 2 parking spaces
- Utilities: Public water; Public sewer
- Home design: Residential property; Entry foundation: slab
- Construction: Built in 2020; Brick and wood siding construction; Composition roof
- Exterior features: Subdivision lot
Interior
- Bedrooms: Primary bedroom on second level (approx. 14 x 12); Second bedroom on second level (approx. 12 x 12); Third bedroom on second level (approx. 10 x 10)
- Bathrooms: 2 full bathrooms; 1 half bathroom
- Heating & cooling: Central gas heating; Central electric air conditioning
- Interior features: 3 total rooms; Seller disclosure available
Neighborhood map
What this means for you Summary
Snapshot
- This is a 3-bed/2.5-bath single-family listed at $240k.
Deal economics
- At list price, monthly cash flow is $-390 ($-5k/yr) — negative.
- To cash-flow at today's rent, offer at most $201k (16.4% below list).
- To meet the 1% rule (rent ≥ 1% of price), the offer needs to be $232k (3.1% below list).
- Recommended offer: $201k (16.4% below list) — sets the bar for cash-flow.
Location & tenants
- Location reads 70/100 on livability (#346 in TX) — a middle-class / working-renter tenant base. Strengths: employment A+, cost of living A+, housing A+; Watch: amenities F, commute F, health & safety F.
- Humble ISD (urban): math 38% / reading 44% proficiency, ranked #262 of 826 in TX (top 32%) — families likely to look elsewhere, expect single-tenant / working-renter base with shorter leases.
- Zoned schools: Autumn Creek El (817 students, 63% FRL); Autumn Ridge Middle (1,039 students, 71% FRL); Summer Creek H S (math 33% / reading 48%, grade F, #798 of 1,632 statewide, top 49%, 3,600 students, 45% FRL) — zoned schools average 60% FRL vs 32% district-wide (28 pts higher); higher-poverty schools than district average — tighter screening recommended.
- Market conditions: Rents soft (-2.9%/yr); 255 active listings in the ZIP; 2 comparable units currently listed for rent nearby; solid renter incomes; 29,883 units permitted in Harris County in 2024 (8,621 in 5+ unit buildings).
- This rent runs 36% of the median local income ($78k/yr) — at the standard rent-burdened threshold; future hikes will face affordability resistance.
Forward outlook
- Local home prices are declining (-3.0%/yr); year-one equity from $2k of loan paydown is wiped out by about $7k of value loss. Plan a longer hold.
- Harris County population projected at +47% by 2050 — long-run rental-demand tailwind backs the buy-and-hold thesis.
Negotiation context
- Only 4 days on market — expect competitive offers; lowballing is unlikely to land.
- 3 sale attempts since 6y ago with the ask held roughly flat each time — persistent listings suggest the price (not the market) is what's stuck; bring a comps-based counter.
Risks & watch-outs
- Watch-outs: property tax is 4.2% of price.
- Climate carrying-cost: severe wind risk, 99% chance of damaging wind over 30y; extreme-heat days projected 7→24/yr by 2055 (HVAC capex compounding) — expect insurance premiums to compound above CPI over the hold.
Questions for the listing agent
- What do current leases actually rent for vs. the listed asking? Can we see a recent rent roll and the last 12 months of T-12 income?
- Property tax is high relative to price — has the assessment been appealed recently, and will the sale trigger a re-assessment?
- What does the HOA fee cover, when was the last increase, and are there any pending special assessments or reserve-fund shortfalls?
- Is there a deadline driving the sale (1031 exchange, divorce, estate, relocation)? That informs how much negotiation room exists.
- The area grade is low — what's the realistic commute time and amenity access for the typical tenant pool here? Any planned neighborhood developments (good or bad) we should know about?
- What's the average days-on-market for RENTAL listings here right now (not sales)? A rising rental-DOM trend means longer vacancies and softer asking-rent achievability than the comps imply.
- What's the recent tenant-quality profile in this submarket — average credit score on applications, eviction rate, late-payment / NSF rate, and stable-employment percentage? A property-management company in the area should have these aggregated.
- How much new for-sale + rental construction is in the pipeline within 1–3 miles? Heavy new supply typically softens prices + rents 12–24 months out; constrained supply supports both.
Investment metrics
- 1% rule
- 0.97% ✗
- Cap rate
- 4.34%
- Cash-on-cash
- -6.97%
- DSCR
- 0.69
- GRM
- 8.6
CMA / ARV
- ARV (median comp)
- $360,791
- List price
- $239,900
- Delta
- -33.51%
- Verdict
- UNDERPRICED
- Comps
- 20 within 1.0 mi
Show comp detail 6 sales within ~0.75 mi
| Address | Dist | Beds/Ba | Sqft | Sold | Price | $/sf | Match |
|---|---|---|---|---|---|---|---|
| 15422 Arrowhead Ridge Dr | 0.22mi | 4/3.5 (+1) | 3,242 (-4%) | 0mo | $440,000 | $136 | 75 |
| 15407 Arrowhead Ridge Dr | 0.17mi | 4/3.5 (+1) | 3,389 (+1%) | 16mo | $399,900 | $118 | 68 |
| 15427 Timber Plateau Dr | 0.28mi | 4/3.5 (+1) | 3,253 (-3%) | 11mo | $445,000 | $137 | 64 |
| 15426 Mirror Creek Dr | 0.26mi | 4/2.5 (+1) | 3,048 (-9%) | 16mo | $325,000 | $107 | 54 |
| 12023 Allington Cove Ln | 0.73mi | 4/3.5 (+1) | 3,471 (+3%) | 3mo | $474,900 | $137 | 49 |
| 15407 Trumball Manor Dr | 0.64mi | 4/3.0 (+1) | 3,040 (-10%) | 12mo | $550,000 | $181 | 37 |
Match score weights: distance 35% · size 25% · config 20% · recency 20%. Top-matched comps best support the ARV.
Projected returns pro-forma
-3.0% appreciation · 0.0% rent growth · sell at horizon
- IRR
- -33.1%
- Equity multiple
- -0.04×
- Total profit
- $-70,140
- Equity at exit
- $35,770
- IRR
- -73.5%
- Equity multiple
- -0.75×
- Total profit
- $-117,821
- Equity at exit
- $20,742
Cash invested: $67,172 (down + closing). Projections, not guarantees.
Landlord ↔ Tenant lean methodology
- Overall (STATE)
- 87 Strongly Landlord-Friendly
- State Texas
- 87 Strongly Landlord-Friendly · R+5
- County
- — inherits STATE
- City
- — inherits STATE
ZIP-level market 77396
- Home prices YoY
- -22.5%
- Rents YoY
- -2.9%
- Active inventory
- 255
- Price-to-rent
- 8.6×
Monthly cashflow live
- Estimated rent
- $2,324 medium interval (Pro) →
- Mortgage (P&I)
- −$1,258
- Tax from tax record
- −$836 /mo · $10,030/yr
- Insurance
- −$100
- HOA
- −$32
- Vacancy / Maint / Mgmt
- −$488
- Net cashflow
- $-390
Break-even live
UW: 25.0% down · 7.5% · 30yr · 1.5% tax · 5.0% vac · 8.0% maint · 8.0% mgmt
Financing live
Cash to close
- Down payment
- $59,975
- Closing costs
- $7,197
- Reserves months
- —
- Total cash needed
- —
Loan-product check · same deal, 3 products live
Conventional
25% down · 7.5% · 30yr
- Down + closing
- —
- Monthly P&I
- —
- Monthly cashflow
- —
- DSCR
- —
- Eligible?
- —
Personal DTI + credit; lowest rate.
DSCR
20% down · 8.5% · 30yr
- Down + closing
- —
- Monthly P&I
- —
- Monthly cashflow
- —
- DSCR
- —
- Eligible?
- —
No personal income docs; deal must DSCR.
Hard money
10% down · 12.0% · 12mo
- Down + closing
- —
- Monthly P&I
- —
- Monthly cashflow
- —
- DSCR
- —
- Eligible?
- —
Short-term bridge; refi at stabilization.
Rent comps 2 comps
| Address | Beds | Baths | Sqft | Rent | $/sqft | DOM | Units | Dist |
|---|---|---|---|---|---|---|---|---|
| 11347 Needlerock Ct Unit 1310533P Humble, TX | 4.0 | 3.0 | 3239 | $9,388 | $2.90 | 43d | 1 | 0.30mi |
| 10638 Harbor Canyon Dr Humble, TX | 4.0 | 3.0 | 2355 | $2,181 | $0.93 | 43d | 1 | 0.62mi |
HOA detail
- Monthly dues
- $32 · $384/yr
Listing history 12 events
-
2026-05-18status Pending 851-char remark
-
2026-05-14$239,900 Active 851-char remark
-
2026-05-06historical
-
2026-04-29price $257,500
-
2026-04-24price $262,500
-
2026-04-21price $263,500
-
2026-04-17status Active
-
2026-04-16historical
-
2026-04-16historical
-
2020-05-28soldstatus Sold
Show marketing remark (721 chars)
The Rayburn by LGI Homes features a thoughtful design and over 2,100 square feet of space in a beautiful, two-story package. This 3-bedroom, 2.5-bathroom home is show-stopper with its soaring formal entryway, oversized bedrooms with walk-in closets, and game room upstairs. A breakfast bar overlooking the large living room provides additional space for dining and entertaining. This home includes over $10,000 worth of upgrades, such as granite countertops, wood cabinets and a fenced backyard. From Beltway 8, exit John Ralston and head North on John Ralston to Thompson Bend. Turn into Reserve at Park Lakes on Thompson Bend. LGI Homes Information Center located at corner of Thompson Bend and Central Lakes Drive.
-
2020-04-23status Pending
Show marketing remark (721 chars)
The Rayburn by LGI Homes features a thoughtful design and over 2,100 square feet of space in a beautiful, two-story package. This 3-bedroom, 2.5-bathroom home is show-stopper with its soaring formal entryway, oversized bedrooms with walk-in closets, and game room upstairs. A breakfast bar overlooking the large living room provides additional space for dining and entertaining. This home includes over $10,000 worth of upgrades, such as granite countertops, wood cabinets and a fenced backyard. From Beltway 8, exit John Ralston and head North on John Ralston to Thompson Bend. Turn into Reserve at Park Lakes on Thompson Bend. LGI Homes Information Center located at corner of Thompson Bend and Central Lakes Drive.
-
2020-02-21$218,900 Active
Show marketing remark (721 chars)
The Rayburn by LGI Homes features a thoughtful design and over 2,100 square feet of space in a beautiful, two-story package. This 3-bedroom, 2.5-bathroom home is show-stopper with its soaring formal entryway, oversized bedrooms with walk-in closets, and game room upstairs. A breakfast bar overlooking the large living room provides additional space for dining and entertaining. This home includes over $10,000 worth of upgrades, such as granite countertops, wood cabinets and a fenced backyard. From Beltway 8, exit John Ralston and head North on John Ralston to Thompson Bend. Turn into Reserve at Park Lakes on Thompson Bend. LGI Homes Information Center located at corner of Thompson Bend and Central Lakes Drive.
ⓘ Source: listings_history table (triggers on properties + properties_extension) + one-shot
backfill from property_details.listing_events for pre-trigger history.
Tax reassessment forecast TX · Resets to sale price
- Current annual tax
- $10,030 · $836/mo
- Projected year-2 tax
- $10,030 · $836/mo
- Expected delta
- $0/yr ($0/mo · 0.0%)
ⓘ Screening estimate from a state-policy table — verify with the county assessor before closing.
Climate risk First Street
- Flood 1/10 Low FEMA zone X (unshaded) · 0% chance over 30 yrs
- Wildfire 4/10 Moderate
- Heat 9/10 Extreme 7 d/yr ≥110°F today · 24 d/yr by 30 yrs out
- Wind 9/10 Extreme 99% chance of damaging wind over 30 yrs
- Air quality 3/10 Moderate 2 unhealthy d/yr today · 3 by 30 yrs out
Nearby sold comps map
Loading sold comps map…
Walkable amenities ~0.75 mi
Loading nearby amenities…
Taxation est. · year 1
- Rental income
- $27,886
- − Mortgage interest
- −$13,438
- − Property taxes
- −$10,030
- − Insurance
- −$1,200
- − Repairs & maintenance
- −$2,231
- − Management
- −$2,231
- − HOA
- −$384
- − Depreciation
- −$6,979
- Taxable loss
- −$8,606
- Est. tax savings @ 24.0%
- +$2,065
- After-tax cash flow
- $-2,615/yr
For passive investors: Depreciation is non-cash, so a rental often shows a tax loss while cash-flowing — sheltering income. Rental losses are passive: they offset passive income freely, and up to $25,000/yr can offset ordinary (W-2) income if you actively participate and your MAGI is under $100k (phasing out to $0 by $150k); unused losses carry forward. On sale, claimed depreciation is recaptured at up to 25%, and gains may owe capital-gains tax (a 1031 exchange can defer both). Figures are a year-1 estimate at your 24.0% rate — not tax advice; consult a CPA.
Schools (NCES district)
- District
- Humble ISD
- NCES district ID
- 4823910
- Math proficiency
- 38% ▼ -11.00%
- Reading proficiency
- 44% ▼ -7.00%
- Median HH income
- $83,946
- Composite
- 38.55/100
- National rank
- #4171
- State rank
- #262 of 826 in TX
Livability — Atascocita
- Score
- 70/100
- State rank
- #346
- US rank
- #7586
Category grades
Schools grade is shown separately in the Schools card above.
Census & demographics
- Census place
- Atascocita, TX
- County
- Harris County · 4,702,590 people
- City population
- 79,538
- Metro
- Houston-The Woodlands-Sugar Land, TX
- Population (ZIP)
- 61,735
- Household income
- $78,169
- Rent vs Own
- Severe rent burden
- 1655.0
Population outlook (Harris County) Hauer SSP2
- Today (2025)
- 5,571,493 people
- By 2030
- 6,089,821 · +9.3%
- By 2040
- 7,142,806 · +28.2%
- By 2050
- 8,185,864 · +46.9%
- By 2075
- 10,574,329 · +89.8%
- By 2100
- 12,109,958 · +117.4%
Race, ethnicity, and origin ACS 2023
- Neighborhood character
- Diverse neighborhood (Simpson 0.67)
- Race & ethnicity
- Hispanic / Latino 46% Black 29% Two or more races 19% White 19% Asian 4%
- Hispanic origin (detail)
- Mexican 36%
- Common ancestry
- Lithuanian 1% Slovak 1% Romanian 1%
- Foreign-born
- 18% · Canada, Vietnam, Jamaica
- Languages at home
- 58% English-only · Spanish 37% Other Indo-European 1% Vietnamese 1%
Political lean MEDSL · Harris
- 2024 margin
- Lean D (+5.5) · D 52.0% · R 46.4% · Other 1.6%
- 2008→2024 swing
- +3.9pp toward D · 2008: 1.6pp · 2024: 5.5pp
- All cycles
- 2024: D+5.5 2020: D+13.3 2016: D+12.4 2012: D+0.1 2008: D+1.6
Not yet ingested
- Civics
- —
Market trends
- HPI YoY
- ▼ -70.66%
- Current HPI
- 243.7012
- Rent YoY
- ▼ -2.92%
- Metro
- Houston-The Woodlands-Sugar Land, TX
- State GDP YoY
- ▲ 3.95%
- F500 in state
- 110
Industry mix (Fortune 500 HQ in TX)
| Industry | F500 HQs | Revenue |
|---|---|---|
| Energy | 16 | $1,198B |
|
||
| Technology | 5 | $198B |
|
||
| Engineering / Construction | 4 | $72B |
|
||
| Energy Services | 3 | $60B |
|
||
| Utilities | 3 | $41B |
|
||
| Healthcare | 2 | $330B |
|
||
Price history
+9.6% since first listed12 events — show timeline
- 2026-05-18 Pending — HARMLS
- 2026-05-14 Listed $239,900 HARMLS
- 2026-05-06 Listing Removed — HARMLS
- 2026-04-29 Price Changed $257,500 HARMLS
- 2026-04-24 Price Changed $262,500 HARMLS
- 2026-04-21 Price Changed $263,500 HARMLS
- 2026-04-17 Relisted — HARMLS
- 2026-04-16 Listing Removed — HARMLS
- 2026-04-16 Coming Soon — HARMLS
- 2020-05-28 Sold (MLS) — HARMLS
- 2020-04-23 Pending — HARMLS
- 2020-02-21 Listed $218,900 HARMLS
Property tax history
+42.9%/yrLatest (2025): $10,030 · -2.9% YoY. Source: county tax records.
Cash-flow waterfall
monthlySold comps — $/sqft
last 12 mo · ≤1 miLoading sold comps…