15 Dune Way · Fire Island, NY
Flood risk 10/10 · Severe
- FEMA flood zone
- AE
- Chance of flooding over 30 yrs
- 0.99%
- Est. flood insurance / yr
- $2,026 – $9,024
Fire risk 3/10 · Minor
- Est. fire insurance / yr
- $691 – $1,283
Heat risk 4/10 · Minor
- Hot days now (above 92°F)
- 7 days/yr
- Hot days in 30 yrs
- 17 days/yr
Wind risk 8/10 · Major
- Chance of severe wind over 30 yrs
- 80.0%
Air-quality risk 5/10 · Moderate
- Unhealthy air days now
- 9 days/yr
- Unhealthy air days in 30 yrs
- 9 days/yr
Risk factors via First Street. Map © Google.
Why this score? — see what drove the D+ grade
The composite is a weighted blend of 9 inputs, each scored 0–100. Each bar is that input's sub-score; the figure is the points it added to the 100-point composite (weight × sub-score).
- ARV discount +15.0/15.0
- Appreciation +10.0/10.0
- Schools +7.2/10.0
- Cash flow +5.8/30.0
- Livability +3.2/5.0
- Rent growth +2.5/5.0
- Condition / age +2.5/5.0
- 1% rule +0.5/10.0
- DSCR +0.2/10.0
$1,649,000
🖨 Deal sheet 📄 Offer letter ✓ Due diligence
Listing remarks MLS
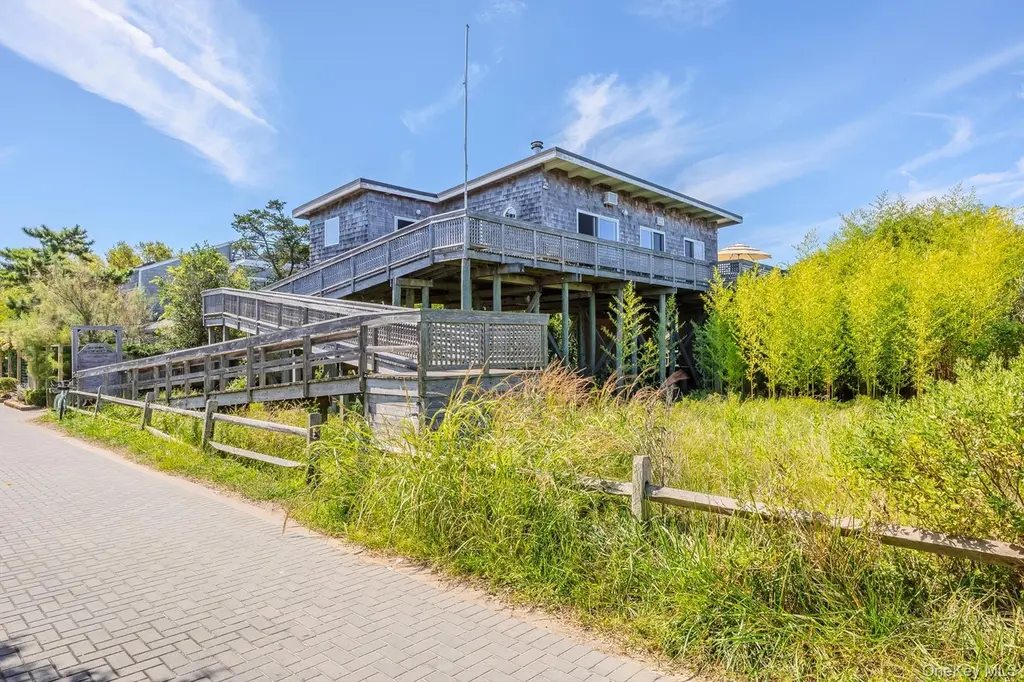
Welcome to “The Tree House” in Seaview – a unique coastal retreat elevated on stilts, offering beautiful bay views and an unbeatable location. This 4-bedroom, 2-bathroom home perfectly blends charm, comfort, and versatility, making it ideal for both relaxing getaways and entertaining. Step inside to find light-filled living spaces with an open flow, designed to take advantage of the water views and breezes. The elevated design creates a serene, treehouse-like atmosphere, offering both privacy and scenic outlooks. The property also includes a detached cottage with a half bath and pull-out sofa, providing endless possibilities—whether you envision a guest suite, private office, additional bedroom, or extra living area. This property provides 4 bedrooms, 2 full baths, and a versatile cottage with half bath—an excellent opportunity to own a spacious, well-located home in Seaview.
Key facts
- Coastal retreat
- Detached cottage
- Bay views
Tags
Neighborhood map
What this means for you Summary
Snapshot
- This is a 5-bed/2.5-bath other listed at $1.65M.
Deal economics
- At list price, monthly cash flow is $-4k ($-45k/yr) — negative.
- To cash-flow at today's rent, offer at most $991k (39.9% below list).
- To meet the 1% rule (rent ≥ 1% of price), the offer needs to be $914k (44.6% below list).
- Recommended offer: $914k (44.6% below list) — sets the bar for 1% rule.
- Cap rate 3.9% vs local median 0.7% in Fire Island — top-decile yield for the area; either an underpriced asset or a hidden risk that comps aren't pricing in. Stress-test before assuming the spread holds.
Location & tenants
- Location reads 63/100 on livability (#812 in NY) — a middle-class / working-renter tenant base. Strengths: employment A+, crime B+, housing B+; Watch: schools F, amenities F, commute F.
- Fire Island Union Free School District (suburban): math 75% / reading 90% proficiency, ranked #44 of 590 in NY (top 8%) — strong family-tenant draw, lease renewals of 3-5y typical; only 14% free/reduced lunch — higher-income household profile.
- Market conditions: 34 active listings in the ZIP; 8 comparable units currently listed for rent nearby; rentals lingering (median 44d on market — plan ~5-8 weeks vacancy on turnover, expect pricing pressure); 50% of comp listings sitting > 30 days — soft ceiling on asking rent; 1,366 units permitted in Suffolk County in 2024 (216 in 5+ unit buildings).
Forward outlook
- In year one you build about $176k of equity ($11k loan paydown + $165k appreciation (10.0% local appreciation)).
- Suffolk County population projected to shrink 5% by 2050 — rents likely to lag national; underwrite the cash flow, not the appreciation.
- By year 2, paydown + projected appreciation supports a ~$283k cash-out refi (75% LTV) — recoverable capital for the next deal without selling this one.
Negotiation context
- It's been on market 68 days — a 6% lower offer ($1.55M) is reasonable based on typical stale-listing flexibility.
- 2 sale attempts with the ask held roughly flat each time — persistent listings suggest the price (not the market) is what's stuck; bring a comps-based counter.
- Current owner paid $999k; list at $1.65M implies a 65% gain — meaningful room to come down on a strong offer.
Risks & watch-outs
- Watch-outs: flood insurance adds $460/mo.
- Climate carrying-cost: in FEMA flood zone AE (mandatory federal flood insurance); severe wind risk, 80% chance of damaging wind over 30y — expect insurance premiums to compound above CPI over the hold.
Questions for the listing agent
- What do current leases actually rent for vs. the listed asking? Can we see a recent rent roll and the last 12 months of T-12 income?
- It's been on market 68 days. Have you received any prior offers? Is the seller open to a 45% concession, seller financing, or rate buy-down credit?
- Built in 1971 — when were the roof, HVAC, electrical panel, plumbing, and water heater last replaced?
- What's the actual annual flood-insurance premium (NFIP or private), and is the property in a SFHA with mandatory coverage?
- What does the HOA fee cover, when was the last increase, and are there any pending special assessments or reserve-fund shortfalls?
- Why hasn't it sold? Are there any deal-killer items the seller is aware of (foundation, flood, title, zoning, code violations)?
- Is there a deadline driving the sale (1031 exchange, divorce, estate, relocation)? That informs how much negotiation room exists.
- Schools are F-rated, which usually means shorter tenancies and higher turnover. Who's the typical renter profile here, and what's been the actual vacancy rate?
- The area grade is low — what's the realistic commute time and amenity access for the typical tenant pool here? Any planned neighborhood developments (good or bad) we should know about?
- What's the average days-on-market for RENTAL listings here right now (not sales)? A rising rental-DOM trend means longer vacancies and softer asking-rent achievability than the comps imply.
- What's the recent tenant-quality profile in this submarket — average credit score on applications, eviction rate, late-payment / NSF rate, and stable-employment percentage? A property-management company in the area should have these aggregated.
- How much new for-sale + rental construction is in the pipeline within 1–3 miles? Heavy new supply typically softens prices + rents 12–24 months out; constrained supply supports both.
Investment metrics
- 1% rule
- 0.55% ✗
- Cap rate
- 3.92%
- Cash-on-cash
- -8.48%
- DSCR
- 0.62
- GRM
- 15.0
CMA / ARV
- ARV (median comp)
- $2,162,210
- List price
- $1,649,000
- Delta
- -23.74%
- Verdict
- UNDERPRICED
- Comps
- 13 within 1.0 mi
Projected returns pro-forma
10.0% appreciation · 3.0% rent growth · sell at horizon
- IRR
- 17.5%
- Equity multiple
- 2.43×
- Total profit
- $660,818
- Equity at exit
- $1,485,550
- IRR
- 16.5%
- Equity multiple
- 5.62×
- Total profit
- $2,132,202
- Equity at exit
- $3,203,644
Cash invested: $461,720 (down + closing). Projections, not guarantees.
Landlord ↔ Tenant lean methodology
- Overall (STATE)
- 15 Strongly Tenant-Friendly
- State New York
- 15 Strongly Tenant-Friendly · D+10
- County
- — inherits STATE
- City
- — inherits STATE
ZIP-level market 11770
- Home prices YoY
- 13.7%
- Active inventory
- 34
- Price-to-rent
- 15.0×
Monthly cashflow live
- Estimated rent
- $9,141 high interval (Pro) →
- Mortgage (P&I)
- −$8,648
- Tax from tax record
- −$639 /mo · $7,663/yr
- Insurance
- −$687
- Flood insurance flood zone
- −$460 /mo · $5,525/yr
- HOA
- −$511
- Vacancy / Maint / Mgmt
- −$1,920
- Net cashflow
- $-3,723
Break-even live
UW: 25.0% down · 7.5% · 30yr · 1.5% tax · 5.0% vac · 8.0% maint · 8.0% mgmt
Financing live
Cash to close
- Down payment
- $412,250
- Closing costs
- $49,470
- Reserves months
- —
- Total cash needed
- —
Loan-product check · same deal, 3 products live
Conventional
25% down · 7.5% · 30yr
- Down + closing
- —
- Monthly P&I
- —
- Monthly cashflow
- —
- DSCR
- —
- Eligible?
- —
Personal DTI + credit; lowest rate.
DSCR
20% down · 8.5% · 30yr
- Down + closing
- —
- Monthly P&I
- —
- Monthly cashflow
- —
- DSCR
- —
- Eligible?
- —
No personal income docs; deal must DSCR.
Hard money
10% down · 12.0% · 12mo
- Down + closing
- —
- Monthly P&I
- —
- Monthly cashflow
- —
- DSCR
- —
- Eligible?
- —
Short-term bridge; refi at stabilization.
Rent comps 8 comps
| Address | Beds | Baths | Sqft | Rent | $/sqft | DOM | Units | Dist |
|---|---|---|---|---|---|---|---|---|
| 43 Crescent Ave Ocean Beach, NY | 4.0 | 2.5 | 1400 | $8,500 | $6.07 | 15d | 1 | 0.18mi |
| 437 Dehnhoff Walk Ocean Beach, NY | 4.0 | 2.0 | 1496 | $6,000 | $4.01 | 43d | 1 | 0.31mi |
| 55 Ocean Rd Ocean Beach, NY | 5.0 | 3.0 | 1577 | $7,500 | $4.76 | 18d | 1 | 0.42mi |
| 112 Ocean Rd Ocean Beach, NY | 4.0 | 2.0 | 1560 | $13,000 | $8.33 | 43d | 1 | 0.44mi |
| 290 Wilmot Rd Ocean Beach, NY | 5.0 | 2.0 | 1800 | $12,500 | $6.94 | 16d | 1 | 0.47mi |
| 294 Wilmot Rd Ocean Beach, NY | 5.0 | 2.5 | 1852 | $12,500 | $6.75 | 18d | 1 | 0.47mi |
| 150 Clipper Roadway Ocean Beach, NY | 6.0 | 2.5 | 1674 | $8,000 | $4.78 | 43d | 1 | 0.59mi |
| 54 Thompson Ave Ocean Beach, NY | 5.0 | 2.0 | 1680 | $8,500 | $5.06 | 43d | 1 | 0.64mi |
HOA detail
- Monthly dues
- $511 · $6,132/yr
- Likely covers
- water
Listing history 20 events
-
2026-06-18days on market $1,649,000 Active 68 DOM
-
2026-06-17days on market $1,649,000 Active 67 DOM
-
2026-06-16days on market $1,649,000 Active 66 DOM
-
2026-06-15days on market $1,649,000 Active 65 DOM
-
2026-06-13days on market $1,649,000 Active 63 DOM
-
2026-06-13days on market $1,649,000 Active 62 DOM
-
2026-06-09days on market $1,649,000 Active 59 DOM
-
2026-06-08days on market $1,649,000 Active 58 DOM
-
2026-06-07days on market $1,649,000 Active 57 DOM
-
2026-06-04days on market $1,649,000 Active 54 DOM
-
2026-06-03days on market $1,649,000 Active 53 DOM
-
2026-06-02days on market $1,649,000 Active 52 DOM
-
2026-06-01days on market $1,649,000 Active 51 DOM
-
2026-05-31days on market $1,649,000 Active 50 DOM
-
2026-04-11$1,649,000 Active 921-char remark
Show marketing remark (921 chars)
Welcome to “The Tree House” in Seaview – a unique coastal retreat elevated on stilts, offering beautiful bay views and an unbeatable location. This 4-bedroom, 2-bathroom home perfectly blends charm, comfort, and versatility, making it ideal for both relaxing getaways and entertaining. Step inside to find light-filled living spaces with an open flow, designed to take advantage of the water views and breezes. The elevated design creates a serene, treehouse-like atmosphere, offering both privacy and scenic outlooks. The property also includes a detached cottage with a half bath and pull-out sofa, providing endless possibilities—whether you envision a guest suite, private office, additional bedroom, or extra living area. This property provides 4 bedrooms, 2 full baths, and a versatile cottage with half bath—an excellent opportunity to own a spacious, well-located home in Seaview.
-
2026-03-11historical
-
2025-08-25$1,649,000 Active
-
2020-12-07soldstatus $999,000
-
2017-11-01soldstatus $846,150
-
2000-09-25soldstatus $280,000
ⓘ Source: listings_history table (triggers on properties + properties_extension) + one-shot
backfill from property_details.listing_events for pre-trigger history.
Tax reassessment forecast NY · Partial reset (capped growth)
- Current annual tax
- $7,663 · $639/mo
- Projected year-2 tax
- $17,765 · $1,480/mo
- Expected delta
- +$10,103/yr (+$842/mo · 131.8%)
ⓘ Screening estimate from a state-policy table — verify with the county assessor before closing.
Climate risk First Street
- Flood 10/10 Extreme FEMA zone AE · 99% chance over 30 yrs
- Wildfire 3/10 Moderate
- Heat 4/10 Moderate 7 d/yr ≥92°F today · 17 d/yr by 30 yrs out
- Wind 8/10 Severe 80% chance of damaging wind over 30 yrs
- Air quality 5/10 Major 9 unhealthy d/yr today · 9 by 30 yrs out
Nearby sold comps map
Loading sold comps map…
Walkable amenities ~0.75 mi
Loading nearby amenities…
Taxation est. · year 1
- Rental income
- $109,692
- − Mortgage interest
- −$92,370
- − Property taxes
- −$7,663
- − Insurance
- −$13,770
- − Repairs & maintenance
- −$8,775
- − Management
- −$8,775
- − HOA
- −$6,132
- − Depreciation
- −$47,971
- Taxable loss
- −$75,764
- Est. tax savings @ 24.0%
- +$18,183
- After-tax cash flow
- $-26,495/yr
For passive investors: Depreciation is non-cash, so a rental often shows a tax loss while cash-flowing — sheltering income. Rental losses are passive: they offset passive income freely, and up to $25,000/yr can offset ordinary (W-2) income if you actively participate and your MAGI is under $100k (phasing out to $0 by $150k); unused losses carry forward. On sale, claimed depreciation is recaptured at up to 25%, and gains may owe capital-gains tax (a 1031 exchange can defer both). Figures are a year-1 estimate at your 24.0% rate — not tax advice; consult a CPA.
Schools (NCES district)
- District
- Fire Island Union Free School District
- NCES district ID
- 3621540
- Math proficiency
- 75% ▲ 25.00%
- Reading proficiency
- 90% ▲ 40.00%
- Median HH income
- $69,449
- Composite
- 71.53/100
- National rank
- #222
- State rank
- #44 of 590 in NY
Livability — Fire Island
- Score
- 63/100
- State rank
- #812
- US rank
- #15735
Category grades
Schools grade is shown separately in the Schools card above.
Census & demographics
- Census place
- Fire Island, NY
- City population
- 124
- Population (ZIP)
- 124
Population outlook (Suffolk County) Hauer SSP2
- Today (2025)
- 1,505,262 people
- By 2030
- 1,498,318 · -0.5%
- By 2040
- 1,471,101 · -2.3%
- By 2050
- 1,424,848 · -5.3%
- By 2075
- 1,337,157 · -11.2%
- By 2100
- 1,217,720 · -19.1%
Race, ethnicity, and origin ACS 2023
- Neighborhood character
- Majority Hispanic (52%)
- Race & ethnicity
- Hispanic / Latino 52% White 48% Two or more races 27%
- Hispanic origin (detail)
- Puerto Rican 15% Dominican 12%
- Common ancestry
- Lithuanian 2%
- Foreign-born
- 16% · Canada
- Languages at home
- 42% English-only · Spanish 56% French/Haitian/Cajun 2%
Political lean MEDSL · Suffolk
- 2024 margin
- Lean R (+10.0) · D 45.0% · R 55.0%
- 2008→2024 swing
- -16.0pp toward R · 2008: 6.0pp · 2024: -10.0pp
- All cycles
- 2024: R+10.0 2020: R+0.0 2016: R+8.2 2012: D+2.9 2008: D+6.0
Not yet ingested
- Civics
- —
Market trends
- HPI YoY
- ▲ 69.28%
- Current HPI
- 575.12
- Rent YoY
- —
- Metro
- —
- State GDP YoY
- ▲ 2.60%
- F500 in state
- 92
Industry mix (Fortune 500 HQ in NY)
| Industry | F500 HQs | Revenue |
|---|---|---|
| Financial Services | 10 | $950B |
|
||
| Consumer Goods | 9 | $162B |
|
||
| Insurance | 4 | $225B |
|
||
| Telecommunications | 2 | $144B |
|
||
| Pharmaceuticals | 2 | $112B |
|
||
| Media / Entertainment | 2 | $69B |
|
||
Price history
+488.9% since first listed6 events — show timeline
- 2026-04-11 Listed $1,649,000 OneKey® MLS as Distributed by MLS Grid
- 2026-03-11 Listing Removed — OneKey® MLS as Distributed by MLS Grid
- 2025-08-25 Listed $1,649,000 OneKey® MLS as Distributed by MLS Grid
- 2020-12-07 Sold (Public Records) $999,000 Public Records
- 2017-11-01 Sold (Public Records) $846,150 Public Records
- 2000-09-25 Sold (Public Records) $280,000 Public Records
Property tax history
+1.6%/yrLatest (2017): $7,663 · +1.6% YoY. Source: county tax records.
Cash-flow waterfall
monthlySold comps — $/sqft
last 12 mo · ≤1 miLoading sold comps…