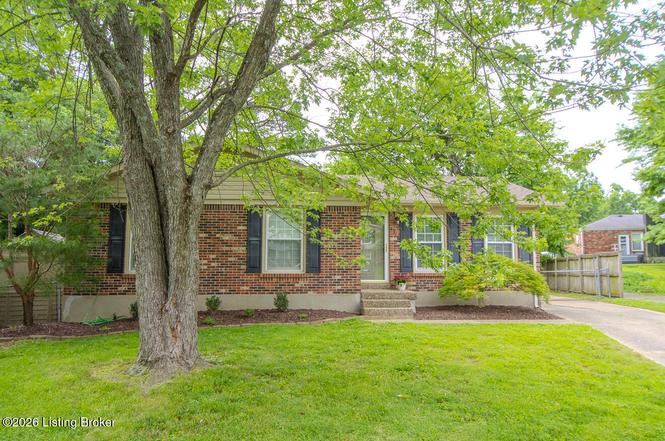
8313 Millington Ct · Louisville/Jefferson County metro government (balance), KY
Flood risk 1/10 · Minimal
- FEMA flood zone
- X (unshaded)
- Chance of flooding over 30 yrs
- 0.0%
- Est. flood insurance / yr
- $473 – $860
Fire risk 1/10 · Minimal
- Est. fire insurance / yr
- $839 – $1,559
Heat risk 5/10 · Moderate
- Hot days now (above 104°F)
- 7 days/yr
- Hot days in 30 yrs
- 19 days/yr
Wind risk 2/10 · Minimal
- Chance of severe wind over 30 yrs
- 2.0%
Air-quality risk 3/10 · Minor
- Unhealthy air days now
- 2 days/yr
- Unhealthy air days in 30 yrs
- 3 days/yr
Risk factors via First Street. Map © Google.
Why this score? — see what drove the C- grade
The composite is a weighted blend of 9 inputs, each scored 0–100. Each bar is that input's sub-score; the figure is the points it added to the 100-point composite (weight × sub-score).
- Cash flow +16.7/30.0
- ARV discount +15.0/15.0
- DSCR +5.2/10.0
- 1% rule +4.0/10.0
- Rent growth +2.5/5.0
- Livability +2.5/5.0
- Condition / age +2.5/5.0
- Schools +2.3/10.0
- Appreciation +0.0/10.0
$240,000
🖨 Deal sheet (PDF) 📄 Offer letter ✓ Due diligence
Listing remarks
Move-in Ready + Great Price! Come see this 3 Bedroom, 2 Full Bath home with 2,214 total finished square feet of living space. Enter to the Living Room with lots of natural light and has a convenient opening to the Kitchen with a large counter/bar area - perfect for entertaining. The Primary Bedroom offers an en-suite Full Bath with a shower. Two more Bedrooms and a Full Bath complete the main floor. Notice the beautiful hardwood flooring throughout. Make your way to the spacious Finished Basement with areas for a Family Room, Game Room, Workout Area, or Home Office. So many possibilities. Enjoy the outdoors on the large Deck, which leads to the paver Patio and Storage Shed. The backyard is
Key facts
- Large deck
- Finished basement
- Paver patio
Tags
Property features AI
Finance
- Other: Subdivision: Pleasant Valley
- HOA & community: No association fee
Exterior
- Parking: Driveway
- Utilities: Electricity connected
- Home design: Single-family ranch-style home; One story; Living areas include a first-floor living room and a basement family room
- Construction: Built in 1977; Wood frame construction; Shingle roof; Poured concrete foundation
- Exterior features: Level lot; Property on a cul-de-sac; Privacy/full wood and chain-link fencing
Interior
- Kitchen: Eat-in kitchen on the first floor
- Bedrooms: Three bedrooms total, all on the first floor; Primary bedroom on the first floor with primary bathroom on the first floor
- Bathrooms: Two full bathrooms, including a primary full bathroom on the first floor; No half bathrooms
- Interior features: Finished basement; Eight total main rooms (10 rooms listed total); Seven closets; No fireplaces
- Laundry & utility: Laundry room in the basement; No first-floor laundry
Neighborhood map
What this means for you Summary
Snapshot
- This is a 3-bed/2.0-bath single-family listed at $240k.
Deal economics
- At list price, monthly cash flow is $149 ($2k/yr) — positive.
- The deal already cash-flows at list — no discount required.
- To meet the 1% rule (rent ≥ 1% of price), the offer needs to be $216k (10.1% below list).
- Recommended offer: $216k (10.1% below list) — sets the bar for 1% rule.
- Cap rate 7.0% vs local median 4.0% in Louisville/Jefferson County metro government (balance) — top-decile yield for the area; either an underpriced asset or a hidden risk that comps aren't pricing in. Stress-test before assuming the spread holds.
Location & tenants
- Location reads: area grade C — affects rentability + tenant quality, not the cash-flow math above.
- Jefferson County (urban): math 19% / reading 35% proficiency, ranked #121 of 165 in KY (top 73%) — low school quality limits family demand, transient renter base, plan for 1-2y turnover.
- Zoned schools: Smyrna Elementary School (math 12% / reading 22%, grade F, #607 of 676 statewide, top 91%, 509 students, 65% FRL).
- Market conditions: 97 active listings in the ZIP; 4 comparable units currently listed for rent nearby; rentals leasing fast (median 14d on market — plan ~1-2 weeks tenant-placement turnaround); solid renter incomes; 2,836 units permitted in Jefferson County in 2024 (1,558 in 5+ unit buildings).
- This rent runs 33% of the median local income ($79k/yr) — at the standard rent-burdened threshold; future hikes will face affordability resistance.
Forward outlook
- Local home prices are declining (-3.0%/yr); year-one equity from $2k of loan paydown is wiped out by about $7k of value loss. Plan a longer hold.
- Jefferson County population projected at +13% by 2050 — modest demand growth; plan on rents tracking national, not racing it.
Negotiation context
- Only 3 days on market — expect competitive offers; lowballing is unlikely to land.
- 2 sale attempts since 11y ago with the ask held roughly flat each time — persistent listings suggest the price (not the market) is what's stuck; bring a comps-based counter.
- Current owner paid $149k; list at $240k implies a 61% gain — meaningful room to come down on a strong offer.
Risks & watch-outs
- Climate carrying-cost: extreme-heat days projected 7→19/yr by 2055 (HVAC capex compounding) — expect insurance premiums to compound above CPI over the hold.
Questions for the listing agent
- Built in 1977 — when were the roof, HVAC, electrical panel, plumbing, and water heater last replaced?
- Is there a deadline driving the sale (1031 exchange, divorce, estate, relocation)? That informs how much negotiation room exists.
- What's the average days-on-market for RENTAL listings here right now (not sales)? A rising rental-DOM trend means longer vacancies and softer asking-rent achievability than the comps imply.
- What's the recent tenant-quality profile in this submarket — average credit score on applications, eviction rate, late-payment / NSF rate, and stable-employment percentage? A property-management company in the area should have these aggregated.
- How much new for-sale + rental construction is in the pipeline within 1–3 miles? Heavy new supply typically softens prices + rents 12–24 months out; constrained supply supports both.
Investment metrics
- 1% rule
- 0.90% ✗
- Cap rate
- 7.04%
- Cash-on-cash
- 2.65%
- DSCR
- 1.12
- GRM
- 9.3
CMA / ARV
- ARV (on-the-fly)
- $314,388
- Comps found
- 12
Show comp detail 12 sales within ~0.75 mi
| Address | Dist | Beds/Ba | Sqft | Sold | Price | $/sf | Match |
|---|---|---|---|---|---|---|---|
| 7025 Alma June Way | 0.06mi | 3/3.0 | 2,283 (+3%) | 4mo | $315,000 | $138 | 85 |
| 8413 Acme Way | 0.38mi | 3/2.0 | 2,057 (-7%) | 1mo | $300,000 | $146 | 70 |
| 6107 Schreiner Ct | 0.38mi | 3/2.0 | 2,380 (+8%) | 4mo | $382,500 | $161 | 67 |
| 7017 Alma June Way | 0.10mi | 3/3.5 | 2,495 (+13%) | 3mo | $351,000 | $141 | 66 |
| 8121 Acme Way | 0.47mi | 3/2.0 | 2,321 (+5%) | 7mo | $330,000 | $142 | 64 |
| 6210 Apex Dr | 0.64mi | 3/1.5 | 2,318 (+5%) | 3mo | $324,950 | $140 | 58 |
| 8610 Juarez Ct | 0.55mi | 3/2.0 | 2,384 (+8%) | 4mo | $300,000 | $126 | 58 |
| 6412 Oak Village Dr | 0.41mi | 3/2.0 | 1,919 (-13%) | 2mo | $325,000 | $169 | 57 |
| 8007 Wanda Way | 0.63mi | 4/2.0 (+1) | 2,104 (-5%) | 3mo | $315,000 | $150 | 55 |
| 5917 Bay Pine Dr | 0.65mi | 4/3.0 (+1) | 2,308 (+4%) | 2mo | $310,000 | $134 | 52 |
| 8814 Old Ironsides Dr | 0.39mi | 4/2.0 (+1) | 1,936 (-13%) | 7mo | $285,000 | $147 | 50 |
| 9000 John Paul Ct | 0.67mi | 4/2.0 (+1) | 1,970 (-11%) | 6mo | $265,000 | $135 | 40 |
Match score weights: distance 35% · size 25% · config 20% · recency 20%. Top-matched comps best support the ARV.
Projected returns pro-forma
-3.0% appreciation · 3.0% rent growth · sell at horizon
- IRR
- -12.1%
- Equity multiple
- 0.56×
- Total profit
- $-29,456
- Equity at exit
- $35,785
- IRR
- -3.0%
- Equity multiple
- 0.80×
- Total profit
- $-13,584
- Equity at exit
- $20,751
Cash invested: $67,200 (down + closing). Projections, not guarantees.
Landlord ↔ Tenant lean methodology
- Overall (STATE)
- 83 Strongly Landlord-Friendly
- State Kentucky
- 83 Strongly Landlord-Friendly · R+16
- County
- — inherits STATE
- City
- — inherits STATE
ZIP-level market 40228
- Active inventory
- 97
- Price-to-rent
- 9.3×
Monthly cashflow live
- Estimated rent
- $2,159 medium interval (Pro) →
- Mortgage (P&I)
- −$1,259
- Tax from tax record
- −$198 /mo · $2,379/yr
- Insurance
- −$100
- HOA
- −$0
- Vacancy / Maint / Mgmt
- −$453
- Net cashflow
- $149
Break-even live
Sensitivity live
| Price | -10% $284 | -5% $217 | +0% $149 | +5% $81 | +10% $13 |
|---|---|---|---|---|---|
| Rent | -10% $-22 | -5% $63 | +0% $149 | +5% $234 | +10% $319 |
| Rate | -1.0pp $269 | -0.5pp $210 | base $149 | +0.5pp $86 | +1.0pp $23 |
UW: 25.0% down · 7.5% · 30yr · 1.5% tax · 5.0% vac · 8.0% maint · 8.0% mgmt
Financing live
Cash to close
- Down payment
- $60,000
- Closing costs
- $7,200
- Reserves months
- —
- Total cash needed
- —
Loan-product check · same deal, 3 products live
Conventional
25% down · 7.5% · 30yr
- Down + closing
- —
- Monthly P&I
- —
- Monthly cashflow
- —
- DSCR
- —
- Eligible?
- —
Personal DTI + credit; lowest rate.
DSCR
20% down · 8.5% · 30yr
- Down + closing
- —
- Monthly P&I
- —
- Monthly cashflow
- —
- DSCR
- —
- Eligible?
- —
No personal income docs; deal must DSCR.
Hard money
10% down · 12.0% · 12mo
- Down + closing
- —
- Monthly P&I
- —
- Monthly cashflow
- —
- DSCR
- —
- Eligible?
- —
Short-term bridge; refi at stabilization.
Rent comps 4 comps
| Address | Beds | Baths | Sqft | Rent | $/sqft | DOM | Units | Dist |
|---|---|---|---|---|---|---|---|---|
| 8317 Daverman Dr Louisville, KY | 4.0 | 2.0 | 1929 | $2,100 | $1.09 | 25d | 1 | 0.09mi |
| 8825 Anatolia Ct Louisville, KY | 1.0–3.0 | 1.0–2.0 | 1071 | $2,059 | $1.92 | 5d | 18 | 0.43mi |
| 7901 Bridlewood Pl Louisville, KY | 3.0 | 1.5 | 1650 | $1,799 | $1.09 | 13d | 1 | 1.35mi |
| 7901 Bridlewood Pl Louisville, KY | 3.0 | 1.5 | 1650 | $1,799 | $1.09 | 5d | 1 | 1.35mi |
Listing history 3 events
-
2026-06-15statusdays on market $240,000 Pending 3 DOM
-
2026-06-13remarks 699-char remark
-
2026-06-13$240,000 Active 2 DOM
ⓘ Source: listings_history table (triggers on properties + properties_extension) + one-shot
backfill from property_details.listing_events for pre-trigger history.
Tax reassessment forecast KY · Resets to sale price
- Current annual tax
- $2,379 · $198/mo
- Projected year-2 tax
- $2,379 · $198/mo
- Expected delta
- $0/yr ($0/mo · 0.0%)
ⓘ Screening estimate from a state-policy table — verify with the county assessor before closing.
Climate risk First Street
- Flood 1/10 Low FEMA zone X (unshaded) · 0% chance over 30 yrs
- Wildfire 1/10 Low
- Heat 5/10 Major 7 d/yr ≥104°F today · 19 d/yr by 30 yrs out
- Wind 2/10 Low 2% chance of damaging wind over 30 yrs
- Air quality 3/10 Moderate 2 unhealthy d/yr today · 3 by 30 yrs out
Nearby sold comps map
Loading sold comps map…
Walkable amenities ~0.75 mi
Loading nearby amenities…
Taxation est. · year 1
- Rental income
- $25,905
- − Mortgage interest
- −$13,444
- − Property taxes
- −$2,379
- − Insurance
- −$1,200
- − Repairs & maintenance
- −$2,072
- − Management
- −$2,072
- − Depreciation
- −$6,982
- Taxable loss
- −$2,244
- Est. tax savings @ 24.0%
- +$539
- After-tax cash flow
- $2,322/yr
For passive investors: Depreciation is non-cash, so a rental often shows a tax loss while cash-flowing — sheltering income. Rental losses are passive: they offset passive income freely, and up to $25,000/yr can offset ordinary (W-2) income if you actively participate and your MAGI is under $100k (phasing out to $0 by $150k); unused losses carry forward. On sale, claimed depreciation is recaptured at up to 25%, and gains may owe capital-gains tax (a 1031 exchange can defer both). Figures are a year-1 estimate at your 24.0% rate — not tax advice; consult a CPA.
Schools (NCES district)
- District
- Jefferson County
- NCES district ID
- 2102990
- Math proficiency
- 19% ▼ -17.00%
- Reading proficiency
- 35% ▼ -11.00%
- Median HH income
- $47,885
- Composite
- 23.45/100
- National rank
- #7884
- State rank
- #121 of 165 in KY
Livability — Louisville/Jefferson County metro government (balance)
No livability data for this city. (Only ~50 U.S. cities are tracked.)
Census & demographics
- Census place
- Louisville/Jefferson County metro government (balance), KY
- County
- Jefferson County · 790,184 people
- City population
- 419,741
- Metro
- Louisville/Jefferson County, KY-IN
- Population (ZIP)
- 18,085
- Household income
- $79,404
- Rent vs Own
- Severe rent burden
- 95.0
Population outlook (Jefferson County) Hauer SSP2
- Today (2025)
- 823,112 people
- By 2030
- 849,343 · +3.2%
- By 2040
- 895,696 · +8.8%
- By 2050
- 933,630 · +13.4%
- By 2075
- 1,028,262 · +24.9%
- By 2100
- 1,072,675 · +30.3%
Race, ethnicity, and origin ACS 2023
- Neighborhood character
- Majority White (65%)
- Race & ethnicity
- White 65% Black 16% Two or more races 14% Hispanic / Latino 11% Asian 1%
- Hispanic origin (detail)
- Mexican 1% Cuban 7%
- Common ancestry
- Italian 2% Lithuanian 2% Swiss 1%
- Foreign-born
- 14% · Canada
- Languages at home
- 84% English-only · Spanish 9% Arabic 1% Other Asian/Pacific 1%
Political lean MEDSL · Jefferson
- 2024 margin
- D (+16.6) · D 57.4% · R 40.9% · Other 1.7%
- 2008→2024 swing
- +4.5pp toward D · 2008: 12.0pp · 2024: 16.6pp
- All cycles
- 2024: D+16.6 2020: D+20.1 2016: D+13.3 2012: D+11.1 2008: D+12.0
Not yet ingested
- Civics
- —
Market trends
- HPI YoY
- ▼ -215.41%
- Current HPI
- 238.4061
- Rent YoY
- —
- Metro
- Louisville/Jefferson County, KY-IN
- State GDP YoY
- ▲ 1.81%
- F500 in state
- 4
Industry mix (Fortune 500 HQ in KY)
| Industry | F500 HQs | Revenue |
|---|---|---|
| Healthcare | 1 | $118B |
|
||
| Food / Beverage | 1 | $7B |
|
||
Price history
+87.5% since first listed7 events — show timeline
- 2026-06-11 Listed $240,000 Metro Search MLS
- 2017-11-20 Sold (Public Records) $149,000 Public Records
- 2015-04-30 Listing Removed — Metro Search MLS
- 2015-04-02 Listed $142,999 Metro Search MLS
- 2015-02-27 Price Changed $139,999 Metro Search MLS
- 2015-02-27 Price Changed $142,998 Metro Search MLS
- 2009-04-17 Sold (Public Records) $128,000 Public Records
Property tax history
+5.3%/yrLatest (2025): $2,379 · +14.6% YoY. Source: county tax records.
Cash-flow waterfall
monthlySold comps — $/sqft
last 12 mo · ≤1 miLoading sold comps…