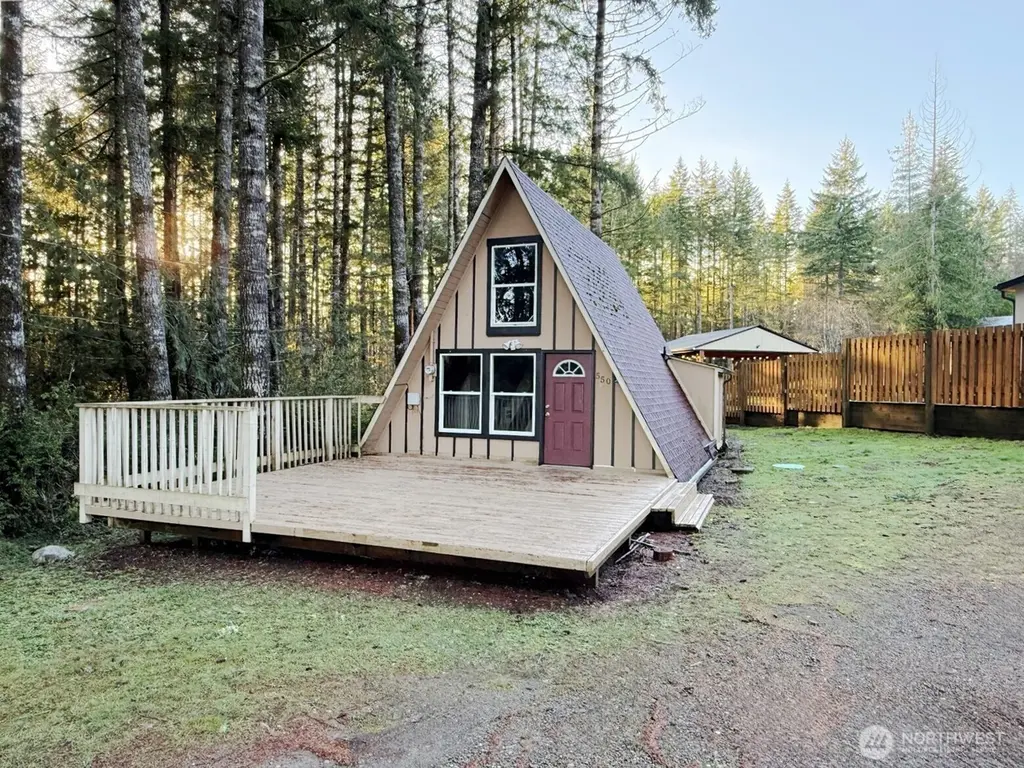
550 E Trails End Dr · Allyn, WA
Flood risk 1/10 · Minimal
- FEMA flood zone
- X (unshaded)
- Chance of flooding over 30 yrs
- 0.0%
- Est. flood insurance / yr
- $507 – $1,088
Fire risk 3/10 · Minor
- Est. fire insurance / yr
- $604 – $1,122
Heat risk 3/10 · Minor
- Hot days now (above 87°F)
- 6 days/yr
- Hot days in 30 yrs
- 12 days/yr
Wind risk 1/10 · Minimal
- Chance of severe wind over 30 yrs
- —
Air-quality risk 6/10 · Moderate
- Unhealthy air days now
- 8 days/yr
- Unhealthy air days in 30 yrs
- 8 days/yr
Risk factors via First Street. Map © Google.
Why this score? — see what drove the C- grade
The composite is a weighted blend of 9 inputs, each scored 0–100. Each bar is that input's sub-score; the figure is the points it added to the 100-point composite (weight × sub-score).
- Cash flow +17.5/30.0
- ARV discount +15.0/15.0
- DSCR +5.5/10.0
- 1% rule +3.8/10.0
- Schools +3.5/10.0
- Livability +3.4/5.0
- Rent growth +2.5/5.0
- Condition / age +2.5/5.0
- Appreciation +0.0/10.0
$189,900
🖨 Deal sheet 📄 Offer letter ✓ Due diligence
Listing remarks
Charming getaway cabin in the sleepy Trails End community of Belfair. Under an hour from Gig Harbor or Tacoma, this A-frame is tucked into the woods with a peek-a-boo view of the lake. Rustic and full of character, it could use a little love—but priced accordingly and ready for your vision. Plenty of parking and a big front deck set the stage for gatherings, morning coffee, or simply soaking in the quiet, park-like setting. Trails End Lake is a public lake with a boat launch just a few blocks away. No motorized boats allowed—just birdsong, fresh air, and the peaceful sounds of nature. A special spot with tons of potential. Come see!
Key facts
- Boat launch
- Public lake
- Peek-a-boo view
Tags
Neighborhood map
What this means for you Summary
Snapshot
- This is a 1-bed/1.0-bath other listed at $190k.
Deal economics
- At list price, monthly cash flow is $146 ($2k/yr) — positive.
- The deal already cash-flows at list — no discount required.
- To meet the 1% rule (rent ≥ 1% of price), the offer needs to be $168k (11.7% below list).
- Recommended offer: $167k (12.0% below list) — sets the bar for market timing.
- Cap rate 7.2% vs local median 3.1% in Allyn — top-decile yield for the area; either an underpriced asset or a hidden risk that comps aren't pricing in. Stress-test before assuming the spread holds.
Location & tenants
- Location reads 68/100 on livability (#287 in WA) — a middle-class / working-renter tenant base. Strengths: crime A+, employment A+, housing A+; Watch: health & safety C-, schools D-, amenities F.
- North Mason School District (rural): math 32% / reading 41% proficiency, ranked #233 of 291 in WA (top 80%) — families likely to look elsewhere, expect single-tenant / working-renter base with shorter leases.
- Market conditions: 145 active listings in the ZIP; 299 units permitted in Mason County in 2024 (0 in 5+ unit buildings).
Forward outlook
- Local home prices are declining (-3.0%/yr); year-one equity from $1k of loan paydown is wiped out by about $6k of value loss. Plan a longer hold.
- Mason County population projected at -14% by 2050 — secular population decline; favor cash flow + early exit over multi-decade hold.
Negotiation context
- It's been on market 135 days — a 12% lower offer ($167k) is reasonable based on typical stale-listing flexibility.
- 5 sale attempts since 26y ago; this cycle's ask has dropped $57k (23%) from the opening price — seller is motivated, your offer sets the floor, not the list.
- Current owner paid $136k; 40% above their basis — modest negotiation headroom, anchor on the comps not their cost.
Questions for the listing agent
- It's been on market 135 days. Have you received any prior offers? Is the seller open to a 12% concession, seller financing, or rate buy-down credit?
- Built in 1969 — when were the roof, HVAC, electrical panel, plumbing, and water heater last replaced?
- Why hasn't it sold? Are there any deal-killer items the seller is aware of (foundation, flood, title, zoning, code violations)?
- Is there a deadline driving the sale (1031 exchange, divorce, estate, relocation)? That informs how much negotiation room exists.
- Schools are D-rated, which usually means shorter tenancies and higher turnover. Who's the typical renter profile here, and what's been the actual vacancy rate?
- What's the average days-on-market for RENTAL listings here right now (not sales)? A rising rental-DOM trend means longer vacancies and softer asking-rent achievability than the comps imply.
- What's the recent tenant-quality profile in this submarket — average credit score on applications, eviction rate, late-payment / NSF rate, and stable-employment percentage? A property-management company in the area should have these aggregated.
- How much new for-sale + rental construction is in the pipeline within 1–3 miles? Heavy new supply typically softens prices + rents 12–24 months out; constrained supply supports both.
Investment metrics
- 1% rule
- 0.88% ✗
- Cap rate
- 7.22%
- Cash-on-cash
- 3.30%
- DSCR
- 1.15
- GRM
- 9.4
CMA / ARV
- ARV (median comp)
- $341,298
- List price
- $189,900
- Delta
- -44.36%
- Verdict
- UNDERPRICED
- Comps
- 6 within 1.0 mi
Projected returns pro-forma
-3.0% appreciation · 3.0% rent growth · sell at horizon
- IRR
- -11.1%
- Equity multiple
- 0.60×
- Total profit
- $-21,522
- Equity at exit
- $28,315
- IRR
- -1.9%
- Equity multiple
- 0.87×
- Total profit
- $-6,988
- Equity at exit
- $16,419
Cash invested: $53,172 (down + closing). Projections, not guarantees.
Landlord ↔ Tenant lean methodology
- Overall (STATE)
- 28 Tenant-Leaning
- State Washington
- 28 Tenant-Leaning · D+8
- County
- — inherits STATE
- City
- — inherits STATE
ZIP-level market 98528
- Active inventory
- 145
- Price-to-rent
- 9.4×
Monthly cashflow live
- Estimated rent
- $1,676 medium interval (Pro) →
- Mortgage (P&I)
- −$996
- Tax from tax record
- −$103 /mo · $1,236/yr
- Insurance
- −$79
- HOA
- −$0
- Vacancy / Maint / Mgmt
- −$352
- Net cashflow
- $146
Break-even live
UW: 25.0% down · 7.5% · 30yr · 1.5% tax · 5.0% vac · 8.0% maint · 8.0% mgmt
Financing live
Cash to close
- Down payment
- $47,475
- Closing costs
- $5,697
- Reserves months
- —
- Total cash needed
- —
Loan-product check · same deal, 3 products live
Conventional
25% down · 7.5% · 30yr
- Down + closing
- —
- Monthly P&I
- —
- Monthly cashflow
- —
- DSCR
- —
- Eligible?
- —
Personal DTI + credit; lowest rate.
DSCR
20% down · 8.5% · 30yr
- Down + closing
- —
- Monthly P&I
- —
- Monthly cashflow
- —
- DSCR
- —
- Eligible?
- —
No personal income docs; deal must DSCR.
Hard money
10% down · 12.0% · 12mo
- Down + closing
- —
- Monthly P&I
- —
- Monthly cashflow
- —
- DSCR
- —
- Eligible?
- —
Short-term bridge; refi at stabilization.
Listing history 15 events
-
2026-05-08status Pending
-
2026-05-01status Active
-
2026-04-29status Pending
-
2026-04-27price $189,900
-
2026-04-02price $199,900
-
2026-04-02status Active
-
2026-03-31status Pending
-
2026-03-09price $209,900
-
2026-02-09price $224,900
-
2026-01-15price $234,900
-
2025-12-19$246,900 Active
-
2006-04-07soldstatus $135,500
-
2006-01-23$141,900
-
2000-06-20soldstatus $39,000
-
2000-05-03$42,000
ⓘ Source: listings_history table (triggers on properties + properties_extension) + one-shot
backfill from property_details.listing_events for pre-trigger history.
Tax reassessment forecast WA · Resets to sale price
- Current annual tax
- $1,236 · $103/mo
- Projected year-2 tax
- $1,861 · $155/mo
- Expected delta
- +$625/yr (+$52/mo · 50.6%)
ⓘ Screening estimate from a state-policy table — verify with the county assessor before closing.
Climate risk First Street
- Flood 1/10 Low FEMA zone X (unshaded) · 0% chance over 30 yrs
- Wildfire 3/10 Moderate
- Heat 3/10 Moderate 6 d/yr ≥87°F today · 12 d/yr by 30 yrs out
- Wind 1/10 Low
- Air quality 6/10 Major 8 unhealthy d/yr today · 8 by 30 yrs out
Nearby sold comps map
Loading sold comps map…
Walkable amenities ~0.75 mi
Loading nearby amenities…
Taxation est. · year 1
- Rental income
- $20,113
- − Mortgage interest
- −$10,637
- − Property taxes
- −$1,236
- − Insurance
- −$950
- − Repairs & maintenance
- −$1,609
- − Management
- −$1,609
- − Depreciation
- −$5,524
- Taxable loss
- −$1,452
- Est. tax savings @ 24.0%
- +$349
- After-tax cash flow
- $2,102/yr
For passive investors: Depreciation is non-cash, so a rental often shows a tax loss while cash-flowing — sheltering income. Rental losses are passive: they offset passive income freely, and up to $25,000/yr can offset ordinary (W-2) income if you actively participate and your MAGI is under $100k (phasing out to $0 by $150k); unused losses carry forward. On sale, claimed depreciation is recaptured at up to 25%, and gains may owe capital-gains tax (a 1031 exchange can defer both). Figures are a year-1 estimate at your 24.0% rate — not tax advice; consult a CPA.
Schools (NCES district)
- District
- North Mason School District
- NCES district ID
- 5305790
- Math proficiency
- 32% ▼ -4.00%
- Reading proficiency
- 41% ▼ -5.00%
- Median HH income
- $55,458
- Composite
- 34.67/100
- National rank
- #10069
- State rank
- #233 of 291 in WA
Livability — Allyn
- Score
- 68/100
- State rank
- #287
- US rank
- #10039
Category grades
Schools grade is shown separately in the Schools card above.
Census & demographics
- Population (ZIP)
- 12,398
Population outlook (Mason County) Hauer SSP2
- Today (2025)
- 60,005 people
- By 2030
- 58,567 · -2.4%
- By 2040
- 54,735 · -8.8%
- By 2050
- 51,470 · -14.2%
- By 2075
- 46,276 · -22.9%
- By 2100
- 39,883 · -33.5%
Race, ethnicity, and origin ACS 2023
- Neighborhood character
- Predominantly White (75%)
- Race & ethnicity
- White 75% Hispanic / Latino 12% Two or more races 9% Black 2% Asian 2%
- Hispanic origin (detail)
- Mexican 4%
- Common ancestry
- Portuguese 7% Italian 6% Slovak 5%
- Foreign-born
- 7% · Canada, Vietnam
- Languages at home
- 90% English-only · Spanish 7% Other Indo-European 1% Vietnamese 1%
Political lean MEDSL · Mason
- 2024 margin
- Toss-up / Even · D 47.2% · R 49.7% · Other 3.2%
- 2008→2024 swing
- -11.2pp toward R · 2008: 8.7pp · 2024: -2.5pp
- All cycles
- 2024: R+2.5 2020: R+3.9 2016: R+6.0 2012: D+6.9 2008: D+8.7
Not yet ingested
- Civics
- —
Market trends
- HPI YoY
- ▼ -207.97%
- Current HPI
- 205.0499
- Rent YoY
- —
- Metro
- —
- State GDP YoY
- ▲ 4.65%
- F500 in state
- 22
Industry mix (Fortune 500 HQ in WA)
| Industry | F500 HQs | Revenue |
|---|---|---|
| Retail | 2 | $269B |
|
||
| Technology / Retail | 1 | $638B |
|
||
| Technology | 1 | $245B |
|
||
| Telecommunications | 1 | $38B |
|
||
| Food / Beverage | 1 | $36B |
|
||
| Automotive / Trucks | 1 | $34B |
|
||
Price history
+352.1% since first listed15 events — show timeline
- 2026-05-08 Pending — NWMLS as Distributed by MLS Grid
- 2026-05-01 Relisted — NWMLS as Distributed by MLS Grid
- 2026-04-29 Pending — NWMLS as Distributed by MLS Grid
- 2026-04-27 Price Changed $189,900 NWMLS as Distributed by MLS Grid
- 2026-04-02 Price Changed $199,900 NWMLS as Distributed by MLS Grid
- 2026-04-02 Relisted — NWMLS as Distributed by MLS Grid
- 2026-03-31 Pending — NWMLS as Distributed by MLS Grid
- 2026-03-09 Price Changed $209,900 NWMLS as Distributed by MLS Grid
- 2026-02-09 Price Changed $224,900 NWMLS as Distributed by MLS Grid
- 2026-01-15 Price Changed $234,900 NWMLS as Distributed by MLS Grid
- 2025-12-19 Listed $246,900 NWMLS as Distributed by MLS Grid
- 2006-04-07 Sold (MLS) $135,500 NWMLS as Distributed by MLS Grid
- 2006-01-23 Listed $141,900 NWMLS as Distributed by MLS Grid
- 2000-06-20 Sold (MLS) $39,000 NWMLS as Distributed by MLS Grid
- 2000-05-03 Listed $42,000 NWMLS as Distributed by MLS Grid
Property tax history
+2.8%/yrLatest (2026): $1,236 · -13.1% YoY. Source: county tax records.
Cash-flow waterfall
monthlySold comps — $/sqft
last 12 mo · ≤1 miLoading sold comps…