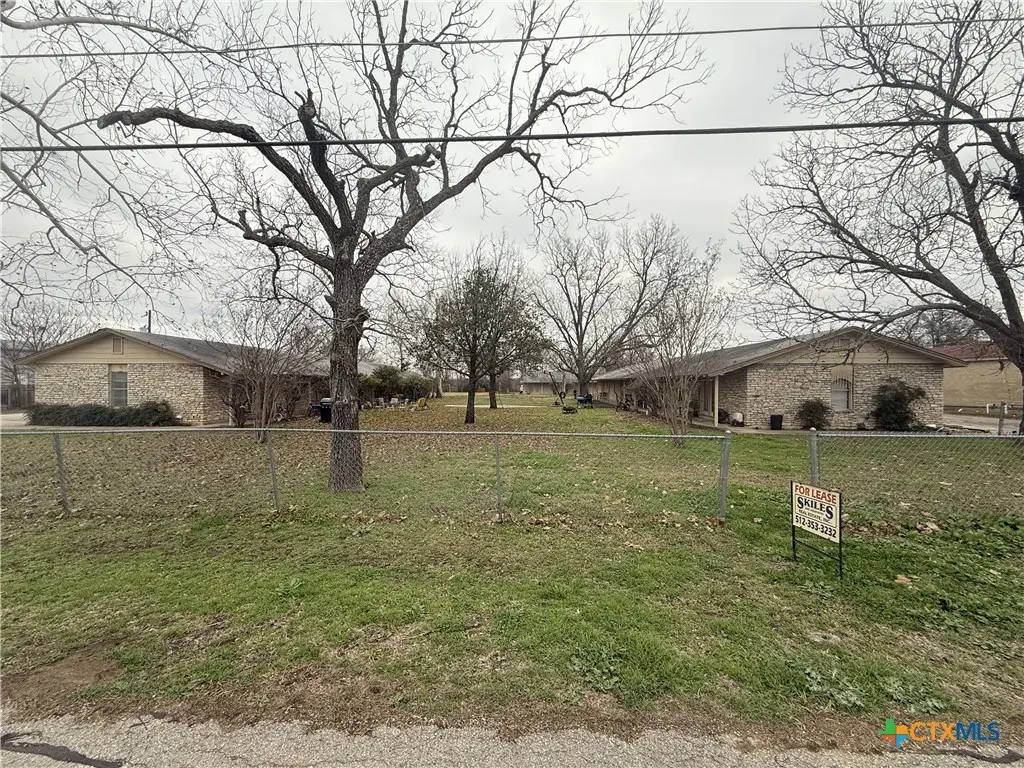
200-220 Quail Run Rd · Martindale, TX
Flood risk 5/10 · Moderate
- FEMA flood zone
- AE
- Chance of flooding over 30 yrs
- 0.24%
- Est. flood insurance / yr
- $1,737 – $8,500
Fire risk 3/10 · Minor
- Est. fire insurance / yr
- $1,222 – $2,270
Heat risk 8/10 · Major
- Hot days now (above 108°F)
- 7 days/yr
- Hot days in 30 yrs
- 23 days/yr
Wind risk 8/10 · Major
- Chance of severe wind over 30 yrs
- 80.0%
Air-quality risk 1/10 · Minimal
- Unhealthy air days now
- 0 days/yr
- Unhealthy air days in 30 yrs
- 0 days/yr
Risk factors via First Street. Map © Google.
Why this score? — see what drove the F grade
The composite is a weighted blend of 9 inputs, each scored 0–100. Each bar is that input's sub-score; the figure is the points it added to the 100-point composite (weight × sub-score).
- ARV discount +7.5/15.0
- Appreciation +5.5/10.0
- Livability +3.5/5.0
- Rent growth +2.5/5.0
- Condition / age +2.5/5.0
- Schools +2.0/10.0
- Cash flow +0.0/30.0
- 1% rule +0.0/10.0
- DSCR +0.0/10.0
$850,000
🖨 Deal sheet 📄 Offer letter ✓ Due diligence
Listing remarks MLS
12 UNITS FOR SALE IN MARTINDALE TEXAS. WALKING DISTANCE TO THE SAN MARCOS RIVER. 8 2 BEDROOM 1 BATH UNITS AND 4 1 BEDROOM 1 BATH UNITS. EASY ACCESS TO HWY 80 AND THE 110 FARM TO MARKET BYPASS THAT TAKES YOU TO IH 35 AND HWY 123. VIRTUAL TOUR AVAILABLE.
Key facts
- Built 1975
- Listed 72 days
Neighborhood map
What this means for you Summary
Snapshot
- This is a townhouse listed at $850k.
Deal economics
- At list price, monthly cash flow is $-5k ($-60k/yr) — negative.
- To cash-flow at today's rent, offer at most $27k (96.9% below list).
- To meet the 1% rule (rent ≥ 1% of price), the offer needs to be $77k (90.9% below list).
- Recommended offer: $27k (96.9% below list) — sets the bar for cash-flow.
Location & tenants
- Location reads 69/100 on livability (#397 in TX) — a middle-class / working-renter tenant base. Strengths: crime A+, cost of living A+, housing A+; Watch: schools F, amenities F, commute F.
- San Marcos CISD (rural): math 18% / reading 31% proficiency, ranked #731 of 826 in TX (top 88%) — low school quality limits family demand, transient renter base, plan for 1-2y turnover; 63% free/reduced lunch — lower-income household profile, screen leases tightly.
- Market conditions: 48 active listings in the ZIP; 2 comparable units currently listed for rent nearby; 529 units permitted in Caldwell County in 2024 (6 in 5+ unit buildings).
Forward outlook
- In year one you build about $14k of equity ($6k loan paydown + $8k appreciation (1.0% local appreciation)).
- Caldwell County population projected at +33% by 2050 — long-run rental-demand tailwind backs the buy-and-hold thesis.
- By year 4, paydown + projected appreciation supports a ~$52k cash-out refi (75% LTV) — recoverable capital for the next deal without selling this one.
Negotiation context
- It's been on market 72 days — a 6% lower offer ($799k) is reasonable based on typical stale-listing flexibility.
- 2 sale attempts with the ask held roughly flat each time — persistent listings suggest the price (not the market) is what's stuck; bring a comps-based counter.
Risks & watch-outs
- Watch-outs: flood insurance adds $427/mo.
- Climate carrying-cost: in FEMA flood zone AE (mandatory federal flood insurance); severe wind risk, 80% chance of damaging wind over 30y; extreme-heat days projected 7→23/yr by 2055 (HVAC capex compounding) — expect insurance premiums to compound above CPI over the hold.
Questions for the listing agent
- What do current leases actually rent for vs. the listed asking? Can we see a recent rent roll and the last 12 months of T-12 income?
- It's been on market 72 days. Have you received any prior offers? Is the seller open to a 97% concession, seller financing, or rate buy-down credit?
- Built in 1975 — when were the roof, HVAC, electrical panel, plumbing, and water heater last replaced?
- What's the actual annual flood-insurance premium (NFIP or private), and is the property in a SFHA with mandatory coverage?
- Why hasn't it sold? Are there any deal-killer items the seller is aware of (foundation, flood, title, zoning, code violations)?
- Is there a deadline driving the sale (1031 exchange, divorce, estate, relocation)? That informs how much negotiation room exists.
- Schools are F-rated, which usually means shorter tenancies and higher turnover. Who's the typical renter profile here, and what's been the actual vacancy rate?
- The area grade is low — what's the realistic commute time and amenity access for the typical tenant pool here? Any planned neighborhood developments (good or bad) we should know about?
- What's the average days-on-market for RENTAL listings here right now (not sales)? A rising rental-DOM trend means longer vacancies and softer asking-rent achievability than the comps imply.
- What's the recent tenant-quality profile in this submarket — average credit score on applications, eviction rate, late-payment / NSF rate, and stable-employment percentage? A property-management company in the area should have these aggregated.
- How much new for-sale + rental construction is in the pipeline within 1–3 miles? Heavy new supply typically softens prices + rents 12–24 months out; constrained supply supports both.
Investment metrics
- 1% rule
- 0.09% ✗
- Cap rate
- -0.18%
- Cash-on-cash
- -23.13%
- DSCR
- -0.03
- GRM
- 91.6
CMA / ARV
No comps found within radius.
Projected returns pro-forma
0.99% appreciation · 3.0% rent growth · sell at horizon
- IRR
- -25.7%
- Equity multiple
- -0.28×
- Total profit
- $-304,215
- Equity at exit
- $289,514
- IRR
- -17.8%
- Equity multiple
- -1.18×
- Total profit
- $-517,837
- Equity at exit
- $384,227
Cash invested: $238,000 (down + closing). Projections, not guarantees.
Landlord ↔ Tenant lean methodology
- Overall (STATE)
- 87 Strongly Landlord-Friendly
- State Texas
- 87 Strongly Landlord-Friendly · R+5
- County
- — inherits STATE
- City
- — inherits STATE
ZIP-level market 78655
- Home prices YoY
- 0.5%
- Active inventory
- 48
- Price-to-rent
- 91.6×
Monthly cashflow live
- Estimated rent
- $774 medium interval (Pro) →
- Mortgage (P&I)
- −$4,457
- Tax from tax record
- −$387 /mo · $4,645/yr
- Insurance
- −$354
- Flood insurance flood zone
- −$427 /mo · $5,118/yr
- HOA
- −$0
- Vacancy / Maint / Mgmt
- −$162
- Net cashflow
- $-5,014
Break-even live
UW: 25.0% down · 7.5% · 30yr · 1.5% tax · 5.0% vac · 8.0% maint · 8.0% mgmt
Financing live
Cash to close
- Down payment
- $212,500
- Closing costs
- $25,500
- Reserves months
- —
- Total cash needed
- —
Loan-product check · same deal, 3 products live
Conventional
25% down · 7.5% · 30yr
- Down + closing
- —
- Monthly P&I
- —
- Monthly cashflow
- —
- DSCR
- —
- Eligible?
- —
Personal DTI + credit; lowest rate.
DSCR
20% down · 8.5% · 30yr
- Down + closing
- —
- Monthly P&I
- —
- Monthly cashflow
- —
- DSCR
- —
- Eligible?
- —
No personal income docs; deal must DSCR.
Hard money
10% down · 12.0% · 12mo
- Down + closing
- —
- Monthly P&I
- —
- Monthly cashflow
- —
- DSCR
- —
- Eligible?
- —
Short-term bridge; refi at stabilization.
Rent comps 2 comps
| Address | Beds | Baths | Sqft | Rent | $/sqft | DOM | Units | Dist |
|---|---|---|---|---|---|---|---|---|
| 100 Quail Run Rd Unit 1 Martindale, TX | 1.0 | 1.0 | 2913 | $750 | $0.26 | 14d | 1 | 0.04mi |
| 104 Plains Dr Martindale, TX | 1.0 | 1.0 | 1932 | $950 | $0.49 | 43d | 1 | 0.56mi |
Listing history 17 events
-
2026-06-18days on market $850,000 Active 72 DOM
-
2026-06-17days on market $850,000 Active 71 DOM
-
2026-06-16days on market $850,000 Active 70 DOM
-
2026-06-15days on market $850,000 Active 69 DOM
-
2026-06-13days on market $850,000 Active 67 DOM
-
2026-06-09days on market $850,000 Active 63 DOM
-
2026-06-08days on market $850,000 Active 62 DOM
-
2026-06-07days on market $850,000 Active 61 DOM
-
2026-06-05days on market $850,000 Active 58 DOM
-
2026-06-03days on market $850,000 Active 57 DOM
-
2026-06-02days on market $850,000 Active 56 DOM
-
2026-06-01days on market $850,000 Active 55 DOM
-
2026-05-31days on market $850,000 Active 54 DOM
-
2026-04-07$850,000 Active 253-char remark
Show marketing remark (253 chars)
12 UNITS FOR SALE IN MARTINDALE TEXAS. WALKING DISTANCE TO THE SAN MARCOS RIVER. 8 2 BEDROOM 1 BATH UNITS AND 4 1 BEDROOM 1 BATH UNITS. EASY ACCESS TO HWY 80 AND THE 110 FARM TO MARKET BYPASS THAT TAKES YOU TO IH 35 AND HWY 123. VIRTUAL TOUR AVAILABLE.
-
2025-12-31historical
-
2025-10-27$1,250,000 Active
-
1990-10-25soldstatus
ⓘ Source: listings_history table (triggers on properties + properties_extension) + one-shot
backfill from property_details.listing_events for pre-trigger history.
Tax reassessment forecast TX · Resets to sale price
- Current annual tax
- $4,645 · $387/mo
- Projected year-2 tax
- $15,555 · $1,296/mo
- Expected delta
- +$10,910/yr (+$909/mo · 234.9%)
ⓘ Screening estimate from a state-policy table — verify with the county assessor before closing.
Climate risk First Street
- Flood 5/10 Major FEMA zone AE · 24% chance over 30 yrs
- Wildfire 3/10 Moderate
- Heat 8/10 Severe 7 d/yr ≥108°F today · 23 d/yr by 30 yrs out
- Wind 8/10 Severe 80% chance of damaging wind over 30 yrs
- Air quality 1/10 Low 0 unhealthy d/yr today · 0 by 30 yrs out
Nearby sold comps map
Loading sold comps map…
Walkable amenities ~0.75 mi
Loading nearby amenities…
Taxation est. · year 1
- Rental income
- $9,284
- − Mortgage interest
- −$47,613
- − Property taxes
- −$4,645
- − Insurance
- −$9,368
- − Repairs & maintenance
- −$743
- − Management
- −$743
- − Depreciation
- −$24,727
- Taxable loss
- −$78,555
- Est. tax savings @ 24.0%
- +$18,853
- After-tax cash flow
- $-41,315/yr
For passive investors: Depreciation is non-cash, so a rental often shows a tax loss while cash-flowing — sheltering income. Rental losses are passive: they offset passive income freely, and up to $25,000/yr can offset ordinary (W-2) income if you actively participate and your MAGI is under $100k (phasing out to $0 by $150k); unused losses carry forward. On sale, claimed depreciation is recaptured at up to 25%, and gains may owe capital-gains tax (a 1031 exchange can defer both). Figures are a year-1 estimate at your 24.0% rate — not tax advice; consult a CPA.
Schools (NCES district)
- District
- San Marcos CISD
- NCES district ID
- 4838970
- Math proficiency
- 18% ▼ -16.00%
- Reading proficiency
- 31% ▼ -8.00%
- Median HH income
- $34,538
- Composite
- 20.11/100
- National rank
- #8644
- State rank
- #731 of 826 in TX
Livability — Martindale
- Score
- 69/100
- State rank
- #397
- US rank
- #8261
Category grades
Schools grade is shown separately in the Schools card above.
Census & demographics
- Census place
- Martindale, TX
- Population (ZIP)
- 3,687
Population outlook (Caldwell County) Hauer SSP2
- Today (2025)
- 46,557 people
- By 2030
- 49,673 · +6.7%
- By 2040
- 55,827 · +19.9%
- By 2050
- 61,832 · +32.8%
- By 2075
- 77,212 · +65.8%
- By 2100
- 89,225 · +91.6%
Race, ethnicity, and origin ACS 2023
- Neighborhood character
- Majority Hispanic (61%)
- Race & ethnicity
- Hispanic / Latino 61% Two or more races 40% White 33% Black 1%
- Hispanic origin (detail)
- Mexican 60%
- Common ancestry
- Lithuanian 6% Italian 1% Serbian 1%
- Foreign-born
- 16% · Canada, China
- Languages at home
- 66% English-only · Spanish 32% Russian/Polish/Slavic 1% Chinese 1%
Political lean MEDSL · Caldwell
- 2024 margin
- R (+14.4) · D 42.2% · R 56.6% · Other 1.2%
- 2008→2024 swing
- -8.4pp toward R · 2008: -6.0pp · 2024: -14.4pp
- All cycles
- 2024: R+14.4 2020: R+9.1 2016: R+15.8 2012: R+11.1 2008: R+6.0
Not yet ingested
- Civics
- —
Market trends
- HPI YoY
- ▲ 0.99%
- Current HPI
- 221.4376
- Rent YoY
- —
- Metro
- —
- State GDP YoY
- ▲ 3.95%
- F500 in state
- 110
Industry mix (Fortune 500 HQ in TX)
| Industry | F500 HQs | Revenue |
|---|---|---|
| Energy | 16 | $1,198B |
|
||
| Technology | 5 | $198B |
|
||
| Engineering / Construction | 4 | $72B |
|
||
| Energy Services | 3 | $60B |
|
||
| Utilities | 3 | $41B |
|
||
| Healthcare | 2 | $330B |
|
||
Price history
-32.0% since first listed4 events — show timeline
- 2026-04-07 Listed $850,000 CTXMLS
- 2025-12-31 Listing Removed — CTXMLS
- 2025-10-27 Listed $1,250,000 CTXMLS
- 1990-10-25 Sold (Public Records) — Public Records
Property tax history
+6.1%/yrLatest (2025): $4,645 · -0.4% YoY. Source: county tax records.
Cash-flow waterfall
monthlySold comps — $/sqft
last 12 mo · ≤1 miLoading sold comps…