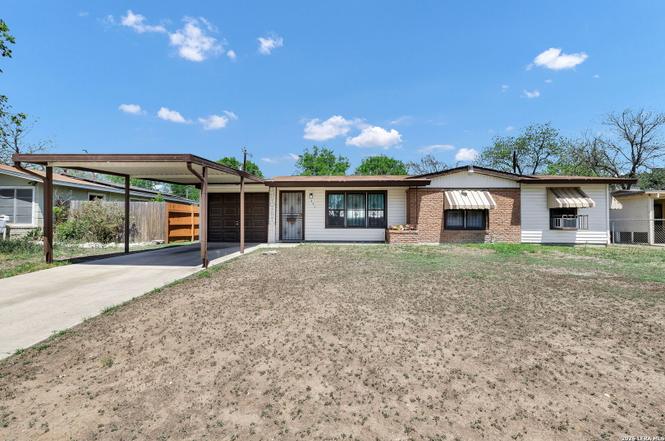
331 Saipan Pl · San Antonio, TX
Flood risk 1/10 · Minimal
- FEMA flood zone
- X (unshaded)
- Chance of flooding over 30 yrs
- 0.0%
- Est. flood insurance / yr
- $507 – $1,088
Fire risk 2/10 · Minimal
- Est. fire insurance / yr
- $1,222 – $2,270
Heat risk 8/10 · Major
- Hot days now (above 109°F)
- 7 days/yr
- Hot days in 30 yrs
- 22 days/yr
Wind risk 8/10 · Major
- Chance of severe wind over 30 yrs
- 80.0%
Air-quality risk 2/10 · Minimal
- Unhealthy air days now
- 0 days/yr
- Unhealthy air days in 30 yrs
- 1 days/yr
Risk factors via First Street. Map © Google.
Why this score? — see what drove the D grade
The composite is a weighted blend of 9 inputs, each scored 0–100. Each bar is that input's sub-score; the figure is the points it added to the 100-point composite (weight × sub-score).
- ARV discount +15.0/15.0
- Cash flow +7.7/30.0
- Appreciation +6.0/10.0
- Livability +4.0/5.0
- 1% rule +3.4/10.0
- Condition / age +2.5/5.0
- Schools +1.9/10.0
- DSCR +1.8/10.0
- Rent growth +0.7/5.0
$144,999
🖨 Deal sheet (PDF) 📄 Offer letter ✓ Due diligence
Listing remarks MLS
Discover the charm and potential of this inviting 3-bedroom, 1-bath home nestled in the heart of the Harlandale community! This move-in ready property features spacious bedrooms and a comfortable layout designed for everyday living. Whether you're a first-time buyer or looking for your next investment, this home offers the perfect balance of livability and opportunity, allowing you to move right in while still having the freedom to make it your own over time. Step outside to enjoy a generously sized yard, ideal for relaxing evenings, entertaining guests, or creating your own outdoor retreat. Additional storage sheds provide extra space for tools, hobbies, or seasonal items, while included appliances add convenience and value from day one. Located just minutes from local shopping, dining, and schools, this home also offers close proximity to the historic San Antonio Missions National Historical Park, giving you easy access to one of the city's most treasured landmarks. With its great location, spacious interior, and endless potential, this is an opportunity you don't want to miss! *All Room Measurements to be Verified by Buyer*
Key facts
- Included appliances
- 7,143 sq ft lot
- Garage
Tags
Neighborhood map
What this means for you Summary
Snapshot
- This is a 3-bed/1.0-bath single-family listed at $145k.
Deal economics
- At list price, monthly cash flow is $-165 ($-2k/yr) — negative.
- To cash-flow at today's rent, offer at most $116k (20.1% below list).
- To meet the 1% rule (rent ≥ 1% of price), the offer needs to be $122k (15.9% below list).
- Recommended offer: $116k (20.1% below list) — sets the bar for cash-flow.
- Cap rate 4.9% vs local median 3.8% in San Antonio — meaningfully above typical; check what's discounted (condition, days-on-market, listing class) to confirm the premium yield is real.
Location & tenants
- Location reads 80/100 on livability (#31 in TX, #1,616 nationally) — a professional / high-income tenant draw. Strengths: amenities A+, commute A+, cost of living A+; Watch: crime F.
- Harlandale ISD (urban): math 20% / reading 27% proficiency, ranked #748 of 826 in TX (top 91%) — low school quality limits family demand, transient renter base, plan for 1-2y turnover; 66% free/reduced lunch — lower-income household profile, screen leases tightly.
- Zoned schools: Bellaire El (math 19% / reading 20%, grade F, #3,583 of 4,322 statewide, top 86%, 497 students, 91% FRL); Terrell Wells Middle (math 24% / reading 28%, grade F, #1,222 of 1,662 statewide, top 74%, 661 students, 88% FRL); Mccollum H S (math 31% / reading 31%, grade F, #1,077 of 1,632 statewide, top 66%, 1,494 students, 78% FRL) — zoned schools average 86% FRL vs 66% district-wide (20 pts higher); higher-poverty schools than district average — tighter screening recommended.
- Market conditions: Rents falling (-7.2%/yr); 389 active listings in the ZIP; 30 comparable units currently listed for rent nearby; rentals at typical pace (median 26d on market — plan ~3-4 weeks tenant-placement turnaround); 43% of comp listings sitting > 30 days — soft ceiling on asking rent; 8,308 units permitted in Bexar County in 2024 (2,506 in 5+ unit buildings).
Forward outlook
- In year one you build about $4k of equity ($1k loan paydown + $3k appreciation (2.0% local appreciation)).
- Bexar County population projected at +50% by 2050 — long-run rental-demand tailwind backs the buy-and-hold thesis.
- By year 9, paydown + projected appreciation supports a ~$34k cash-out refi (75% LTV) — recoverable capital for the next deal without selling this one.
Negotiation context
- It's been on market 72 days — a 6% lower offer ($136k) is reasonable based on typical stale-listing flexibility.
Risks & watch-outs
- Watch-outs: property tax is 2.5% of price; built in 1956 — expect roof / HVAC / electrical / plumbing capex.
- Climate carrying-cost: severe wind risk, 80% chance of damaging wind over 30y; extreme-heat days projected 7→22/yr by 2055 (HVAC capex compounding) — expect insurance premiums to compound above CPI over the hold.
Questions for the listing agent
- What do current leases actually rent for vs. the listed asking? Can we see a recent rent roll and the last 12 months of T-12 income?
- It's been on market 72 days. Have you received any prior offers? Is the seller open to a 20% concession, seller financing, or rate buy-down credit?
- Built in 1956 — when were the roof, HVAC, electrical panel, plumbing, and water heater last replaced?
- Property tax is high relative to price — has the assessment been appealed recently, and will the sale trigger a re-assessment?
- Why hasn't it sold? Are there any deal-killer items the seller is aware of (foundation, flood, title, zoning, code violations)?
- Is there a deadline driving the sale (1031 exchange, divorce, estate, relocation)? That informs how much negotiation room exists.
- Crime grade is F in this area — have there been break-ins, vandalism, or insurance claims at this property in the last 3 years? What carrier currently insures it and at what premium?
- The area grade is low — what's the realistic commute time and amenity access for the typical tenant pool here? Any planned neighborhood developments (good or bad) we should know about?
- What's the average days-on-market for RENTAL listings here right now (not sales)? A rising rental-DOM trend means longer vacancies and softer asking-rent achievability than the comps imply.
- What's the recent tenant-quality profile in this submarket — average credit score on applications, eviction rate, late-payment / NSF rate, and stable-employment percentage? A property-management company in the area should have these aggregated.
- How much new for-sale + rental construction is in the pipeline within 1–3 miles? Heavy new supply typically softens prices + rents 12–24 months out; constrained supply supports both.
Investment metrics
- 1% rule
- 0.84% ✗
- Cap rate
- 4.93%
- Cash-on-cash
- -4.88%
- DSCR
- 0.78
- GRM
- 9.9
CMA / ARV
- ARV (median comp)
- $176,308
- List price
- $144,999
- Delta
- -17.76%
- Verdict
- UNDERPRICED
- Comps
- 20 within 1.0 mi
Show comp detail 12 sales within ~0.75 mi
| Address | Dist | Beds/Ba | Sqft | Sold | Price | $/sf | Match |
|---|---|---|---|---|---|---|---|
| 143 Langford | 0.30mi | 3/1.0 | 948 (-4%) | 2mo | $165,000 | $174 | 77 |
| 318 E Amber St | 0.26mi | 2/1.0 (-1) | 984 (-1%) | 7mo | $184,000 | $187 | 76 |
| 702 Deely Pl | 0.57mi | 3/1.0 | 993 (0%) | 6mo | $159,000 | $160 | 68 |
| 111 Langford Pl | 0.30mi | 3/1.0 | 936 (-6%) | 15mo | $117,000 | $125 | 64 |
| 239 Langford Pl | 0.36mi | 3/1.0 | 1,044 (+5%) | 16mo | $95,500 | $91 | 62 |
| 247 E Amber St | 0.24mi | 3/1.0 | 1,083 (+9%) | 16mo | $124,999 | $115 | 61 |
| 327 Kopplow | 0.06mi | 3/1.0 | 848 (-15%) | 18mo | $179,000 | $211 | 58 |
| 727 E Petaluma Blvd | 0.58mi | 3/2.0 | 988 (-0%) | 13mo | $172,000 | $174 | 57 |
| 9202 Agan | 0.74mi | 3/1.0 | 960 (-3%) | 11mo | $122,900 | $128 | 50 |
| 322 Creath Pl | 0.37mi | 3/2.0 | 1,108 (+12%) | 16mo | $154,900 | $140 | 46 |
| 835 Deely | 0.73mi | 3/1.0 | 884 (-11%) | 9mo | $160,000 | $181 | 40 |
| 519 Creath Pl | 0.63mi | 3/2.0 | 1,110 (+12%) | 12mo | $192,000 | $173 | 37 |
Match score weights: distance 35% · size 25% · config 20% · recency 20%. Top-matched comps best support the ARV.
Projected returns pro-forma
2.03% appreciation · 0.0% rent growth · sell at horizon
- IRR
- -1.8%
- Equity multiple
- 0.91×
- Total profit
- $-3,833
- Equity at exit
- $57,415
- IRR
- 1.2%
- Equity multiple
- 1.16×
- Total profit
- $6,511
- Equity at exit
- $82,850
Cash invested: $40,600 (down + closing). Projections, not guarantees.
Landlord ↔ Tenant lean methodology
- Overall (STATE)
- 87 Strongly Landlord-Friendly
- State Texas
- 87 Strongly Landlord-Friendly · R+5
- County
- — inherits STATE
- City
- — inherits STATE
ZIP-level market 78221
- Home prices YoY
- 0.8%
- Rents YoY
- -7.2%
- Active inventory
- 389
- Price-to-rent
- 9.9×
Monthly cashflow live
- Estimated rent
- $1,219 high interval (Pro) →
- Mortgage (P&I)
- −$760
- Tax from tax record
- −$307 /mo · $3,685/yr
- Insurance
- −$60
- HOA
- −$0
- Vacancy / Maint / Mgmt
- −$256
- Net cashflow
- $-165
Break-even live
Sensitivity live
| Price | -10% $-83 | -5% $-124 | +0% $-165 | +5% $-206 | +10% $-247 |
|---|---|---|---|---|---|
| Rent | -10% $-261 | -5% $-213 | +0% $-165 | +5% $-117 | +10% $-69 |
| Rate | -1.0pp $-92 | -0.5pp $-128 | base $-165 | +0.5pp $-203 | +1.0pp $-241 |
UW: 25.0% down · 7.5% · 30yr · 1.5% tax · 5.0% vac · 8.0% maint · 8.0% mgmt
Financing live
Cash to close
- Down payment
- $36,250
- Closing costs
- $4,350
- Reserves months
- —
- Total cash needed
- —
Loan-product check · same deal, 3 products live
Conventional
25% down · 7.5% · 30yr
- Down + closing
- —
- Monthly P&I
- —
- Monthly cashflow
- —
- DSCR
- —
- Eligible?
- —
Personal DTI + credit; lowest rate.
DSCR
20% down · 8.5% · 30yr
- Down + closing
- —
- Monthly P&I
- —
- Monthly cashflow
- —
- DSCR
- —
- Eligible?
- —
No personal income docs; deal must DSCR.
Hard money
10% down · 12.0% · 12mo
- Down + closing
- —
- Monthly P&I
- —
- Monthly cashflow
- —
- DSCR
- —
- Eligible?
- —
Short-term bridge; refi at stabilization.
Rent comps 30 comps
| Address | Beds | Baths | Sqft | Rent | $/sqft | DOM | Units | Dist |
|---|---|---|---|---|---|---|---|---|
| 3718 Pleasanton Rd Unit 202 San Antonio, TX | 3.0 | 1.0 | 950 | $1,295 | $1.36 | 25d | 1 | 0.28mi |
| 3718 Pleasanton Rd Unit 103 San Antonio, TX | 2.0 | 1.0 | 850 | $995 | $1.17 | 25d | 1 | 0.28mi |
| 351 E Amber St San Antonio, TX | 3.0 | 1.0 | 966 | $1,390 | $1.44 | 45d | 1 | 0.36mi |
| 138 Ware Blvd Unit 1201 San Antonio, TX | 2.0 | 1.0 | 645 | $900 | $1.40 | 45d | 1 | 0.57mi |
| 138 Ware Blvd Unit 1208 San Antonio, TX | 2.0 | 1.0 | 645 | $900 | $1.40 | 22d | 1 | 0.57mi |
| 138 Ware Blvd Unit 1105 San Antonio, TX | 2.0 | 1.5 | 768 | $950 | $1.24 | 21d | 1 | 0.57mi |
| 351 Ware Blvd San Antonio, TX | 2.0 | 2.0 | 875 | $1,450 | $1.66 | 45d | 1 | 0.57mi |
| 114 Dorsey St Unit 3 San Antonio, TX | 2.0 | 1.0 | 1000 | $1,150 | $1.15 | 45d | 1 | 0.58mi |
| 1400 Clamp Ave Unit 101 San Antonio, TX | 2.0 | 1.0 | 750 | $950 | $1.27 | 45d | 1 | 0.59mi |
| 1400 Clamp Ave San Antonio, TX | 2.0 | 1.0 | 750 | $900 | $1.20 | 45d | 1 | 0.59mi |
| 238 W Vestal Pl San Antonio, TX | 2.0 | 1.0 | 750 | $975 | $1.30 | 25d | 1 | 0.62mi |
| 906 E Petaluma Blvd San Antonio, TX | 3.0 | 2.0 | 936 | $1,450 | $1.55 | 18d | 1 | 0.76mi |
| 8237 S Flores St San Antonio, TX | 2.0 | 1.0 | 837 | $989 | $1.18 | 45d | 1 | 0.79mi |
| 8237 S Flores St Unit 710 San Antonio, TX | 2.0 | 2.0 | 910 | $1,024 | $1.13 | 0d | 1 | 0.80mi |
| 8237 S Flores St Unit 1116 San Antonio, TX | 2.0 | 2.0 | 910 | $1,149 | $1.26 | 45d | 1 | 0.80mi |
| 8237 S Flores St Unit 615 San Antonio, TX | 2.0 | 2.0 | 910 | $915 | $1.01 | 16d | 1 | 0.80mi |
| 535 W Hutchins Pl San Antonio, TX | 1.0–2.0 | 1.0 | 650 | $935 | $1.44 | 45d | 6 | 0.83mi |
| 8503 S Flores St San Antonio, TX | 2.0 | 1.0 | 785 | $1,125 | $1.43 | 6d | 1 | 0.89mi |
| 218 E Villaret Blvd San Antonio, TX | 2.0 | 1.0 | 861 | $1,295 | $1.50 | 14d | 1 | 1.09mi |
| 144 E Villaret Blvd Unit 116 San Antonio, TX | 2.0 | 1.0 | 800 | $1,025 | $1.28 | 25d | 1 | 1.10mi |
| 144 E Villaret Blvd Unit 142 San Antonio, TX | 2.0 | 1.0 | 800 | $995 | $1.24 | 16d | 1 | 1.10mi |
| 144 E Villaret Blvd Unit 148 San Antonio, TX | 2.0 | 1.0 | 800 | $995 | $1.24 | 23d | 1 | 1.10mi |
| 144 E Villaret Blvd Unit 156 San Antonio, TX | 2.0 | 1.0 | 800 | $995 | $1.24 | 25d | 1 | 1.10mi |
| 144 E Villaret Blvd Unit 106 San Antonio, TX | 2.0 | 1.0 | 800 | $995 | $1.24 | 45d | 1 | 1.10mi |
| 218 W Villaret Blvd San Antonio, TX | 2.0 | 1.0 | 864 | $1,295 | $1.50 | 16d | 1 | 1.15mi |
| 830 W Hutchins Pl #3 San Antonio, TX | 2.0 | 1.0 | 800 | $800 | $1.00 | 45d | 1 | 1.16mi |
| 830 W Hutchins Pl #11 San Antonio, TX | 3.0 | 1.0 | 800 | $1,000 | $1.25 | 45d | 1 | 1.16mi |
| 820 Durr Rd San Antonio, TX | 2.0 | 1.0 | 860 | $1,180 | $1.37 | 14d | 1 | 1.24mi |
| 247 W Dickson Ave San Antonio, TX | 1.0–2.0 | 1.0–2.0 | 758 | $1,358 | $1.79 | 0d | 33 | 1.30mi |
| 642 Gillette Blvd San Antonio, TX | 3.0 | 1.0 | 987 | $975 | $0.99 | 45d | 1 | 1.39mi |
Listing history 16 events
-
2026-06-21statusdays on market $144,999 Pending 72 DOM
-
2026-06-18days on market $144,999 Back on Market 70 DOM
-
2026-06-17days on market $144,999 Back on Market 69 DOM
-
2026-06-16days on market $144,999 Back on Market 68 DOM
-
2026-06-15days on market $144,999 Back on Market 67 DOM
-
2026-06-13days on market $144,999 Back on Market 65 DOM
-
2026-06-13days on market $144,999 Back on Market 64 DOM
-
2026-06-09days on market $144,999 Back on Market 61 DOM
-
2026-06-08statusdays on market $144,999 Back on Market 60 DOM
-
2026-06-07days on market $144,999 Active Option 59 DOM
-
2026-06-04days on market $144,999 Active Option 56 DOM
-
2026-06-03days on market $144,999 Active Option 55 DOM
-
2026-06-02days on market $144,999 Active Option 54 DOM
-
2026-06-01days on market $144,999 Active Option 53 DOM
-
2026-05-31days on market $144,999 Active Option 52 DOM
-
2026-04-09$144,999 New 1151-char remark
Show marketing remark (1151 chars)
Discover the charm and potential of this inviting 3-bedroom, 1-bath home nestled in the heart of the Harlandale community! This move-in ready property features spacious bedrooms and a comfortable layout designed for everyday living. Whether you're a first-time buyer or looking for your next investment, this home offers the perfect balance of livability and opportunity, allowing you to move right in while still having the freedom to make it your own over time. Step outside to enjoy a generously sized yard, ideal for relaxing evenings, entertaining guests, or creating your own outdoor retreat. Additional storage sheds provide extra space for tools, hobbies, or seasonal items, while included appliances add convenience and value from day one. Located just minutes from local shopping, dining, and schools, this home also offers close proximity to the historic San Antonio Missions National Historical Park, giving you easy access to one of the city's most treasured landmarks. With its great location, spacious interior, and endless potential, this is an opportunity you don't want to miss! *All Room Measurements to be Verified by Buyer*
ⓘ Source: listings_history table (triggers on properties + properties_extension) + one-shot
backfill from property_details.listing_events for pre-trigger history.
Tax reassessment forecast TX · Resets to sale price
- Current annual tax
- $3,685 · $307/mo
- Projected year-2 tax
- $3,685 · $307/mo
- Expected delta
- $0/yr ($0/mo · 0.0%)
ⓘ Screening estimate from a state-policy table — verify with the county assessor before closing.
Climate risk First Street
- Flood 1/10 Low FEMA zone X (unshaded) · 0% chance over 30 yrs
- Wildfire 2/10 Low
- Heat 8/10 Severe 7 d/yr ≥109°F today · 22 d/yr by 30 yrs out
- Wind 8/10 Severe 80% chance of damaging wind over 30 yrs
- Air quality 2/10 Low 0 unhealthy d/yr today · 1 by 30 yrs out
Nearby sold comps map
Loading sold comps map…
Walkable amenities ~0.75 mi
Loading nearby amenities…
Taxation est. · year 1
- Rental income
- $14,626
- − Mortgage interest
- −$8,122
- − Property taxes
- −$3,685
- − Insurance
- −$725
- − Repairs & maintenance
- −$1,170
- − Management
- −$1,170
- − Depreciation
- −$4,218
- Taxable loss
- −$4,464
- Est. tax savings @ 24.0%
- +$1,071
- After-tax cash flow
- $-908/yr
For passive investors: Depreciation is non-cash, so a rental often shows a tax loss while cash-flowing — sheltering income. Rental losses are passive: they offset passive income freely, and up to $25,000/yr can offset ordinary (W-2) income if you actively participate and your MAGI is under $100k (phasing out to $0 by $150k); unused losses carry forward. On sale, claimed depreciation is recaptured at up to 25%, and gains may owe capital-gains tax (a 1031 exchange can defer both). Figures are a year-1 estimate at your 24.0% rate — not tax advice; consult a CPA.
Schools (NCES district)
- District
- Harlandale ISD
- NCES district ID
- 4822470
- Math proficiency
- 20% ▼ -22.00%
- Reading proficiency
- 27% ▼ -9.00%
- Median HH income
- $33,850
- Composite
- 19.25/100
- National rank
- #8806
- State rank
- #748 of 826 in TX
Livability — San Antonio
- Score
- 80/100
- State rank
- #31
- US rank
- #1616
Category grades
Schools grade is shown separately in the Schools card above.
Census & demographics
- Census place
- San Antonio, TX
- County
- Bexar County · 1,990,555 people
- City population
- 1,806,925
- Metro
- San Antonio-New Braunfels, TX
- Population (ZIP)
- 42,178
- Household income
- $63,811
- Rent vs Own
- Severe rent burden
- 1180.0
Population outlook (Bexar County) Hauer SSP2
- Today (2025)
- 2,336,851 people
- By 2030
- 2,560,728 · +9.6%
- By 2040
- 3,020,569 · +29.3%
- By 2050
- 3,493,522 · +49.5%
- By 2075
- 4,668,459 · +99.8%
- By 2100
- 5,533,242 · +136.8%
Race, ethnicity, and origin ACS 2023
- Neighborhood character
- Predominantly Hispanic (89%)
- Race & ethnicity
- Hispanic / Latino 89% Two or more races 28% White 9% Native American 2%
- Hispanic origin (detail)
- Mexican 74%
- Common ancestry
- Lithuanian 1% Romanian 1%
- Foreign-born
- 16% · Canada
- Languages at home
- 45% English-only · Spanish 54%
Political lean MEDSL · Bexar
- 2024 margin
- Lean D (+9.8) · D 54.3% · R 44.6% · Other 1.1%
- 2008→2024 swing
- +4.2pp toward D · 2008: 5.6pp · 2024: 9.8pp
- All cycles
- 2024: D+9.8 2020: D+18.2 2016: D+13.5 2012: D+4.6 2008: D+5.6
Not yet ingested
- Civics
- —
Market trends
- HPI YoY
- ▲ 2.03%
- Current HPI
- 251.1635
- Rent YoY
- ▼ -7.21%
- Metro
- San Antonio-New Braunfels, TX
- State GDP YoY
- ▲ 3.95%
- F500 in state
- 110
Industry mix (Fortune 500 HQ in TX)
| Industry | F500 HQs | Revenue |
|---|---|---|
| Energy | 16 | $1,198B |
|
||
| Technology | 5 | $198B |
|
||
| Engineering / Construction | 4 | $72B |
|
||
| Energy Services | 3 | $60B |
|
||
| Utilities | 3 | $41B |
|
||
| Healthcare | 2 | $330B |
|
||
Price history
1 event — show timeline
- 2026-04-09 Listed $144,999 LERA
Property tax history
+5.6%/yrLatest (2025): $3,685 · -0.1% YoY. Source: county tax records.
Cash-flow waterfall
monthlySold comps — $/sqft
last 12 mo · ≤1 miLoading sold comps…