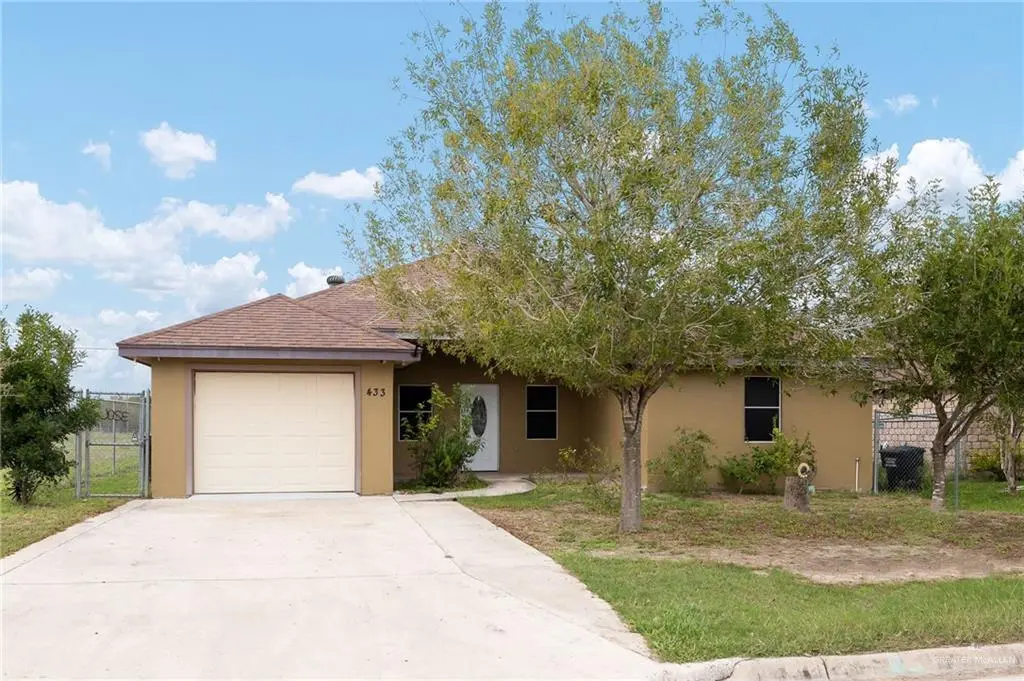
433 S Bowie St · Elsa, TX
Flood risk 4/10 · Minor
- FEMA flood zone
- X
- Chance of flooding over 30 yrs
- 0.22%
- Est. flood insurance / yr
- $507 – $1,088
Fire risk 3/10 · Minor
- Est. fire insurance / yr
- $1,222 – $2,270
Heat risk 9/10 · Severe
- Hot days now (above 111°F)
- 7 days/yr
- Hot days in 30 yrs
- 24 days/yr
Wind risk 8/10 · Major
- Chance of severe wind over 30 yrs
- 99.0%
Air-quality risk 1/10 · Minimal
- Unhealthy air days now
- 0 days/yr
- Unhealthy air days in 30 yrs
- 0 days/yr
Risk factors via First Street. Map © Google.
Why this score? — see what drove the D grade
The composite is a weighted blend of 9 inputs, each scored 0–100. Each bar is that input's sub-score; the figure is the points it added to the 100-point composite (weight × sub-score).
- ARV discount +15.0/15.0
- Appreciation +7.4/10.0
- Cash flow +6.9/30.0
- Livability +3.3/5.0
- Rent growth +2.5/5.0
- Condition / age +2.5/5.0
- 1% rule +1.8/10.0
- DSCR +1.1/10.0
- Schools +1.1/10.0
$220,000
🖨 Deal sheet (PDF) 📄 Offer letter ✓ Due diligence
Listing remarks MLS
Welcome to your next home—an inviting 3-bedroom, 2-bath gem tucked away in a quiet, peaceful neighborhood! The home features three comfortable bedrooms and two well-kept bathrooms, making it ideal for families, first-time buyers, or anyone seeking a relaxed lifestyle. The peaceful surroundings and low-traffic street make this property feel like a retreat, while still being close to everything you need. Just minutes away, you’ll find major conveniences such as H-E-B, Walmart, IDEA Public Schools, CVS, AutoZone, and popular dining options—giving you the perfect blend of privacy and accessibility. Whether you’re starting a new chapter or looking for a quiet place to call home, this property offers comfort, value, and a welcoming atmosphere from the moment you arrive. Come see why this home is the perfect fit for you!
Key facts
- 7,980 sq ft lot
- Garage
- Built 2013
Neighborhood map
What this means for you Summary
Snapshot
- This is a 3-bed/2.0-bath single-family listed at $220k.
Deal economics
- At list price, monthly cash flow is $-335 ($-4k/yr) — negative.
- To cash-flow at today's rent, offer at most $171k (22.1% below list).
- To meet the 1% rule (rent ≥ 1% of price), the offer needs to be $150k (31.8% below list).
- Recommended offer: $150k (31.8% below list) — sets the bar for 1% rule.
Location & tenants
- Location reads 66/100 on livability (#648 in TX) — a middle-class / working-renter tenant base. Strengths: cost of living A+, housing A+, health & safety A+; Watch: crime D, employment D, amenities F.
- Edcouch-Elsa ISD (suburban): math 9% / reading 20% proficiency, ranked #822 of 826 in TX (top 100%) — low school quality limits family demand, transient renter base, plan for 1-2y turnover; 74% free/reduced lunch — lower-income household profile, screen leases tightly.
- Zoned schools: L B J El (math 17% / reading 22%, grade F, #3,583 of 4,322 statewide, top 86%, 472 students, 93% FRL); Carlos Truan J H (math 8% / reading 22%, grade F, #1,579 of 1,662 statewide, top 95%, 622 students, 93% FRL); Edcouch-Elsa H S (math 7% / reading 25%, grade F, #1,501 of 1,632 statewide, top 92%, 1,345 students, 94% FRL) — zoned schools average 94% FRL vs 74% district-wide (20 pts higher); higher-poverty schools than district average — tighter screening recommended.
- Market conditions: 41 active listings in the ZIP; 1 comparable units currently listed for rent nearby; 7,378 units permitted in Hidalgo County in 2024 (641 in 5+ unit buildings).
Forward outlook
- In year one you build about $12k of equity ($2k loan paydown + $10k appreciation (4.8% local appreciation)).
- Hidalgo County population projected at +28% by 2050 — long-run rental-demand tailwind backs the buy-and-hold thesis.
- By year 4, paydown + projected appreciation supports a ~$41k cash-out refi (75% LTV) — recoverable capital for the next deal without selling this one.
Negotiation context
- It's been on market 194 days — a 12% lower offer ($194k) is reasonable based on typical stale-listing flexibility.
Risks & watch-outs
- Climate carrying-cost: severe wind risk, 99% chance of damaging wind over 30y; extreme-heat days projected 7→24/yr by 2055 (HVAC capex compounding) — expect insurance premiums to compound above CPI over the hold.
Questions for the listing agent
- What do current leases actually rent for vs. the listed asking? Can we see a recent rent roll and the last 12 months of T-12 income?
- It's been on market 194 days. Have you received any prior offers? Is the seller open to a 32% concession, seller financing, or rate buy-down credit?
- Why hasn't it sold? Are there any deal-killer items the seller is aware of (foundation, flood, title, zoning, code violations)?
- Is there a deadline driving the sale (1031 exchange, divorce, estate, relocation)? That informs how much negotiation room exists.
- Schools are F-rated, which usually means shorter tenancies and higher turnover. Who's the typical renter profile here, and what's been the actual vacancy rate?
- Crime grade is D in this area — have there been break-ins, vandalism, or insurance claims at this property in the last 3 years? What carrier currently insures it and at what premium?
- The area grade is low — what's the realistic commute time and amenity access for the typical tenant pool here? Any planned neighborhood developments (good or bad) we should know about?
- What's the average days-on-market for RENTAL listings here right now (not sales)? A rising rental-DOM trend means longer vacancies and softer asking-rent achievability than the comps imply.
- What's the recent tenant-quality profile in this submarket — average credit score on applications, eviction rate, late-payment / NSF rate, and stable-employment percentage? A property-management company in the area should have these aggregated.
- How much new for-sale + rental construction is in the pipeline within 1–3 miles? Heavy new supply typically softens prices + rents 12–24 months out; constrained supply supports both.
Investment metrics
- 1% rule
- 0.68% ✗
- Cap rate
- 4.46%
- Cash-on-cash
- -6.53%
- DSCR
- 0.71
- GRM
- 12.2
CMA / ARV
- ARV (median comp)
- $267,925
- List price
- $220,000
- Delta
- -17.89%
- Verdict
- UNDERPRICED
- Comps
- 20 within 1.0 mi
Show comp detail 4 sales within ~0.75 mi
| Address | Dist | Beds/Ba | Sqft | Sold | Price | $/sf | Match |
|---|---|---|---|---|---|---|---|
| 206 E Ricky Crossland Ave | 0.58mi | 3/2.0 | 2,219 (+8%) | 7mo | $187,000 | $84 | 54 |
| 17610 W Campana Ln | 0.48mi | 3/2.0 | 1,905 (-7%) | 21mo | $280,000 | $147 | 48 |
| 8609 Campana Dr | 0.66mi | 3/2.5 | 1,900 (-8%) | 14mo | $344,500 | $181 | 43 |
| 8510 G M Dr | 0.53mi | 4/3.0 (+1) | 2,344 (+14%) | 6mo | $360,000 | $154 | 38 |
Match score weights: distance 35% · size 25% · config 20% · recency 20%. Top-matched comps best support the ARV.
Projected returns pro-forma
4.77% appreciation · 3.0% rent growth · sell at horizon
- IRR
- 6.8%
- Equity multiple
- 1.43×
- Total profit
- $26,514
- Equity at exit
- $121,633
- IRR
- 8.9%
- Equity multiple
- 2.62×
- Total profit
- $100,090
- Equity at exit
- $207,453
Cash invested: $61,600 (down + closing). Projections, not guarantees.
Landlord ↔ Tenant lean methodology
- Overall (STATE)
- 87 Strongly Landlord-Friendly
- State Texas
- 87 Strongly Landlord-Friendly · R+5
- County
- — inherits STATE
- City
- — inherits STATE
ZIP-level market 78543
- Home prices YoY
- 1.9%
- Active inventory
- 41
- Price-to-rent
- 12.2×
Monthly cashflow live
- Estimated rent
- $1,500 medium interval (Pro) →
- Mortgage (P&I)
- −$1,154
- Tax est. 1.5%
- −$275 /mo · $3,300/yr
- Insurance
- −$92
- HOA
- −$0
- Vacancy / Maint / Mgmt
- −$315
- Net cashflow
- $-335
Break-even live
Sensitivity live
| Price | -10% $-183 | -5% $-259 | +0% $-335 | +5% $-411 | +10% $-487 |
|---|---|---|---|---|---|
| Rent | -10% $-454 | -5% $-395 | +0% $-335 | +5% $-276 | +10% $-217 |
| Rate | -1.0pp $-225 | -0.5pp $-279 | base $-335 | +0.5pp $-392 | +1.0pp $-450 |
UW: 25.0% down · 7.5% · 30yr · 1.5% tax · 5.0% vac · 8.0% maint · 8.0% mgmt
Financing live
Cash to close
- Down payment
- $55,000
- Closing costs
- $6,600
- Reserves months
- —
- Total cash needed
- —
Loan-product check · same deal, 3 products live
Conventional
25% down · 7.5% · 30yr
- Down + closing
- —
- Monthly P&I
- —
- Monthly cashflow
- —
- DSCR
- —
- Eligible?
- —
Personal DTI + credit; lowest rate.
DSCR
20% down · 8.5% · 30yr
- Down + closing
- —
- Monthly P&I
- —
- Monthly cashflow
- —
- DSCR
- —
- Eligible?
- —
No personal income docs; deal must DSCR.
Hard money
10% down · 12.0% · 12mo
- Down + closing
- —
- Monthly P&I
- —
- Monthly cashflow
- —
- DSCR
- —
- Eligible?
- —
Short-term bridge; refi at stabilization.
Rent comps 1 comps
| Address | Beds | Baths | Sqft | Rent | $/sqft | DOM | Units | Dist |
|---|---|---|---|---|---|---|---|---|
| 415 Edinburg Ave #107 Elsa, TX | 3.0 | 1.0 | 1800 | $1,500 | $0.83 | 45d | 1 | 0.48mi |
Listing history 17 events
-
2026-06-21days on market $220,000 Active 194 DOM
-
2026-06-21days on market $220,000 Active 193 DOM
-
2026-06-18days on market $220,000 Active 191 DOM
-
2026-06-17days on market $220,000 Active 190 DOM
-
2026-06-16days on market $220,000 Active 189 DOM
-
2026-06-15days on market $220,000 Active 188 DOM
-
2026-06-13days on market $220,000 Active 186 DOM
-
2026-06-12days on market $220,000 Active 185 DOM
-
2026-06-09days on market $220,000 Active 182 DOM
-
2026-06-08days on market $220,000 Active 181 DOM
-
2026-06-08days on market $220,000 Active 180 DOM
-
2026-06-07days on market $220,000 Active 179 DOM
-
2026-06-03days on market $220,000 Active 176 DOM
-
2026-06-02days on market $220,000 Active 175 DOM
-
2026-06-01days on market $220,000 Active 174 DOM
-
2026-05-31days on market $220,000 Active 173 DOM
-
2025-12-09$220,000 Active 849-char remark
Show marketing remark (849 chars)
Welcome to your next home—an inviting 3-bedroom, 2-bath gem tucked away in a quiet, peaceful neighborhood! The home features three comfortable bedrooms and two well-kept bathrooms, making it ideal for families, first-time buyers, or anyone seeking a relaxed lifestyle. The peaceful surroundings and low-traffic street make this property feel like a retreat, while still being close to everything you need. Just minutes away, you’ll find major conveniences such as H-E-B, Walmart, IDEA Public Schools, CVS, AutoZone, and popular dining options—giving you the perfect blend of privacy and accessibility. Whether you’re starting a new chapter or looking for a quiet place to call home, this property offers comfort, value, and a welcoming atmosphere from the moment you arrive. Come see why this home is the perfect fit for you!
ⓘ Source: listings_history table (triggers on properties + properties_extension) + one-shot
backfill from property_details.listing_events for pre-trigger history.
Climate risk First Street
- Flood 4/10 Moderate FEMA zone X · 22% chance over 30 yrs
- Wildfire 3/10 Moderate
- Heat 9/10 Extreme 7 d/yr ≥111°F today · 24 d/yr by 30 yrs out
- Wind 8/10 Severe 99% chance of damaging wind over 30 yrs
- Air quality 1/10 Low 0 unhealthy d/yr today · 0 by 30 yrs out
Nearby sold comps map
Loading sold comps map…
Walkable amenities ~0.75 mi
Loading nearby amenities…
Taxation est. · year 1
- Rental income
- $18,000
- − Mortgage interest
- −$12,323
- − Property taxes
- −$3,300
- − Insurance
- −$1,100
- − Repairs & maintenance
- −$1,440
- − Management
- −$1,440
- − Depreciation
- −$6,400
- Taxable loss
- −$8,003
- Est. tax savings @ 24.0%
- +$1,921
- After-tax cash flow
- $-2,104/yr
For passive investors: Depreciation is non-cash, so a rental often shows a tax loss while cash-flowing — sheltering income. Rental losses are passive: they offset passive income freely, and up to $25,000/yr can offset ordinary (W-2) income if you actively participate and your MAGI is under $100k (phasing out to $0 by $150k); unused losses carry forward. On sale, claimed depreciation is recaptured at up to 25%, and gains may owe capital-gains tax (a 1031 exchange can defer both). Figures are a year-1 estimate at your 24.0% rate — not tax advice; consult a CPA.
Schools (NCES district)
- District
- Edcouch-Elsa ISD
- NCES district ID
- 4818060
- Math proficiency
- 9% ▼ -27.00%
- Reading proficiency
- 20% ▼ -13.00%
- Median HH income
- $25,724
- Composite
- 10.99/100
- National rank
- #9744
- State rank
- #822 of 826 in TX
Livability — Elsa
- Score
- 66/100
- State rank
- #648
- US rank
- #12248
Category grades
Schools grade is shown separately in the Schools card above.
Census & demographics
- Census place
- Elsa, TX
- City population
- 8,608
- Population (ZIP)
- 8,608
Population outlook (Hidalgo County) Hauer SSP2
- Today (2025)
- 955,232 people
- By 2030
- 1,009,774 · +5.7%
- By 2040
- 1,120,332 · +17.3%
- By 2050
- 1,225,036 · +28.2%
- By 2075
- 1,439,189 · +50.7%
- By 2100
- 1,533,429 · +60.5%
Race, ethnicity, and origin ACS 2023
- Neighborhood character
- Predominantly Hispanic (98%)
- Race & ethnicity
- Hispanic / Latino 98% Two or more races 56% White 2%
- Hispanic origin (detail)
- Mexican 96%
- Foreign-born
- 15% · Canada
- Languages at home
- 19% English-only · Spanish 81%
Political lean MEDSL · Hidalgo
- 2024 margin
- Toss-up / Even · D 48.1% · R 51.0%
- 2008→2024 swing
- -41.6pp toward R · 2008: 38.7pp · 2024: -2.9pp
- All cycles
- 2024: R+2.9 2020: D+17.1 2016: D+40.5 2012: D+41.8 2008: D+38.7
Not yet ingested
- Civics
- —
Market trends
- HPI YoY
- ▲ 4.77%
- Current HPI
- 250.7357
- Rent YoY
- —
- Metro
- —
- State GDP YoY
- ▲ 3.95%
- F500 in state
- 110
Industry mix (Fortune 500 HQ in TX)
| Industry | F500 HQs | Revenue |
|---|---|---|
| Energy | 16 | $1,198B |
|
||
| Technology | 5 | $198B |
|
||
| Engineering / Construction | 4 | $72B |
|
||
| Energy Services | 3 | $60B |
|
||
| Utilities | 3 | $41B |
|
||
| Healthcare | 2 | $330B |
|
||
Price history
1 event — show timeline
- 2025-12-09 Listed $220,000 MCALLENMLS
Cash-flow waterfall
monthlySold comps — $/sqft
last 12 mo · ≤1 miLoading sold comps…