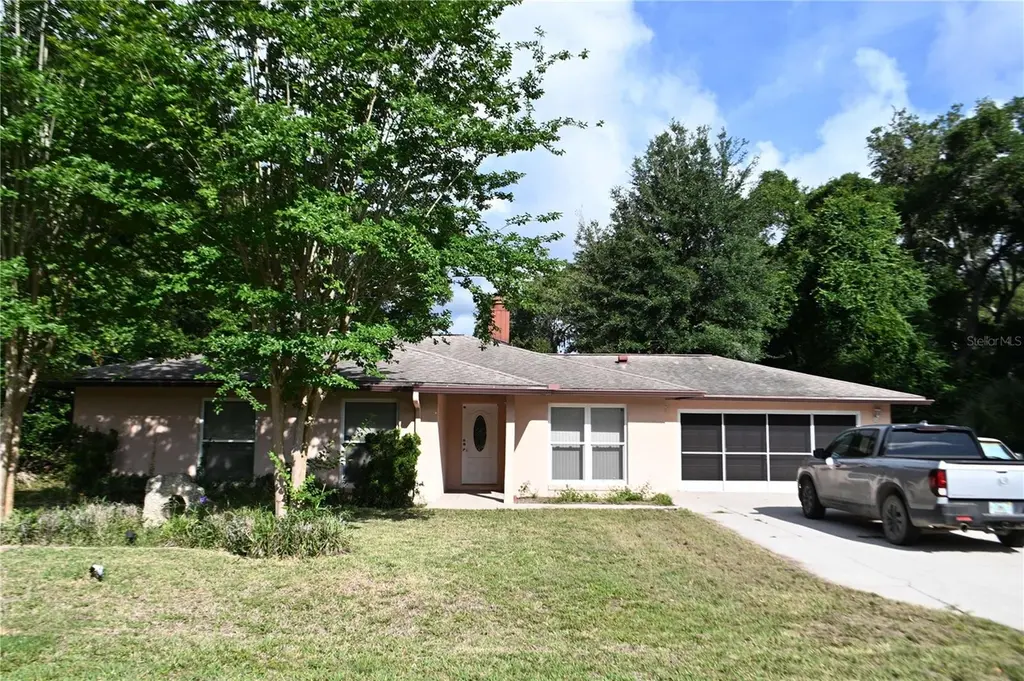
32 Fort Caroline Ln · Palm Coast, FL
Flood risk 5/10 · Moderate
- FEMA flood zone
- X (unshaded)
- Chance of flooding over 30 yrs
- 0.23%
- Est. flood insurance / yr
- $507 – $1,088
Fire risk 3/10 · Minor
- Est. fire insurance / yr
- $947 – $1,759
Heat risk 9/10 · Severe
- Hot days now (above 106°F)
- 7 days/yr
- Hot days in 30 yrs
- 21 days/yr
Wind risk 10/10 · Severe
- Chance of severe wind over 30 yrs
- 99.0%
Air-quality risk 2/10 · Minimal
- Unhealthy air days now
- 2 days/yr
- Unhealthy air days in 30 yrs
- 2 days/yr
Risk factors via First Street. Map © Google.
Why this score? — see what drove the C- grade
The composite is a weighted blend of 9 inputs, each scored 0–100. Each bar is that input's sub-score; the figure is the points it added to the 100-point composite (weight × sub-score).
- ARV discount +15.0/15.0
- Cash flow +14.0/30.0
- Schools +4.6/10.0
- DSCR +4.2/10.0
- 1% rule +3.9/10.0
- Livability +3.5/5.0
- Rent growth +2.7/5.0
- Condition / age +2.5/5.0
- Appreciation +0.0/10.0
$249,900
🖨 Deal sheet (PDF) 📄 Offer letter ✓ Due diligence
Listing remarks
Opportunity is Knocking! 3 bedroom, 2 bathroom, 2 car garage in the Palm Harbor subdivision of Palm Coast. This home needs some love, but that gives you the chance to make it your own. Laminate in formal dining, entry, halls, Kitchen, breakfast nook and carpet in the living room and bedrooms. Bathrooms have tile flooring. Property is an estate; furnishings can be negotiated whether it goes or stays. Hurry to check out this home. Perfectly situated near parks, shopping, schools, restaurants and entertainment. Let's not forget you would be within 15 minutes to the beautiful Atlantic Ocean. 30 minutes South to arrive at the world-famous Daytona Beach or 30 minutes North to the oldest city in A
Key facts
- Near schools
- Near shopping
- Near restaurants
Tags
Property features AI
Finance
- Other: Property type: Single Family Residence; Zoning: SFR2; Total acreage: between 1/4 and less than 1/2 acre
- HOA & community: No association; Development: Palm Harbor
Exterior
- Parking: Driveway; Attached 2-car garage
- Utilities: Public water; Public sewer; Cable available; Electricity connected; Sewer connected; Water connected
- Home design: Single-family residence; One story; Southeast facing; Residential property
- Construction: Block and stucco construction; Shingle roof; Slab foundation; Built on 0.27-acre lot
- Exterior features: Private mailbox; Paved lot
Interior
- Kitchen: Dishwasher; Range; Range hood; Tankless water heater
- Bedrooms: 3 bedrooms
- Flooring: Carpet; Ceramic tile
- Bathrooms: 2 full bathrooms
- Heating & cooling: Electric heating; Central air conditioning
- Interior features: Ceiling fans; Blinds
- Laundry & utility: Washer hookup; Electric dryer hookup; Laundry room inside
Neighborhood map
What this means for you Summary
Snapshot
- This is a 3-bed/2.0-bath single-family listed at $250k.
Deal economics
- At list price, monthly cash flow is $32 ($380/yr) — positive.
- The deal already cash-flows at list — no discount required.
- To meet the 1% rule (rent ≥ 1% of price), the offer needs to be $223k (10.9% below list).
- Recommended offer: $223k (10.9% below list) — sets the bar for 1% rule.
- Cap rate 6.4% vs local median 3.8% in Palm Coast — top-decile yield for the area; either an underpriced asset or a hidden risk that comps aren't pricing in. Stress-test before assuming the spread holds.
Location & tenants
- Location reads 69/100 on livability (#478 in FL) — a middle-class / working-renter tenant base. Strengths: housing A+, health & safety A+, cost of living B+; Watch: amenities F, commute F.
- Flagler (rural): math 53% / reading 56% proficiency, ranked #20 of 73 in FL (top 27%) — acceptable for families but not a draw, mixed tenant base, ~2y average lease.
- Zoned schools: Old Kings Elementary School (math 74% / reading 72%, grade A, #271 of 2,144 statewide, top 13%, 979 students, 52% FRL); Indian Trails Middle School (math 64% / reading 59%, grade B+, #124 of 571 statewide, top 22%, 1,518 students, 50% FRL); Matanzas High School (math 36% / reading 53%, grade F, #237 of 667 statewide, top 36%, 1,978 students, 48% FRL) — zoned schools at 50% FRL track the district average.
- Market conditions: Rents flat; 1616 active listings in the ZIP; 40 comparable units currently listed for rent nearby; rentals at typical pace (median 26d on market — plan ~3-4 weeks tenant-placement turnaround); solid renter incomes; 2,588 units permitted in Flagler County in 2024 (0 in 5+ unit buildings).
- This rent runs 32% of the median local income ($84k/yr) — at the standard rent-burdened threshold; future hikes will face affordability resistance.
Forward outlook
- Local home prices are declining (-3.0%/yr); year-one equity from $2k of loan paydown is wiped out by about $7k of value loss. Plan a longer hold.
- Flagler County population projected at +28% by 2050 — long-run rental-demand tailwind backs the buy-and-hold thesis.
Negotiation context
- It's been on market 33 days — a 3% lower offer ($242k) is reasonable based on typical stale-listing flexibility.
- Current owner paid $77k; list at $250k implies a 225% gain — meaningful room to come down on a strong offer.
Risks & watch-outs
- Climate carrying-cost: moderate flood risk; severe wind risk, 99% chance of damaging wind over 30y; extreme-heat days projected 7→21/yr by 2055 (HVAC capex compounding) — expect insurance premiums to compound above CPI over the hold.
Questions for the listing agent
- It's been on market 33 days. Have you received any prior offers? Is the seller open to a 11% concession, seller financing, or rate buy-down credit?
- Is there a deadline driving the sale (1031 exchange, divorce, estate, relocation)? That informs how much negotiation room exists.
- What's the average days-on-market for RENTAL listings here right now (not sales)? A rising rental-DOM trend means longer vacancies and softer asking-rent achievability than the comps imply.
- What's the recent tenant-quality profile in this submarket — average credit score on applications, eviction rate, late-payment / NSF rate, and stable-employment percentage? A property-management company in the area should have these aggregated.
- How much new for-sale + rental construction is in the pipeline within 1–3 miles? Heavy new supply typically softens prices + rents 12–24 months out; constrained supply supports both.
Investment metrics
- 1% rule
- 0.89% ✗
- Cap rate
- 6.45%
- Cash-on-cash
- 0.54%
- DSCR
- 1.02
- GRM
- 9.4
CMA / ARV
- ARV (on-the-fly)
- $388,080
- Comps found
- 12
Show comp detail 12 sales within ~0.75 mi
| Address | Dist | Beds/Ba | Sqft | Sold | Price | $/sf | Match |
|---|---|---|---|---|---|---|---|
| 62 Fort Caroline Ln | 0.12mi | 3/2.0 | 1,629 (+6%) | 1mo | $365,000 | $224 | 84 |
| 57 Folson Ln | 0.14mi | 3/2.0 | 1,412 (-8%) | 1mo | $265,000 | $188 | 78 |
| 7 Carry Ct | 0.37mi | 3/2.0 | 1,571 (+2%) | 3mo | $525,000 | $334 | 77 |
| 73 Fort Caroline Ln | 0.18mi | 2/2.0 (-1) | 1,356 (-12%) | 1mo | $265,000 | $195 | 66 |
| 52 Fleming Ct | 0.17mi | 3/2.0 | 1,309 (-15%) | 3mo | $500,000 | $382 | 64 |
| 77 Forsythe Ln | 0.40mi | 3/2.0 | 1,706 (+11%) | 1mo | $430,000 | $252 | 63 |
| 12 Ferris Ln | 0.44mi | 2/2.0 (-1) | 1,443 (-6%) | 3mo | $287,500 | $199 | 62 |
| 39 Flagler Pl | 0.62mi | 3/2.0 | 1,470 (-4%) | 2mo | $427,000 | $290 | 62 |
| 89 Foster Ln | 0.36mi | 2/2.0 (-1) | 1,378 (-10%) | 2mo | $265,000 | $192 | 59 |
| 2 Clarendon Ct S | 0.54mi | 2/2.0 (-1) | 1,426 (-7%) | 3mo | $380,000 | $266 | 55 |
| 7 Clarendon Ct S | 0.55mi | 3/2.0 | 1,766 (+15%) | 3mo | $610,000 | $345 | 48 |
| 78 Freeport Ln | 0.72mi | 3/2.0 | 1,311 (-15%) | 2mo | $220,000 | $168 | 40 |
Match score weights: distance 35% · size 25% · config 20% · recency 20%. Top-matched comps best support the ARV.
Projected returns pro-forma
-3.0% appreciation · 0.85% rent growth · sell at horizon
- IRR
- -17.9%
- Equity multiple
- 0.38×
- Total profit
- $-43,158
- Equity at exit
- $37,261
- IRR
- -14.8%
- Equity multiple
- 0.24×
- Total profit
- $-53,377
- Equity at exit
- $21,607
Cash invested: $69,972 (down + closing). Projections, not guarantees.
Landlord ↔ Tenant lean methodology
- Overall (STATE)
- 87 Strongly Landlord-Friendly
- State Florida
- 87 Strongly Landlord-Friendly · R+3
- County
- — inherits STATE
- City
- — inherits STATE
ZIP-level market 32137
- Home prices YoY
- -34.5%
- Rents YoY
- 0.8%
- Active inventory
- 1616
- Price-to-rent
- 9.4×
Monthly cashflow live
- Estimated rent
- $2,226 high interval (Pro) →
- Mortgage (P&I)
- −$1,311
- Tax est. 1.5%
- −$312 /mo · $3,748/yr
- Insurance
- −$104
- HOA
- −$0
- Vacancy / Maint / Mgmt
- −$467
- Net cashflow
- $32
Break-even live
Sensitivity live
| Price | -10% $204 | -5% $118 | +0% $32 | +5% $-55 | +10% $-141 |
|---|---|---|---|---|---|
| Rent | -10% $-144 | -5% $-56 | +0% $32 | +5% $120 | +10% $208 |
| Rate | -1.0pp $158 | -0.5pp $95 | base $32 | +0.5pp $-33 | +1.0pp $-99 |
UW: 25.0% down · 7.5% · 30yr · 1.5% tax · 5.0% vac · 8.0% maint · 8.0% mgmt
Financing live
Cash to close
- Down payment
- $62,475
- Closing costs
- $7,497
- Reserves months
- —
- Total cash needed
- —
Loan-product check · same deal, 3 products live
Conventional
25% down · 7.5% · 30yr
- Down + closing
- —
- Monthly P&I
- —
- Monthly cashflow
- —
- DSCR
- —
- Eligible?
- —
Personal DTI + credit; lowest rate.
DSCR
20% down · 8.5% · 30yr
- Down + closing
- —
- Monthly P&I
- —
- Monthly cashflow
- —
- DSCR
- —
- Eligible?
- —
No personal income docs; deal must DSCR.
Hard money
10% down · 12.0% · 12mo
- Down + closing
- —
- Monthly P&I
- —
- Monthly cashflow
- —
- DSCR
- —
- Eligible?
- —
Short-term bridge; refi at stabilization.
Rent comps 40 comps
| Address | Beds | Baths | Sqft | Rent | $/sqft | DOM | Units | Dist |
|---|---|---|---|---|---|---|---|---|
| 31 Folson Ln Palm Coast, FL | 3.0 | 1.0 | 1481 | $1,639 | $1.11 | 25d | 1 | 0.12mi |
| 57 Florida Park Dr Palm Coast, FL | 3.0 | 2.0 | 1966 | $2,500 | $1.27 | 16d | 1 | 0.23mi |
| 70 Forrester Pl Palm Coast, FL | 3.0 | 2.0 | 1700 | $2,000 | $1.18 | 4d | 1 | 0.25mi |
| 11 Ferris Ln Palm Coast, FL | 3.0 | 2.0 | 1500 | $2,800 | $1.87 | 4d | 1 | 0.42mi |
| 58 Club House Dr Palm Coast, FL | 2.0 | 1.5 | 1216 | $1,795 | $1.48 | 25d | 1 | 0.52mi |
| 20 Clarendon Ct N Palm Coast, FL | 3.0 | 2.0 | 1883 | $2,675 | $1.42 | 4d | 1 | 0.64mi |
| 15 Florida Park Dr #6 Palm Coast, FL | 2.0 | 1.5 | 1159 | $1,450 | $1.25 | 4d | 1 | 0.73mi |
| 24 Claridge Ct S Palm Coast, FL | 3.0 | 2.0 | 1817 | $3,600 | $1.98 | 25d | 1 | 0.80mi |
| 13 Freemont Ct Palm Coast, FL | 3.0 | 2.0 | 1637 | $2,300 | $1.41 | 4d | 1 | 0.80mi |
| 214 Coral Reef Ct N Unit B Palm Coast, FL | 4.0 | 2.0 | 1300 | $1,850 | $1.42 | 4d | 1 | 0.87mi |
| 27 Cooper Ln Palm Coast, FL | 3.0 | 2.0 | 1446 | $6,500 | $4.50 | 25d | 1 | 0.88mi |
| 87 Club House Dr Palm Coast, FL | 3.0 | 2.0 | 1265 | $2,500 | $1.98 | 25d | 1 | 0.90mi |
| 10 Cormorant Ct Palm Coast, FL | 3.0 | 2.0 | 1902 | $2,800 | $1.47 | 13d | 1 | 0.94mi |
| 27 Classic Ct S Palm Coast, FL | 3.0 | 2.0 | 2073 | $3,200 | $1.54 | 25d | 1 | 0.97mi |
| 16 Courtney Pl Palm Coast, FL | 2.0 | 2.0 | 1510 | $2,100 | $1.39 | 25d | 1 | 0.98mi |
| 13 Courtney Pl Palm Coast, FL | 2.0 | 2.0 | 1292 | $1,700 | $1.32 | 4d | 1 | 1.02mi |
| 42 Farmsworth Dr Unit A Palm Coast, FL | 3.0 | 2.0 | 1338 | $1,995 | $1.49 | 4d | 1 | 1.04mi |
| 14 Colechester Ln Palm Coast, FL | 3.0 | 2.0 | 2033 | $3,000 | $1.48 | 25d | 1 | 1.05mi |
| 1 Fanshawe Ln Unit 1B Palm Coast, FL | 3.0 | 2.5 | 2085 | $2,350 | $1.13 | 25d | 1 | 1.07mi |
| 1 Fanshawe Ln Palm Coast, FL | 3.0 | 2.5 | 2085 | $2,350 | $1.13 | 16d | 1 | 1.07mi |
| 179 Misty Harbor Trce Palm Coast, FL | 3.0 | 2.5 | 1941 | $2,300 | $1.18 | 16d | 1 | 1.08mi |
| 90a Farmsworth Dr Palm Coast, FL | 2.0 | 2.0 | 1125 | $1,400 | $1.24 | 4d | 1 | 1.08mi |
| 9 Collinson Ct Palm Coast, FL | 3.0 | 2.0 | 1276 | $2,250 | $1.76 | 4d | 1 | 1.13mi |
| 59 Fallen Oak Ln Unit 1261618P Palm Coast, FL | 3.0 | 3.0 | 1797 | $3,355 | $1.87 | 16d | 1 | 1.15mi |
| 2 Pinehurst Pl Palm Coast, FL | 2.0 | 2.0 | 1177 | $1,475 | $1.25 | 25d | 1 | 1.16mi |
| 2 Pinehurst Pl Palm Coast, FL | 2.0 | 2.0 | 1177 | $1,475 | $1.25 | 23d | 1 | 1.16mi |
| 2 Pinehurst Pl #2 Palm Coast, FL | 2.0 | 2.0 | 1177 | $1,575 | $1.34 | 25d | 1 | 1.16mi |
| 51 Blairsville Dr Palm Coast, FL | 2.0 | 2.0 | 1240 | $1,750 | $1.41 | 25d | 1 | 1.18mi |
| 14 Cedarview Ct Palm Coast, FL | 3.0 | 2.0 | 1462 | $2,200 | $1.50 | 25d | 1 | 1.18mi |
| 35 Captains Walk Palm Coast, FL | 3.0 | 2.5 | 1565 | $2,400 | $1.53 | 25d | 1 | 1.20mi |
| 3 Fairways Cir Unit 3 Palm Coast, FL | 2.0 | 2.0 | 1150 | $1,395 | $1.21 | 25d | 1 | 1.22mi |
| 15 Columbia Ln Unit A Palm Coast, FL | 3.0 | 2.0 | 1260 | $1,650 | $1.31 | 25d | 1 | 1.22mi |
| 21 Farnell Ln Unit B Palm Coast, FL | 3.0 | 2.0 | 1211 | $1,550 | $1.28 | 16d | 1 | 1.23mi |
| 7 Blairton Ct Palm Coast, FL | 2.0 | 2.0 | 1263 | $1,500 | $1.19 | 13d | 1 | 1.28mi |
| 36 Oxford Ln Palm Coast, FL | 2.0 | 2.0 | 1098 | $1,595 | $1.45 | 25d | 1 | 1.28mi |
| 13 Surrey Ct Palm Coast, FL | 3.0 | 2.0 | 1338 | $1,600 | $1.20 | 25d | 1 | 1.29mi |
| 101 Palm Harbor Pkwy Unit A404 Palm Coast, FL | 2.0 | 1.5 | 1600 | $1,700 | $1.06 | 25d | 1 | 1.29mi |
| 13 Surrey Ct #13 Palm Coast, FL | 3.0 | 2.0 | 1338 | $1,650 | $1.23 | 25d | 1 | 1.29mi |
| 115 Riverview Bnd S #2145 Palm Coast, FL | 3.0 | 2.0 | 1575 | $3,000 | $1.90 | 16d | 1 | 1.30mi |
| 115 Riverview Bnd S #2145 Palm Coast, FL | 3.0 | 2.0 | 1575 | $3,000 | $1.90 | 4d | 1 | 1.30mi |
Listing history 18 events
-
2026-06-21days on market $249,900 Active 33 DOM
-
2026-06-18days on market $249,900 Active 30 DOM
-
2026-06-17days on market $249,900 Active 29 DOM
-
2026-06-16days on market $249,900 Active 28 DOM
-
2026-06-15days on market $249,900 Active 27 DOM
-
2026-06-14days on market $249,900 Active 25 DOM
-
2026-06-13days on market $249,900 Active 24 DOM
-
2026-06-10days on market $249,900 Active 22 DOM
-
2026-06-09days on market $249,900 Active 21 DOM
-
2026-06-08days on market $249,900 Active 20 DOM
-
2026-06-07days on market $249,900 Active 19 DOM
-
2026-06-03days on market $249,900 Active 15 DOM
-
2026-06-02days on market $249,900 Active 14 DOM
-
2026-06-01days on market $249,900 Active 13 DOM
-
2026-05-31days on market $249,900 Active 12 DOM
-
2026-05-20$249,900 Active
-
2001-12-19soldstatus $76,900
-
1981-01-01soldstatus $65,000
ⓘ Source: listings_history table (triggers on properties + properties_extension) + one-shot
backfill from property_details.listing_events for pre-trigger history.
Climate risk First Street
- Flood 5/10 Major FEMA zone X (unshaded) · 23% chance over 30 yrs
- Wildfire 3/10 Moderate
- Heat 9/10 Extreme 7 d/yr ≥106°F today · 21 d/yr by 30 yrs out
- Wind 10/10 Extreme 99% chance of damaging wind over 30 yrs
- Air quality 2/10 Low 2 unhealthy d/yr today · 2 by 30 yrs out
Nearby sold comps map
Loading sold comps map…
Walkable amenities ~0.75 mi
Loading nearby amenities…
Taxation est. · year 1
- Rental income
- $26,714
- − Mortgage interest
- −$13,998
- − Property taxes
- −$3,748
- − Insurance
- −$1,250
- − Repairs & maintenance
- −$2,137
- − Management
- −$2,137
- − Depreciation
- −$7,270
- Taxable loss
- −$3,826
- Est. tax savings @ 24.0%
- +$918
- After-tax cash flow
- $1,298/yr
For passive investors: Depreciation is non-cash, so a rental often shows a tax loss while cash-flowing — sheltering income. Rental losses are passive: they offset passive income freely, and up to $25,000/yr can offset ordinary (W-2) income if you actively participate and your MAGI is under $100k (phasing out to $0 by $150k); unused losses carry forward. On sale, claimed depreciation is recaptured at up to 25%, and gains may owe capital-gains tax (a 1031 exchange can defer both). Figures are a year-1 estimate at your 24.0% rate — not tax advice; consult a CPA.
Schools (NCES district)
- District
- Flagler
- NCES district ID
- 1200540
- Math proficiency
- 53% ▼ -9.00%
- Reading proficiency
- 56% ▼ -4.00%
- Median HH income
- $48,354
- Composite
- 46.35/100
- National rank
- #2464
- State rank
- #20 of 73 in FL
Livability — Palm Coast
- Score
- 69/100
- State rank
- #478
- US rank
- #8721
Category grades
Schools grade is shown separately in the Schools card above.
Census & demographics
- Census place
- Palm Coast, FL
- County
- Flagler County · 113,412 people
- City population
- 105,049
- Metro
- Deltona-Daytona Beach-Ormond Beach, FL
- Population (ZIP)
- 48,391
- Household income
- $83,923
- Rent vs Own
- Severe rent burden
- 816.0
Population outlook (Flagler County) Hauer SSP2
- Today (2025)
- 123,474 people
- By 2030
- 131,864 · +6.8%
- By 2040
- 146,176 · +18.4%
- By 2050
- 157,398 · +27.5%
- By 2075
- 177,990 · +44.2%
- By 2100
- 183,381 · +48.5%
Race, ethnicity, and origin ACS 2023
- Neighborhood character
- Predominantly White (77%)
- Race & ethnicity
- White 77% Hispanic / Latino 10% Two or more races 8% Black 6% Asian 3%
- Hispanic origin (detail)
- Puerto Rican 4% Cuban 1%
- Common ancestry
- Romanian 4% Russian 2% Lithuanian 2%
- Foreign-born
- 13% · Canada, Jamaica
- Languages at home
- 85% English-only · Spanish 7% Other Indo-European 3% Russian/Polish/Slavic 2%
Political lean MEDSL · Flagler
- 2024 margin
- Strong R (+28.2) · D 35.6% · R 63.8%
- 2008→2024 swing
- -29.8pp toward R · 2008: 1.6pp · 2024: -28.2pp
- All cycles
- 2024: R+28.2 2020: R+20.8 2016: R+20.6 2012: R+7.4 2008: D+1.6
Not yet ingested
- Civics
- —
Market trends
- HPI YoY
- ▼ -153.27%
- Current HPI
- 290.4607
- Rent YoY
- ▲ 0.85%
- Metro
- Deltona-Daytona Beach-Ormond Beach, FL
- State GDP YoY
- ▲ 3.28%
- F500 in state
- 36
Industry mix (Fortune 500 HQ in FL)
| Industry | F500 HQs | Revenue |
|---|---|---|
| Industrial Technology | 2 | $29B |
|
||
| Insurance | 2 | $17B |
|
||
| Retail | 1 | $60B |
|
||
| Technology Distribution | 1 | $58B |
|
||
| Homebuilding | 1 | $35B |
|
||
| Technology Manufacturing | 1 | $35B |
|
||
Price history
+284.5% since first listed3 events — show timeline
- 2026-05-20 Listed $249,900 Stellar MLS as Distributed by MLS Grid
- 2001-12-19 Sold (Public Records) $76,900 Public Records
- 1981-01-01 Sold (Public Records) $65,000 Public Records
Property tax history
-12.4%/yrLatest (2025): $381 · +4.0% YoY. Source: county tax records.
Cash-flow waterfall
monthlySold comps — $/sqft
last 12 mo · ≤1 miLoading sold comps…