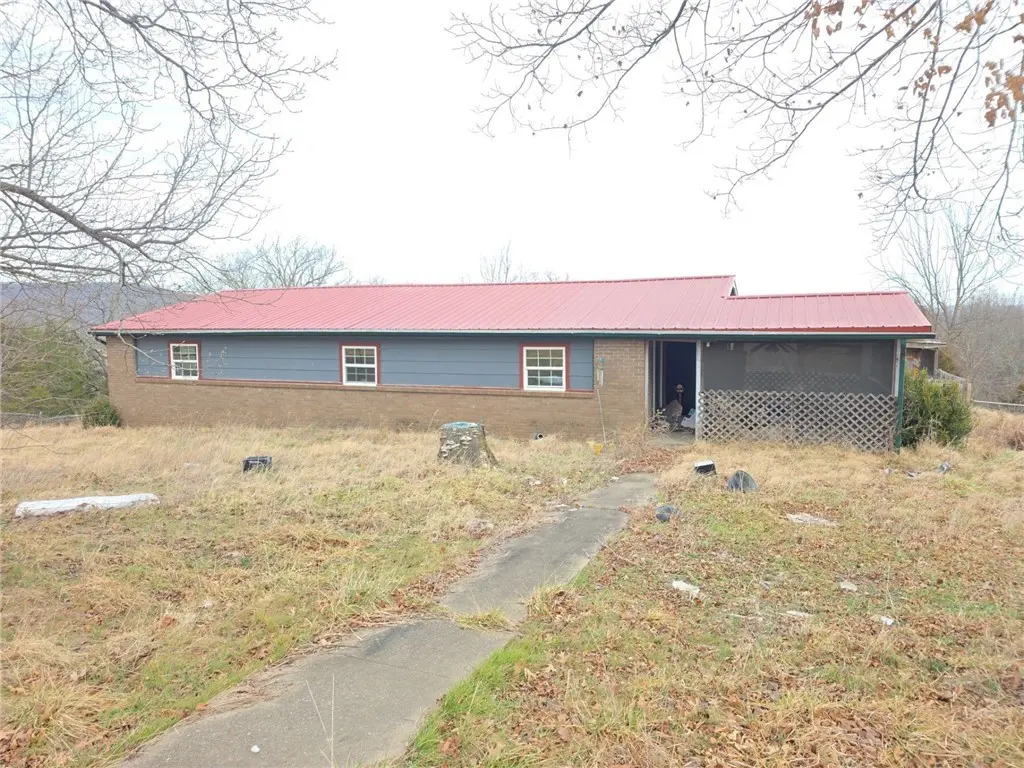
12099A Turner Hill Rd · Elkins, AR
Flood risk 1/10 · Minimal
- FEMA flood zone
- X (unshaded)
- Chance of flooding over 30 yrs
- 0.0%
- Est. flood insurance / yr
- $507 – $1,088
Fire risk 4/10 · Minor
- Est. fire insurance / yr
- $1,499 – $2,785
Heat risk 4/10 · Minor
- Hot days now (above 103°F)
- 7 days/yr
- Hot days in 30 yrs
- 19 days/yr
Wind risk 2/10 · Minimal
- Chance of severe wind over 30 yrs
- 1.0%
Air-quality risk 1/10 · Minimal
- Unhealthy air days now
- 0 days/yr
- Unhealthy air days in 30 yrs
- 0 days/yr
Risk factors via First Street. Map © Google.
Why this score? — see what drove the C- grade
The composite is a weighted blend of 9 inputs, each scored 0–100. Each bar is that input's sub-score; the figure is the points it added to the 100-point composite (weight × sub-score).
- ARV discount +15.0/15.0
- Cash flow +11.2/30.0
- Appreciation +6.6/10.0
- Schools +3.6/10.0
- DSCR +3.3/10.0
- Livability +3.2/5.0
- 1% rule +2.6/10.0
- Rent growth +2.5/5.0
- Condition / age +2.5/5.0
$200,000
🖨 Deal sheet 📄 Offer letter ✓ Due diligence
Listing remarks MLS
Investor / Flip Opportunity! Come see this amazing house with acreage, shop, and swimming pool. Only 10 mins from downtown Elkins, come see what country living is all about. House being sold AS-IS on 4.531 acres with pond.
Key facts
- Acreage
- Country living
- Pond
Tags
Neighborhood map
What this means for you Summary
Snapshot
- This is a 2-bed/2.0-bath single-family listed at $200k.
Deal economics
- At list price, monthly cash flow is $-78 ($-941/yr) — negative.
- To cash-flow at today's rent, offer at most $186k (6.9% below list).
- To meet the 1% rule (rent ≥ 1% of price), the offer needs to be $152k (23.8% below list).
- Recommended offer: $152k (23.8% below list) — sets the bar for 1% rule.
- Cap rate 5.8% vs local median 4.2% in Elkins — top-decile yield for the area; either an underpriced asset or a hidden risk that comps aren't pricing in. Stress-test before assuming the spread holds.
Location & tenants
- Location reads 64/100 on livability (#186 in AR) — a middle-class / working-renter tenant base. Strengths: cost of living A+, housing A+; Watch: schools D, amenities F, commute F.
- Elkins School District (rural): math 43% / reading 40% proficiency, ranked #57 of 238 in AR (top 24%) — families likely to look elsewhere, expect single-tenant / working-renter base with shorter leases.
- Market conditions: 131 active listings in the ZIP; solid renter incomes; 3,494 units permitted in Washington County in 2024 (1,497 in 5+ unit buildings).
Forward outlook
- In year one you build about $8k of equity ($1k loan paydown + $7k appreciation (3.3% local appreciation)).
- Washington County population projected at +47% by 2050 — long-run rental-demand tailwind backs the buy-and-hold thesis.
- At projected returns (3.3% appreciation + 3.0% rent growth), your $56k cash investment doubles in ~7 years — after that, you're playing with house money.
- By year 5, paydown + projected appreciation supports a ~$34k cash-out refi (75% LTV) — recoverable capital for the next deal without selling this one.
Negotiation context
- It's been on market 112 days — a 9% lower offer ($182k) is reasonable based on typical stale-listing flexibility.
- 3 sale attempts since 6y ago; this cycle's ask is 25% above the opening price — seller raised mid-cycle; expect resistance to lowballs.
- Current owner paid $135k; 48% above their basis — modest negotiation headroom, anchor on the comps not their cost.
Questions for the listing agent
- What do current leases actually rent for vs. the listed asking? Can we see a recent rent roll and the last 12 months of T-12 income?
- It's been on market 112 days. Have you received any prior offers? Is the seller open to a 24% concession, seller financing, or rate buy-down credit?
- Built in 1970 — when were the roof, HVAC, electrical panel, plumbing, and water heater last replaced?
- Why hasn't it sold? Are there any deal-killer items the seller is aware of (foundation, flood, title, zoning, code violations)?
- Is there a deadline driving the sale (1031 exchange, divorce, estate, relocation)? That informs how much negotiation room exists.
- Schools are D-rated, which usually means shorter tenancies and higher turnover. Who's the typical renter profile here, and what's been the actual vacancy rate?
- What's the average days-on-market for RENTAL listings here right now (not sales)? A rising rental-DOM trend means longer vacancies and softer asking-rent achievability than the comps imply.
- What's the recent tenant-quality profile in this submarket — average credit score on applications, eviction rate, late-payment / NSF rate, and stable-employment percentage? A property-management company in the area should have these aggregated.
- How much new for-sale + rental construction is in the pipeline within 1–3 miles? Heavy new supply typically softens prices + rents 12–24 months out; constrained supply supports both.
Investment metrics
- 1% rule
- 0.76% ✗
- Cap rate
- 5.82%
- Cash-on-cash
- -1.68%
- DSCR
- 0.93
- GRM
- 10.9
CMA / ARV
- ARV (median comp)
- $322,424
- List price
- $200,000
- Delta
- -37.97%
- Verdict
- UNDERPRICED
- Comps
- 2 within 1.0 mi
Show comp detail 2 sales within ~0.75 mi
| Address | Dist | Beds/Ba | Sqft | Sold | Price | $/sf | Match |
|---|---|---|---|---|---|---|---|
| 12130 Turner Hill Rd | 0.11mi | 3/1.0 (+1) | 1,358 (-10%) | 13mo | $275,000 | $203 | 59 |
| 20138 Durham Mccord Rd | 0.68mi | 3/2.0 (+1) | 1,676 (+12%) | 8mo | $363,900 | $217 | 37 |
Match score weights: distance 35% · size 25% · config 20% · recency 20%. Top-matched comps best support the ARV.
Projected returns pro-forma
3.26% appreciation · 3.0% rent growth · sell at horizon
- IRR
- 6.7%
- Equity multiple
- 1.39×
- Total profit
- $21,811
- Equity at exit
- $92,853
- IRR
- 9.4%
- Equity multiple
- 2.45×
- Total profit
- $81,247
- Equity at exit
- $145,413
Cash invested: $56,000 (down + closing). Projections, not guarantees.
Landlord ↔ Tenant lean methodology
- Overall (STATE)
- 92 Strongly Landlord-Friendly
- State Arkansas
- 92 Strongly Landlord-Friendly · R+14
- County
- — inherits STATE
- City
- — inherits STATE
ZIP-level market 72727
- Home prices YoY
- 1.1%
- Active inventory
- 131
- Price-to-rent
- 10.9×
Monthly cashflow live
- Estimated rent
- $1,523 medium interval (Pro) →
- Mortgage (P&I)
- −$1,049
- Tax from tax record
- −$150 /mo · $1,795/yr
- Insurance
- −$83
- HOA
- −$0
- Vacancy / Maint / Mgmt
- −$320
- Net cashflow
- $-78
Break-even live
UW: 25.0% down · 7.5% · 30yr · 1.5% tax · 5.0% vac · 8.0% maint · 8.0% mgmt
Financing live
Cash to close
- Down payment
- $50,000
- Closing costs
- $6,000
- Reserves months
- —
- Total cash needed
- —
Loan-product check · same deal, 3 products live
Conventional
25% down · 7.5% · 30yr
- Down + closing
- —
- Monthly P&I
- —
- Monthly cashflow
- —
- DSCR
- —
- Eligible?
- —
Personal DTI + credit; lowest rate.
DSCR
20% down · 8.5% · 30yr
- Down + closing
- —
- Monthly P&I
- —
- Monthly cashflow
- —
- DSCR
- —
- Eligible?
- —
No personal income docs; deal must DSCR.
Hard money
10% down · 12.0% · 12mo
- Down + closing
- —
- Monthly P&I
- —
- Monthly cashflow
- —
- DSCR
- —
- Eligible?
- —
Short-term bridge; refi at stabilization.
Listing history 22 events
-
2026-06-18days on market $200,000 Active 112 DOM
-
2026-06-17days on market $200,000 Active 111 DOM
-
2026-06-16days on market $200,000 Active 110 DOM
-
2026-06-15days on market $200,000 Active 109 DOM
-
2026-06-14days on market $200,000 Active 107 DOM
-
2026-06-10days on market $200,000 Active 104 DOM
-
2026-06-09days on market $200,000 Active 103 DOM
-
2026-06-08days on market $200,000 Active 102 DOM
-
2026-06-07days on market $200,000 Active 101 DOM
-
2026-06-05days on market $200,000 Active 98 DOM
-
2026-06-03days on market $200,000 Active 97 DOM
-
2026-06-02days on market $200,000 Active 96 DOM
-
2026-06-01days on market $200,000 Active 95 DOM
-
2026-05-31days on market $200,000 Active 94 DOM
-
2026-05-31days on market $200,000 Active 93 DOM
-
2026-02-26$200,000 Active 222-char remark
Show marketing remark (183 chars)
Come get a slice of country living! Mobile home on 1.8 acres tucked away just 10 minutes from town (Elkins). Single wide with 3 bedrooms and 2 bath. Large yard with lots of potential.
-
2026-02-26$160,000 Active 183-char remark
Show marketing remark (183 chars)
Come get a slice of country living! Mobile home on 1.8 acres tucked away just 10 minutes from town (Elkins). Single wide with 3 bedrooms and 2 bath. Large yard with lots of potential.
-
2021-04-16soldstatus $135,000
-
2021-04-13soldstatus $135,000
-
2020-11-23$165,000
-
2015-08-27soldstatus $60,000
-
2008-03-04soldstatus $93,000
ⓘ Source: listings_history table (triggers on properties + properties_extension) + one-shot
backfill from property_details.listing_events for pre-trigger history.
Tax reassessment forecast AR · Resets to sale price
- Current annual tax
- $1,795 · $150/mo
- Projected year-2 tax
- $1,795 · $150/mo
- Expected delta
- $0/yr ($0/mo · 0.0%)
ⓘ Screening estimate from a state-policy table — verify with the county assessor before closing.
Climate risk First Street
- Flood 1/10 Low FEMA zone X (unshaded) · 0% chance over 30 yrs
- Wildfire 4/10 Moderate
- Heat 4/10 Moderate 7 d/yr ≥103°F today · 19 d/yr by 30 yrs out
- Wind 2/10 Low 100% chance of damaging wind over 30 yrs
- Air quality 1/10 Low 0 unhealthy d/yr today · 0 by 30 yrs out
Nearby sold comps map
Loading sold comps map…
Walkable amenities ~0.75 mi
Loading nearby amenities…
Taxation est. · year 1
- Rental income
- $18,279
- − Mortgage interest
- −$11,203
- − Property taxes
- −$1,795
- − Insurance
- −$1,000
- − Repairs & maintenance
- −$1,462
- − Management
- −$1,462
- − Depreciation
- −$5,818
- Taxable loss
- −$4,462
- Est. tax savings @ 24.0%
- +$1,071
- After-tax cash flow
- $130/yr
For passive investors: Depreciation is non-cash, so a rental often shows a tax loss while cash-flowing — sheltering income. Rental losses are passive: they offset passive income freely, and up to $25,000/yr can offset ordinary (W-2) income if you actively participate and your MAGI is under $100k (phasing out to $0 by $150k); unused losses carry forward. On sale, claimed depreciation is recaptured at up to 25%, and gains may owe capital-gains tax (a 1031 exchange can defer both). Figures are a year-1 estimate at your 24.0% rate — not tax advice; consult a CPA.
Schools (NCES district)
- District
- Elkins School District
- NCES district ID
- 0505760
- Math proficiency
- 43% ▼ -5.00%
- Reading proficiency
- 40% ▼ -5.00%
- Median HH income
- $49,357
- Composite
- 35.69/100
- National rank
- #4867
- State rank
- #57 of 238 in AR
Livability — Elkins
- Score
- 64/100
- State rank
- #186
- US rank
- #14848
Category grades
Schools grade is shown separately in the Schools card above.
Census & demographics
- County
- Washington County · 252,056 people
- City population
- 6,703
- Metro
- Fayetteville-Springdale-Rogers, AR
- Population (ZIP)
- 6,703
- Household income
- $75,402
- Rent vs Own
- Severe rent burden
- 5.0
Population outlook (Washington County) Hauer SSP2
- Today (2025)
- 271,748 people
- By 2030
- 296,414 · +9.1%
- By 2040
- 346,874 · +27.6%
- By 2050
- 398,552 · +46.7%
- By 2075
- 523,309 · +92.6%
- By 2100
- 615,280 · +126.4%
Race, ethnicity, and origin ACS 2023
- Neighborhood character
- Predominantly White (78%)
- Race & ethnicity
- White 78% Two or more races 12% Hispanic / Latino 10%
- Hispanic origin (detail)
- Mexican 6%
- Common ancestry
- Italian 2% Lithuanian 2% Romanian 2%
- Foreign-born
- 4% · Canada
- Languages at home
- 95% English-only · Spanish 5%
Political lean MEDSL · Washington
- 2024 margin
- Lean R (+6.7) · D 45.1% · R 51.7% · Other 3.2%
- 2008→2024 swing
- +6.4pp toward D · 2008: -13.1pp · 2024: -6.7pp
- All cycles
- 2024: R+6.7 2020: R+3.9 2016: R+10.4 2012: R+16.3 2008: R+13.1
Not yet ingested
- Civics
- —
Market trends
- HPI YoY
- ▲ 3.26%
- Current HPI
- 310.3549
- Rent YoY
- —
- Metro
- Fayetteville-Springdale-Rogers, AR
- State GDP YoY
- ▲ 3.80%
- F500 in state
- 10
Industry mix (Fortune 500 HQ in AR)
| Industry | F500 HQs | Revenue |
|---|---|---|
| Retail | 1 | $681B |
|
||
| Food / Agriculture | 1 | $53B |
|
||
| Retail / Energy | 1 | $22B |
|
||
| Transportation / Logistics | 1 | $12B |
|
||
| Energy | 1 | $4B |
|
||
Price history
+72.0% since first listed7 events — show timeline
- 2026-02-26 Listed $160,000 NWARMLS
- 2026-02-26 Listed $200,000 NWARMLS
- 2021-04-16 Sold (Public Records) $135,000 Public Records
- 2021-04-13 Sold (MLS) $135,000 NWARMLS
- 2020-11-23 Listed $165,000 NWARMLS
- 2015-08-27 Sold (Public Records) $60,000 Public Records
- 2008-03-04 Sold (Public Records) $93,000 Public Records
Property tax history
+14.4%/yrLatest (2025): $1,795 · +8.3% YoY. Source: county tax records.
Cash-flow waterfall
monthlySold comps — $/sqft
last 12 mo · ≤1 miLoading sold comps…