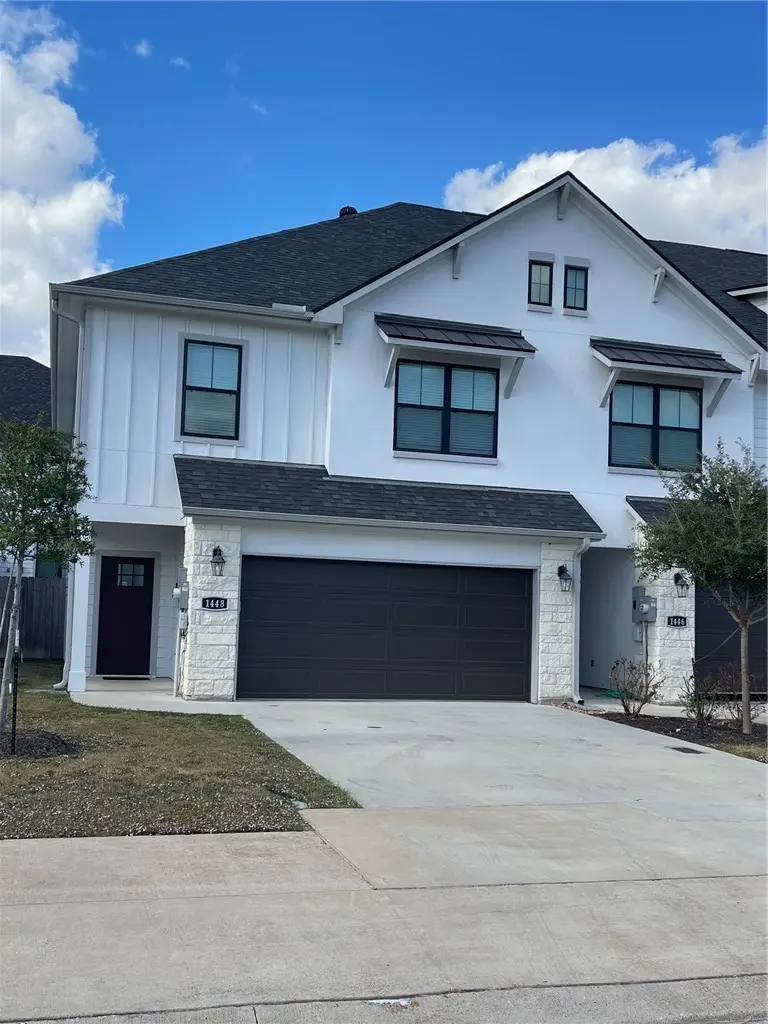
1448 Ailin Dr · College Station, TX
Flood risk 1/10 · Minimal
- FEMA flood zone
- X (unshaded)
- Chance of flooding over 30 yrs
- 0.0%
- Est. flood insurance / yr
- $507 – $1,088
Fire risk 5/10 · Moderate
- Est. fire insurance / yr
- $1,222 – $2,270
Heat risk 8/10 · Major
- Hot days now (above 110°F)
- 7 days/yr
- Hot days in 30 yrs
- 24 days/yr
Wind risk 8/10 · Major
- Chance of severe wind over 30 yrs
- 80.0%
Air-quality risk 1/10 · Minimal
- Unhealthy air days now
- 0 days/yr
- Unhealthy air days in 30 yrs
- 0 days/yr
Risk factors via First Street. Map © Google.
Why this score? — see what drove the D+ grade
The composite is a weighted blend of 9 inputs, each scored 0–100. Each bar is that input's sub-score; the figure is the points it added to the 100-point composite (weight × sub-score).
- Cash flow +21.4/30.0
- DSCR +6.8/10.0
- 1% rule +6.3/10.0
- Livability +4.2/5.0
- Rent growth +3.3/5.0
- Schools +2.6/10.0
- Condition / age +2.5/5.0
- ARV discount +0.0/15.0
- Appreciation +0.0/10.0
$395,000
🖨 Deal sheet 📄 Offer letter ✓ Due diligence
Listing remarks MLS
Looking for an Aggie home for Fall 2026? This 4-bedroom, 4.5-bath end-unit townhome in ACE Townhomes offers an ideal layout for student living, with each bedroom featuring a private bath and walk-in closet for comfort and privacy. The bright, contemporary interior includes high ceilings, crown molding, and vinyl plank flooring throughout. The kitchen features granite countertops, a large island, stainless steel appliances, and attractive cabinetry—perfect for gathering before heading to Kyle Field. Additional features include a 2-car garage with keyless entry, ceiling fans in every room, washer and dryer, 14 SEER HVAC with 2-zone control, and a private fenced backyard. HOA covers lawn care, common areas, fence repairs, and sprinkler system. Currently leased through July 31, 2026, providing steady income until your Aggie moves in. Property is being sold unfurnished; however, furnishings may be purchased separately if desired. Great opportunity to own a turnkey investment in Aggieland!
Key facts
- Private bath
- Walk-in closet
- End-unit townhome
Tags
Neighborhood map
What this means for you Summary
Snapshot
- This is a 4-bed/4.5-bath townhouse listed at $395k.
Deal economics
- At list price, monthly cash flow is $584 ($7k/yr) — positive.
- The deal already cash-flows at list — no discount required.
- Meets the 1% rule at list price ($4k rent vs $395k).
- Recommended offer: $348k (12.0% below list) — sets the bar for market timing.
- Cap rate 8.1% vs local median 3.3% in College Station — top-decile yield for the area; either an underpriced asset or a hidden risk that comps aren't pricing in. Stress-test before assuming the spread holds.
Location & tenants
- Location reads 83/100 on livability (#11 in TX, #994 nationally) — a professional / high-income tenant draw. Strengths: amenities A+, commute A+, crime A-; Watch: employment C-.
- Bryan ISD (urban): math 30% / reading 32% proficiency, ranked #608 of 826 in TX (top 74%) — families likely to look elsewhere, expect single-tenant / working-renter base with shorter leases; 68% free/reduced lunch — lower-income household profile, screen leases tightly.
- Market conditions: Rents rising (+3.1%/yr); 1168 active listings in the ZIP; 8 comparable units currently listed for rent nearby; rentals at typical pace (median 21d on market — plan ~3-4 weeks tenant-placement turnaround); solid renter incomes; 2,211 units permitted in Brazos County in 2024 (768 in 5+ unit buildings).
- At $4,458/mo this rent would consume 60% of the median local household income ($89k/yr) (locally 3329% of renters already pay >50% of income on rent) — very limited rent-growth headroom before tenants either downsize or default.
Forward outlook
- Local home prices are declining (-3.0%/yr); year-one equity from $3k of loan paydown is wiped out by about $12k of value loss. Plan a longer hold.
- Brazos County population projected at +55% by 2050 — long-run rental-demand tailwind backs the buy-and-hold thesis.
Negotiation context
- It's been on market 216 days — a 12% lower offer ($348k) is reasonable based on typical stale-listing flexibility.
- 2 sale attempts since 3y ago; this cycle's ask has dropped $30k (7%) from the opening price — seller is motivated, your offer sets the floor, not the list.
Risks & watch-outs
- Climate carrying-cost: severe wind risk, 80% chance of damaging wind over 30y; moderate wildfire risk; extreme-heat days projected 7→24/yr by 2055 (HVAC capex compounding) — expect insurance premiums to compound above CPI over the hold.
Questions for the listing agent
- It's been on market 216 days. Have you received any prior offers? Is the seller open to a 12% concession, seller financing, or rate buy-down credit?
- What does the HOA fee cover, when was the last increase, and are there any pending special assessments or reserve-fund shortfalls?
- Why hasn't it sold? Are there any deal-killer items the seller is aware of (foundation, flood, title, zoning, code violations)?
- Is there a deadline driving the sale (1031 exchange, divorce, estate, relocation)? That informs how much negotiation room exists.
- Schools are B-rated — typically a magnet for longer-tenancy family renters. What's the average tenant stay here, and is there a school-zone premium baked into asking?
- The area grade is low — what's the realistic commute time and amenity access for the typical tenant pool here? Any planned neighborhood developments (good or bad) we should know about?
- What's the average days-on-market for RENTAL listings here right now (not sales)? A rising rental-DOM trend means longer vacancies and softer asking-rent achievability than the comps imply.
- What's the recent tenant-quality profile in this submarket — average credit score on applications, eviction rate, late-payment / NSF rate, and stable-employment percentage? A property-management company in the area should have these aggregated.
- How much new for-sale + rental construction is in the pipeline within 1–3 miles? Heavy new supply typically softens prices + rents 12–24 months out; constrained supply supports both.
Investment metrics
- 1% rule
- 1.13% ✓
- Cap rate
- 8.07%
- Cash-on-cash
- 6.34%
- DSCR
- 1.28
- GRM
- 7.4
CMA / ARV
- ARV (median comp)
- $297,114
- List price
- $395,000
- Delta
- 32.95%
- Verdict
- OVERPRICED
- Comps
- 18 within 1.0 mi
Show comp detail 5 sales within ~0.75 mi
| Address | Dist | Beds/Ba | Sqft | Sold | Price | $/sf | Match |
|---|---|---|---|---|---|---|---|
| 3804 Silverthorne Ln | 0.27mi | 4/3.5 | 1,858 (+1%) | 20mo | $333,000 | $179 | 66 |
| 3825 Blackhawk Ln | 0.34mi | 3/3.5 (-1) | 1,818 (-1%) | 11mo | $324,900 | $179 | 64 |
| 1758 Lonetree Dr | 0.38mi | 3/3.0 (-1) | 1,610 (-13%) | 7mo | $334,000 | $207 | 44 |
| 1617 Buena Vis | 0.45mi | 3/2.5 (-1) | 1,598 (-13%) | 8mo | $339,999 | $213 | 37 |
| 1756 Dakota Ln | 0.49mi | 3/2.0 (-1) | 1,605 (-13%) | 16mo | $349,000 | $217 | 27 |
Match score weights: distance 35% · size 25% · config 20% · recency 20%. Top-matched comps best support the ARV.
Projected returns pro-forma
-3.0% appreciation · 3.13% rent growth · sell at horizon
- IRR
- -6.3%
- Equity multiple
- 0.76×
- Total profit
- $-26,016
- Equity at exit
- $58,896
- IRR
- 3.5%
- Equity multiple
- 1.26×
- Total profit
- $28,458
- Equity at exit
- $34,152
Cash invested: $110,600 (down + closing). Projections, not guarantees.
Landlord ↔ Tenant lean methodology
- Overall (STATE)
- 87 Strongly Landlord-Friendly
- State Texas
- 87 Strongly Landlord-Friendly · R+5
- County
- — inherits STATE
- City
- — inherits STATE
ZIP-level market 77845
- Rents YoY
- 3.1%
- Active inventory
- 1168
- Price-to-rent
- 7.4×
Monthly cashflow live
- Estimated rent
- $4,458 high interval (Pro) →
- Mortgage (P&I)
- −$2,071
- Tax from tax record
- −$582 /mo · $6,982/yr
- Insurance
- −$165
- HOA
- −$120
- Vacancy / Maint / Mgmt
- −$936
- Net cashflow
- $584
Break-even live
UW: 25.0% down · 7.5% · 30yr · 1.5% tax · 5.0% vac · 8.0% maint · 8.0% mgmt
Financing live
Cash to close
- Down payment
- $98,750
- Closing costs
- $11,850
- Reserves months
- —
- Total cash needed
- —
Loan-product check · same deal, 3 products live
Conventional
25% down · 7.5% · 30yr
- Down + closing
- —
- Monthly P&I
- —
- Monthly cashflow
- —
- DSCR
- —
- Eligible?
- —
Personal DTI + credit; lowest rate.
DSCR
20% down · 8.5% · 30yr
- Down + closing
- —
- Monthly P&I
- —
- Monthly cashflow
- —
- DSCR
- —
- Eligible?
- —
No personal income docs; deal must DSCR.
Hard money
10% down · 12.0% · 12mo
- Down + closing
- —
- Monthly P&I
- —
- Monthly cashflow
- —
- DSCR
- —
- Eligible?
- —
Short-term bridge; refi at stabilization.
Rent comps 8 comps
| Address | Beds | Baths | Sqft | Rent | $/sqft | DOM | Units | Dist |
|---|---|---|---|---|---|---|---|---|
| 2126 Crescent Pointe Pkwy College Station, TX | 4.0 | 4.5 | 1864 | $650 | $0.35 | 43d | 1 | 0.11mi |
| 1416 Crescent Ridge Dr Unit 1328076P College Station, TX | 4.0 | 3.0 | 1980 | $7,187 | $3.63 | 20d | 1 | 0.12mi |
| 1761 Dakota Ln College Station, TX | 3.0 | 2.5 | 1598 | $2,250 | $1.41 | 20d | 1 | 0.49mi |
| 1762 Dakota Ln Unit 1328094P College Station, TX | 3.0 | 3.0 | 1506 | $2,852 | $1.89 | 20d | 1 | 0.52mi |
| 1720 Summit Crossing Ln College Station, TX | 1.0–3.0 | 1.0–2.0 | 983 | $2,205 | $2.24 | 13d | 46 | 0.66mi |
| 4150 Pendleton Dr Bryan, TX | 1.0–3.0 | 1.0–3.0 | 1061 | $1,955 | $1.84 | 13d | 28 | 0.89mi |
| 5040 Mooney Falls Dr Unit 1328058P Bryan, TX | 3.0 | 2.0 | 1840 | $5,551 | $3.02 | 13d | 1 | 1.24mi |
| 5041 Mooney Falls Dr Bryan, TX | 3.0 | 2.0 | 1814 | $2,400 | $1.32 | 43d | 1 | 1.27mi |
HOA detail
- Monthly dues
- $120 · $1,440/yr
- Likely covers
- landscaping
Listing history 20 events
-
2026-06-18days on market $395,000 Active 216 DOM
-
2026-06-17days on market $395,000 Active 215 DOM
-
2026-06-16days on market $395,000 Active 214 DOM
-
2026-06-15days on market $395,000 Active 213 DOM
-
2026-06-14days on market $395,000 Active 211 DOM
-
2026-06-13days on market $395,000 Active 210 DOM
-
2026-06-10days on market $395,000 Active 208 DOM
-
2026-06-09days on market $395,000 Active 207 DOM
-
2026-06-08days on market $395,000 Active 206 DOM
-
2026-06-07days on market $395,000 Active 205 DOM
-
2026-06-03days on market $395,000 Active 201 DOM
-
2026-06-02days on market $395,000 Active 200 DOM
-
2026-06-01days on market $395,000 Active 199 DOM
-
2026-05-31days on market $395,000 Active 198 DOM
-
2026-05-30days on market $395,000 Active 197 DOM
-
2026-03-11price $395,000 1004-char remark
Show marketing remark (1004 chars)
Looking for an Aggie home for Fall 2026? This 4-bedroom, 4.5-bath end-unit townhome in ACE Townhomes offers an ideal layout for student living, with each bedroom featuring a private bath and walk-in closet for comfort and privacy. The bright, contemporary interior includes high ceilings, crown molding, and vinyl plank flooring throughout. The kitchen features granite countertops, a large island, stainless steel appliances, and attractive cabinetry—perfect for gathering before heading to Kyle Field. Additional features include a 2-car garage with keyless entry, ceiling fans in every room, washer and dryer, 14 SEER HVAC with 2-zone control, and a private fenced backyard. HOA covers lawn care, common areas, fence repairs, and sprinkler system. Currently leased through July 31, 2026, providing steady income until your Aggie moves in. Property is being sold unfurnished; however, furnishings may be purchased separately if desired. Great opportunity to own a turnkey investment in Aggieland!
-
2025-11-14$425,000 Active 1004-char remark
Show marketing remark (1004 chars)
Looking for an Aggie home for Fall 2026? This 4-bedroom, 4.5-bath end-unit townhome in ACE Townhomes offers an ideal layout for student living, with each bedroom featuring a private bath and walk-in closet for comfort and privacy. The bright, contemporary interior includes high ceilings, crown molding, and vinyl plank flooring throughout. The kitchen features granite countertops, a large island, stainless steel appliances, and attractive cabinetry—perfect for gathering before heading to Kyle Field. Additional features include a 2-car garage with keyless entry, ceiling fans in every room, washer and dryer, 14 SEER HVAC with 2-zone control, and a private fenced backyard. HOA covers lawn care, common areas, fence repairs, and sprinkler system. Currently leased through July 31, 2026, providing steady income until your Aggie moves in. Property is being sold unfurnished; however, furnishings may be purchased separately if desired. Great opportunity to own a turnkey investment in Aggieland!
-
2023-10-04historical $2,300
-
2023-09-22$2,300
-
2023-07-27soldstatus
ⓘ Source: listings_history table (triggers on properties + properties_extension) + one-shot
backfill from property_details.listing_events for pre-trigger history.
Tax reassessment forecast TX · Resets to sale price
- Current annual tax
- $6,982 · $582/mo
- Projected year-2 tax
- $7,228 · $602/mo
- Expected delta
- +$247/yr (+$21/mo · 3.5%)
ⓘ Screening estimate from a state-policy table — verify with the county assessor before closing.
Climate risk First Street
- Flood 1/10 Low FEMA zone X (unshaded) · 0% chance over 30 yrs
- Wildfire 5/10 Major
- Heat 8/10 Severe 7 d/yr ≥110°F today · 24 d/yr by 30 yrs out
- Wind 8/10 Severe 80% chance of damaging wind over 30 yrs
- Air quality 1/10 Low 0 unhealthy d/yr today · 0 by 30 yrs out
Nearby sold comps map
Loading sold comps map…
Walkable amenities ~0.75 mi
Loading nearby amenities…
Taxation est. · year 1
- Rental income
- $53,500
- − Mortgage interest
- −$22,126
- − Property taxes
- −$6,982
- − Insurance
- −$1,975
- − Repairs & maintenance
- −$4,280
- − Management
- −$4,280
- − HOA
- −$1,440
- − Depreciation
- −$11,491
- Taxable income
- $926
- Est. tax owed @ 24.0%
- −$222
- After-tax cash flow
- $6,789/yr
For passive investors: Depreciation is non-cash, so a rental often shows a tax loss while cash-flowing — sheltering income. Rental losses are passive: they offset passive income freely, and up to $25,000/yr can offset ordinary (W-2) income if you actively participate and your MAGI is under $100k (phasing out to $0 by $150k); unused losses carry forward. On sale, claimed depreciation is recaptured at up to 25%, and gains may owe capital-gains tax (a 1031 exchange can defer both). Figures are a year-1 estimate at your 24.0% rate — not tax advice; consult a CPA.
Schools (NCES district)
- District
- Bryan ISD
- NCES district ID
- 4811790
- Math proficiency
- 30% ▼ -8.00%
- Reading proficiency
- 32% ▼ -3.00%
- Median HH income
- $41,895
- Composite
- 26.26/100
- National rank
- #7253
- State rank
- #608 of 826 in TX
Livability — College Station
- Score
- 83/100
- State rank
- #11
- US rank
- #994
Category grades
Schools grade is shown separately in the Schools card above.
Census & demographics
- Census place
- College Station, TX
- County
- Brazos County · 233,400 people
- City population
- 131,628
- Metro
- College Station-Bryan, TX
- Population (ZIP)
- 76,764
- Household income
- $88,851
- Rent vs Own
- Severe rent burden
- 3329.0
Population outlook (Brazos County) Hauer SSP2
- Today (2025)
- 267,942 people
- By 2030
- 296,630 · +10.7%
- By 2040
- 354,560 · +32.3%
- By 2050
- 414,616 · +54.7%
- By 2075
- 562,158 · +109.8%
- By 2100
- 678,828 · +153.3%
Race, ethnicity, and origin ACS 2023
- Neighborhood character
- Predominantly White (69%)
- Race & ethnicity
- White 69% Hispanic / Latino 16% Two or more races 9% Asian 8% Black 5%
- Hispanic origin (detail)
- Mexican 12%
- Common ancestry
- Lithuanian 2% Romanian 2% Italian 2%
- Foreign-born
- 11% · Canada, China, South Korea
- Languages at home
- 83% English-only · Spanish 8% Other Indo-European 3% Chinese 2%
Political lean MEDSL · Brazos
- 2024 margin
- Strong R (+24.9) · D 36.9% · R 61.7% · Other 1.4%
- 2008→2024 swing
- +4.1pp toward D · 2008: -28.9pp · 2024: -24.9pp
- All cycles
- 2024: R+24.9 2020: R+14.3 2016: R+23.7 2012: R+35.3 2008: R+28.9
Not yet ingested
- Civics
- —
Market trends
- HPI YoY
- ▼ -133.31%
- Current HPI
- 175.9669
- Rent YoY
- ▲ 3.13%
- Metro
- College Station-Bryan, TX
- State GDP YoY
- ▲ 3.95%
- F500 in state
- 110
Industry mix (Fortune 500 HQ in TX)
| Industry | F500 HQs | Revenue |
|---|---|---|
| Energy | 16 | $1,198B |
|
||
| Technology | 5 | $198B |
|
||
| Engineering / Construction | 4 | $72B |
|
||
| Energy Services | 3 | $60B |
|
||
| Utilities | 3 | $41B |
|
||
| Healthcare | 2 | $330B |
|
||
Price history
+17073.9% since first listed5 events — show timeline
- 2026-03-11 Price Changed $395,000 BCSRMLS
- 2025-11-14 Listed $425,000 BCSRMLS
- 2023-10-04 Rental Removed $2,300 Constellation-bcsrmls
- 2023-09-22 Listed for Rent $2,300 Constellation-bcsrmls
- 2023-07-27 Sold (Public Records) — Public Records
Property tax history
+60.1%/yrLatest (2025): $6,982 · +1.1% YoY. Source: county tax records.
Cash-flow waterfall
monthlySold comps — $/sqft
last 12 mo · ≤1 miLoading sold comps…