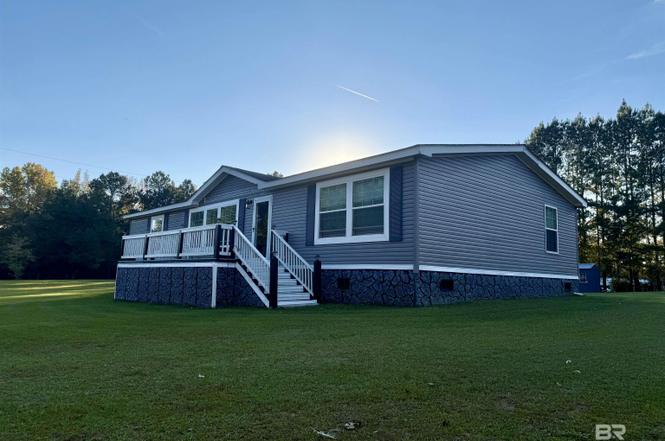
8921 Highway 29 · East Brewton, AL
Flood risk 1/10 · Minimal
- FEMA flood zone
- X (unshaded)
- Chance of flooding over 30 yrs
- 0.0%
- Est. flood insurance / yr
- $507 – $1,088
Fire risk 6/10 · Moderate
- Est. fire insurance / yr
- $916 – $1,700
Heat risk 8/10 · Major
- Hot days now (above 107°F)
- 7 days/yr
- Hot days in 30 yrs
- 19 days/yr
Wind risk 8/10 · Major
- Chance of severe wind over 30 yrs
- 99.0%
Air-quality risk 2/10 · Minimal
- Unhealthy air days now
- 0 days/yr
- Unhealthy air days in 30 yrs
- 1 days/yr
Risk factors via First Street. Map © Google.
Why this score? — see what drove the D- grade
The composite is a weighted blend of 9 inputs, each scored 0–100. Each bar is that input's sub-score; the figure is the points it added to the 100-point composite (weight × sub-score).
- Cash flow +10.3/30.0
- ARV discount +9.7/15.0
- Appreciation +3.3/10.0
- Livability +3.2/5.0
- 1% rule +3.1/10.0
- DSCR +3.0/10.0
- Rent growth +2.5/5.0
- Condition / age +2.5/5.0
- Schools +2.3/10.0
$185,500
🖨 Deal sheet (PDF) 📄 Offer letter ✓ Due diligence
Listing remarks
Looking for move-in ready and low maintenance? This modular home checks every box! Featuring three bedrooms and two baths, the split floor plan offers privacy and comfort. The kitchen stands out with tons of cabinetry, natural light, a breakfast bar, and a bright dining space that makes family meals easy. The primary suite includes a walk-in closet and a spacious bath with double vanities, a garden tub, and a separate shower. Enjoy outdoor living on the incredible screened porch—perfect for grilling, game day, or quiet evenings. With a large backyard, covered parking, and outdoor storage, all just minutes from downtown Brewton, this immaculately kept home offers the perfect blend of c
Key facts
- Modular home
- Walk-in closet
- Split floor plan
Tags
Property features AI
Finance
- Other: Directions: From Downtown Brewton or East Brewton, take Ridge Road to Highway 29. Turn left; the property is a few hundred yards on the left.
- HOA & community: No community features; No transfer fees
Exterior
- Parking: Double carport (2 covered carport spaces)
- Utilities: Septic tank; Electric service by Southern Pine Electric; Has heating (electric)
- Home design: One level; Vinyl siding; Composition roof
- Construction: Vinyl siding construction
- Exterior features: Front porch; Screened porch; Barn(s); Storage; Less than 1 acre lot; No waterfront; Wheelchair accessible property; Resale condition
Interior
- Kitchen: Dishwasher; Electric range; Refrigerator with ice maker; ENERGY STAR qualified appliances
- Bedrooms: Master bedroom with walk-in closet(s)
- Flooring: Carpet
- Bathrooms: 2 full bathrooms; Master bathroom with double vanity, soaking tub, and separate shower
- Heating & cooling: Electric heating
- Interior features: Entrance foyer; Breakfast bar
- Laundry & utility: Laundry located inside
Neighborhood map
What this means for you Summary
Snapshot
- This is a 3-bed/2.0-bath single-family listed at $186k.
Deal economics
- At list price, monthly cash flow is $-102 ($-1k/yr) — negative.
- To cash-flow at today's rent, offer at most $171k (7.9% below list).
- To meet the 1% rule (rent ≥ 1% of price), the offer needs to be $149k (19.5% below list).
- Recommended offer: $149k (19.5% below list) — sets the bar for 1% rule.
Location & tenants
- Location reads 63/100 on livability (#174 in AL) — a middle-class / working-renter tenant base. Strengths: cost of living A+, housing A-, health & safety B+; Watch: amenities F, commute F, employment F.
- Escambia County (town): math 17% / reading 39% proficiency, ranked #83 of 129 in AL (top 64%) — low school quality limits family demand, transient renter base, plan for 1-2y turnover; 70% free/reduced lunch — lower-income household profile, screen leases tightly.
- Zoned schools: W S Neal Elementary School (math 17% / reading 52%, grade F, #296 of 627 statewide, top 49%, 542 students, 72% FRL); W S Neal Middle School (math 10% / reading 45%, grade F, #144 of 257 statewide, top 57%, 416 students, 76% FRL); W S Neal High School (math 12% / reading 22%, grade F, #195 of 305 statewide, top 68%, 358 students, 70% FRL) — zoned schools at 73% FRL track the district average.
- Market conditions: 88 active listings in the ZIP; 18 units permitted in Escambia County in 2024 (0 in 5+ unit buildings).
Forward outlook
- Local home prices are declining (-3.0%/yr); year-one equity from $1k of loan paydown is wiped out by about $6k of value loss. Plan a longer hold.
- Escambia County population projected to shrink 10% by 2050 — rents likely to lag national; underwrite the cash flow, not the appreciation.
Negotiation context
- Only 2 days on market — expect competitive offers; lowballing is unlikely to land.
- 5 sale attempts since 2y ago with the ask held roughly flat each time — persistent listings suggest the price (not the market) is what's stuck; bring a comps-based counter.
Risks & watch-outs
- Climate carrying-cost: severe wind risk, 99% chance of damaging wind over 30y; major wildfire risk; extreme-heat days projected 7→19/yr by 2055 (HVAC capex compounding) — expect insurance premiums to compound above CPI over the hold.
Questions for the listing agent
- What do current leases actually rent for vs. the listed asking? Can we see a recent rent roll and the last 12 months of T-12 income?
- Is there a deadline driving the sale (1031 exchange, divorce, estate, relocation)? That informs how much negotiation room exists.
- Schools are D-rated, which usually means shorter tenancies and higher turnover. Who's the typical renter profile here, and what's been the actual vacancy rate?
- The area grade is low — what's the realistic commute time and amenity access for the typical tenant pool here? Any planned neighborhood developments (good or bad) we should know about?
- What's the average days-on-market for RENTAL listings here right now (not sales)? A rising rental-DOM trend means longer vacancies and softer asking-rent achievability than the comps imply.
- What's the recent tenant-quality profile in this submarket — average credit score on applications, eviction rate, late-payment / NSF rate, and stable-employment percentage? A property-management company in the area should have these aggregated.
- How much new for-sale + rental construction is in the pipeline within 1–3 miles? Heavy new supply typically softens prices + rents 12–24 months out; constrained supply supports both.
Investment metrics
- 1% rule
- 0.81% ✗
- Cap rate
- 5.63%
- Cash-on-cash
- -2.35%
- DSCR
- 0.90
- GRM
- 10.3
CMA / ARV
- ARV (median comp)
- $194,963
- List price
- $185,500
- Delta
- -2.60%
- Verdict
- FAIR
- Comps
- 4 within 2.0 mi
Projected returns pro-forma
-3.0% appreciation · 3.0% rent growth · sell at horizon
- IRR
- -20.2%
- Equity multiple
- 0.30×
- Total profit
- $-36,517
- Equity at exit
- $27,659
- IRR
- -13.2%
- Equity multiple
- 0.23×
- Total profit
- $-40,051
- Equity at exit
- $16,039
Cash invested: $51,940 (down + closing). Projections, not guarantees.
Landlord ↔ Tenant lean methodology
- Overall (STATE)
- 90 Strongly Landlord-Friendly
- State Alabama
- 90 Strongly Landlord-Friendly · R+15
- County
- — inherits STATE
- City
- — inherits STATE
ZIP-level market 36426
- Home prices YoY
- -1.1%
- Active inventory
- 88
- Price-to-rent
- 10.3×
Monthly cashflow live
- Estimated rent
- $1,494 medium interval (Pro) →
- Mortgage (P&I)
- −$973
- Tax est. 1.5%
- −$232 /mo · $2,782/yr
- Insurance
- −$77
- HOA
- −$0
- Vacancy / Maint / Mgmt
- −$314
- Net cashflow
- $-102
Break-even live
Sensitivity live
| Price | -10% $26 | -5% $-38 | +0% $-102 | +5% $-166 | +10% $-230 |
|---|---|---|---|---|---|
| Rent | -10% $-220 | -5% $-161 | +0% $-102 | +5% $-43 | +10% $16 |
| Rate | -1.0pp $-8 | -0.5pp $-55 | base $-102 | +0.5pp $-150 | +1.0pp $-199 |
UW: 25.0% down · 7.5% · 30yr · 1.5% tax · 5.0% vac · 8.0% maint · 8.0% mgmt
Financing live
Cash to close
- Down payment
- $46,375
- Closing costs
- $5,565
- Reserves months
- —
- Total cash needed
- —
Loan-product check · same deal, 3 products live
Conventional
25% down · 7.5% · 30yr
- Down + closing
- —
- Monthly P&I
- —
- Monthly cashflow
- —
- DSCR
- —
- Eligible?
- —
Personal DTI + credit; lowest rate.
DSCR
20% down · 8.5% · 30yr
- Down + closing
- —
- Monthly P&I
- —
- Monthly cashflow
- —
- DSCR
- —
- Eligible?
- —
No personal income docs; deal must DSCR.
Hard money
10% down · 12.0% · 12mo
- Down + closing
- —
- Monthly P&I
- —
- Monthly cashflow
- —
- DSCR
- —
- Eligible?
- —
Short-term bridge; refi at stabilization.
Listing history 9 events
-
2026-06-22days on market $185,500 Active 2 DOM
-
2026-06-21pricestatusdays on market $185,500 Active 1 DOM
-
2026-04-29status Active
-
2026-04-28status Pending
-
2026-03-09price $189,900
-
2025-11-09$195,900 Active
-
2024-11-27status Active
-
2024-11-27price $210,000
-
2024-07-17$175,000 Active
ⓘ Source: listings_history table (triggers on properties + properties_extension) + one-shot
backfill from property_details.listing_events for pre-trigger history.
Climate risk First Street
- Flood 1/10 Low FEMA zone X (unshaded) · 0% chance over 30 yrs
- Wildfire 6/10 Major
- Heat 8/10 Severe 7 d/yr ≥107°F today · 19 d/yr by 30 yrs out
- Wind 8/10 Severe 99% chance of damaging wind over 30 yrs
- Air quality 2/10 Low 0 unhealthy d/yr today · 1 by 30 yrs out
Nearby sold comps map
Loading sold comps map…
Walkable amenities ~0.75 mi
Loading nearby amenities…
Taxation est. · year 1
- Rental income
- $17,927
- − Mortgage interest
- −$10,391
- − Property taxes
- −$2,782
- − Insurance
- −$928
- − Repairs & maintenance
- −$1,434
- − Management
- −$1,434
- − Depreciation
- −$5,396
- Taxable loss
- −$4,438
- Est. tax savings @ 24.0%
- +$1,065
- After-tax cash flow
- $-156/yr
For passive investors: Depreciation is non-cash, so a rental often shows a tax loss while cash-flowing — sheltering income. Rental losses are passive: they offset passive income freely, and up to $25,000/yr can offset ordinary (W-2) income if you actively participate and your MAGI is under $100k (phasing out to $0 by $150k); unused losses carry forward. On sale, claimed depreciation is recaptured at up to 25%, and gains may owe capital-gains tax (a 1031 exchange can defer both). Figures are a year-1 estimate at your 24.0% rate — not tax advice; consult a CPA.
Schools (NCES district)
- District
- Escambia County
- NCES district ID
- 0101350
- Math proficiency
- 17% ▼ -27.00%
- Reading proficiency
- 39% ▼ -4.00%
- Median HH income
- $31,905
- Composite
- 22.73/100
- National rank
- #8036
- State rank
- #83 of 129 in AL
Livability — East Brewton
- Score
- 63/100
- State rank
- #174
- US rank
- #14964
Category grades
Schools grade is shown separately in the Schools card above.
Census & demographics
- Population (ZIP)
- 16,049
Population outlook (Escambia County) Hauer SSP2
- Today (2025)
- 36,683 people
- By 2030
- 35,844 · -2.3%
- By 2040
- 34,393 · -6.2%
- By 2050
- 33,109 · -9.7%
- By 2075
- 28,305 · -22.8%
- By 2100
- 21,091 · -42.5%
Race, ethnicity, and origin ACS 2023
- Neighborhood character
- Predominantly White (69%)
- Race & ethnicity
- White 69% Black 22% Two or more races 5% Hispanic / Latino 4%
- Common ancestry
- Slovak 2% Lithuanian 1% Italian 1%
- Foreign-born
- 1% · Canada, Dominican Republic
- Languages at home
- 99% English-only · Spanish 1%
Political lean MEDSL · Escambia
- 2024 margin
- Solid R (+46.4) · D 26.6% · R 72.9%
- 2008→2024 swing
- -17.8pp toward R · 2008: -28.5pp · 2024: -46.4pp
- All cycles
- 2024: R+46.4 2020: R+37.4 2016: R+36.7 2012: R+25.5 2008: R+28.5
Not yet ingested
- Civics
- —
Market trends
- HPI YoY
- ▼ -3.44%
- Current HPI
- 294.97
- Rent YoY
- —
- Metro
- —
- State GDP YoY
- ▲ 2.94%
- F500 in state
- 4
Industry mix (Fortune 500 HQ in AL)
| Industry | F500 HQs | Revenue |
|---|---|---|
| Financial Services | 1 | $8B |
|
||
| Healthcare | 1 | $5B |
|
||
Price history
+6.0% since first listed8 events — show timeline
- 2026-06-16 Listed $185,500 BCAR
- 2026-04-29 Relisted — BCAR
- 2026-04-28 Pending — BCAR
- 2026-03-09 Price Changed $189,900 BCAR
- 2025-11-09 Listed $195,900 BCAR
- 2024-11-27 Relisted — BCAR
- 2024-11-27 Price Changed $210,000 BCAR
- 2024-07-17 Listed $175,000 BCAR
Property tax history
-3.2%/yrLatest (2023): $64 · -3.2% YoY. Source: county tax records.
Cash-flow waterfall
monthlySold comps — $/sqft
last 12 mo · ≤1 miLoading sold comps…