 Multi-family
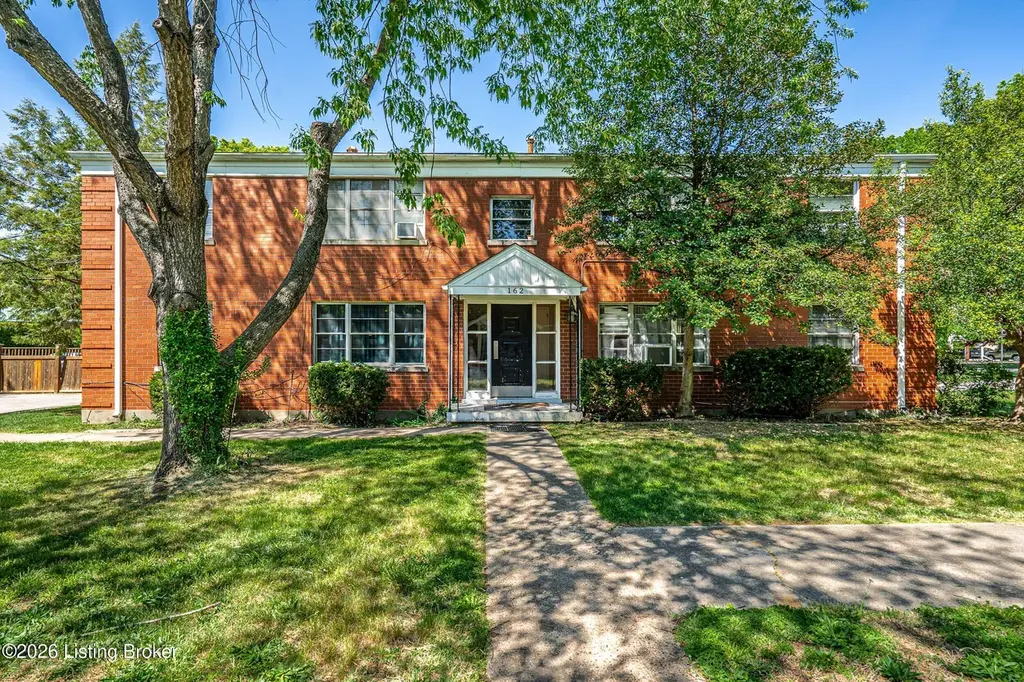
162 Thierman Ln · St. Matthews, KY
Flood risk 6/10 · Moderate
- FEMA flood zone
- X (unshaded)
- Chance of flooding over 30 yrs
- 0.71%
- Est. flood insurance / yr
- $473 – $860
Fire risk 1/10 · Minimal
- Est. fire insurance / yr
- $839 – $1,559
Heat risk 5/10 · Moderate
- Hot days now (above 105°F)
- 7 days/yr
- Hot days in 30 yrs
- 20 days/yr
Wind risk 2/10 · Minimal
- Chance of severe wind over 30 yrs
- 2.0%
Air-quality risk 3/10 · Minor
- Unhealthy air days now
- 2 days/yr
- Unhealthy air days in 30 yrs
- 3 days/yr
Risk factors via First Street. Map © Google.
Why this score? — see what drove the D grade
The composite is a weighted blend of 9 inputs, each scored 0–100. Each bar is that input's sub-score; the figure is the points it added to the 100-point composite (weight × sub-score).
- Cash flow +16.1/30.0
- ARV discount +7.5/15.0
- DSCR +5.0/10.0
- 1% rule +3.8/10.0
- Rent growth +3.2/5.0
- Livability +2.5/5.0
- Condition / age +2.5/5.0
- Schools +2.3/10.0
- Appreciation +0.0/10.0
$525,000
🖨 Deal sheet 📄 Offer letter ✓ Due diligence
Multi-family units
County records classify this as Multi-Family (5+ Unit). Listing-text estimate: 1 unit. estimate disagrees with records
5+ unit building — per-unit beds/baths from public records are typically unavailable; the breakdown below (if shown) is an estimate from the listing text.
Listing remarks
Situated in the heart of St. Matthews, this rare multifamily opportunity benefits from one of the most desirable infill locations in the city. Offered by an estate, the property will be delivered with three of four units vacant—providing immediate upside for investors to implement a value-add strategy and lease at market rates. The asset features well-designed 2-bedroom, 1-bath units and is separately metered for LG & E, ensuring operational efficiency. A full basement contains washer/dryer hookups for tenants. Ideally positioned between Shelbyville Road and Westport Road, the property benefits from close proximity to premier retail corridors and established single-family neighbor
Key facts
- Washer dryer hookups
- Close proximity
- Built 1960
Tags
Neighborhood map
What this means for you Summary
Snapshot
- This is a multifamily listed at $525k.
Deal economics
- At list price, monthly cash flow is $266 ($3k/yr) — positive.
- The deal already cash-flows at list — no discount required.
- To meet the 1% rule (rent ≥ 1% of price), the offer needs to be $463k (11.8% below list).
- Recommended offer: $463k (11.8% below list) — sets the bar for 1% rule.
- Cap rate 6.9% vs local median 4.1% in St. Matthews — top-decile yield for the area; either an underpriced asset or a hidden risk that comps aren't pricing in. Stress-test before assuming the spread holds.
Location & tenants
- Location reads: area grade D — affects rentability + tenant quality, not the cash-flow math above.
- Jefferson County (urban): math 19% / reading 35% proficiency, ranked #121 of 165 in KY (top 73%) — low school quality limits family demand, transient renter base, plan for 1-2y turnover.
- Market conditions: Rents rising (+2.6%/yr); 159 active listings in the ZIP; 3 comparable units currently listed for rent nearby; rentals at typical pace (median 16d on market — plan ~3-4 weeks tenant-placement turnaround); solid renter incomes; 2,836 units permitted in Jefferson County in 2024 (1,558 in 5+ unit buildings).
- At $4,632/mo this rent would consume 55% of the median local household income ($102k/yr) (locally 751% of renters already pay >50% of income on rent) — very limited rent-growth headroom before tenants either downsize or default.
Forward outlook
- Local home prices are declining (-3.0%/yr); year-one equity from $4k of loan paydown is wiped out by about $16k of value loss. Plan a longer hold.
- Jefferson County population projected at +13% by 2050 — modest demand growth; plan on rents tracking national, not racing it.
Negotiation context
- Only 3 days on market — expect competitive offers; lowballing is unlikely to land.
- 2 sale attempts with the ask held roughly flat each time — persistent listings suggest the price (not the market) is what's stuck; bring a comps-based counter.
Risks & watch-outs
- Climate carrying-cost: major flood risk; extreme-heat days projected 7→20/yr by 2055 (HVAC capex compounding) — expect insurance premiums to compound above CPI over the hold.
Questions for the listing agent
- Built in 1960 — when were the roof, HVAC, electrical panel, plumbing, and water heater last replaced?
- Is there a deadline driving the sale (1031 exchange, divorce, estate, relocation)? That informs how much negotiation room exists.
- The area grade is low — what's the realistic commute time and amenity access for the typical tenant pool here? Any planned neighborhood developments (good or bad) we should know about?
- What's the average days-on-market for RENTAL listings here right now (not sales)? A rising rental-DOM trend means longer vacancies and softer asking-rent achievability than the comps imply.
- What's the recent tenant-quality profile in this submarket — average credit score on applications, eviction rate, late-payment / NSF rate, and stable-employment percentage? A property-management company in the area should have these aggregated.
- How much new apartment / multifamily construction is in the pipeline within 1–3 miles? Heavy new supply (>2% of stock underway) typically softens rents 12–24 months out; light construction supports rent growth.
Investment metrics
- 1% rule
- 0.88% ✗
- Cap rate
- 6.90%
- Cash-on-cash
- 2.17%
- DSCR
- 1.10
- GRM
- 9.4
CMA / ARV
No comps found within radius.
Projected returns pro-forma
-3.0% appreciation · 2.63% rent growth · sell at horizon
- IRR
- -13.3%
- Equity multiple
- 0.52×
- Total profit
- $-69,908
- Equity at exit
- $78,279
- IRR
- -4.9%
- Equity multiple
- 0.68×
- Total profit
- $-46,340
- Equity at exit
- $45,392
Cash invested: $147,000 (down + closing). Projections, not guarantees.
Landlord ↔ Tenant lean methodology
- Overall (STATE)
- 83 Strongly Landlord-Friendly
- State Kentucky
- 83 Strongly Landlord-Friendly · R+16
- County
- — inherits STATE
- City
- — inherits STATE
ZIP-level market 40207
- Rents YoY
- 2.6%
- Active inventory
- 159
- Price-to-rent
- 28.3×
Monthly cashflow live
- Estimated rent
- $4,632 high interval (Pro) →
- Mortgage (P&I)
- −$2,753
- Tax from tax record
- −$421 /mo · $5,053/yr
- Insurance
- −$219
- HOA
- −$0
- Vacancy / Maint / Mgmt
- −$973
- Net cashflow
- $266
Break-even live
3-unit breakdown (identical units grouped — click to expand)
| Units | Beds | Baths | Est. rent |
|---|---|---|---|
| 3× units | 2 | 1 | $4,632 |
| #1 | 2 | 1 | $1,544 |
| #2 | 2 | 1 | $1,544 |
| #3 | 2 | 1 | $1,544 |
| Total (3 units) | $4,632 | ||
UW: 25.0% down · 7.5% · 30yr · 1.5% tax · 5.0% vac · 8.0% maint · 8.0% mgmt
Financing live
Cash to close
- Down payment
- $131,250
- Closing costs
- $15,750
- Reserves months
- —
- Total cash needed
- —
Loan-product check · same deal, 3 products live
Conventional
25% down · 7.5% · 30yr
- Down + closing
- —
- Monthly P&I
- —
- Monthly cashflow
- —
- DSCR
- —
- Eligible?
- —
Personal DTI + credit; lowest rate.
DSCR
20% down · 8.5% · 30yr
- Down + closing
- —
- Monthly P&I
- —
- Monthly cashflow
- —
- DSCR
- —
- Eligible?
- —
No personal income docs; deal must DSCR.
Hard money
10% down · 12.0% · 12mo
- Down + closing
- —
- Monthly P&I
- —
- Monthly cashflow
- —
- DSCR
- —
- Eligible?
- —
Short-term bridge; refi at stabilization.
Rent comps 3 comps
| Address | Beds | Baths | Sqft | Rent | $/sqft | DOM | Units | Dist |
|---|---|---|---|---|---|---|---|---|
| 402 Trinity Hills Ln Louisville, KY | 3.0 | 2.5 | 2420 | $2,900 | $1.20 | 16d | 1 | 0.44mi |
| 3342 Dayton Ave Louisville, KY | 3.0 | 2.0 | 3164 | $2,850 | $0.90 | 21d | 1 | 1.15mi |
| 3342 Dayton Ave Louisville, KY | 3.0 | 2.0 | 3164 | $2,850 | $0.90 | 3d | 1 | 1.15mi |
Listing history 5 events
-
2026-04-26status Pending
-
2026-04-24historical Active Under Contract
-
2026-04-23$525,000 Active
-
2026-04-23historical
-
2026-04-10$525,000 Active
ⓘ Source: listings_history table (triggers on properties + properties_extension) + one-shot
backfill from property_details.listing_events for pre-trigger history.
Tax reassessment forecast KY · Resets to sale price
- Current annual tax
- $5,053 · $421/mo
- Projected year-2 tax
- $5,053 · $421/mo
- Expected delta
- $0/yr ($0/mo · 0.0%)
ⓘ Screening estimate from a state-policy table — verify with the county assessor before closing.
Climate risk First Street
- Flood 6/10 Major FEMA zone X (unshaded) · 71% chance over 30 yrs
- Wildfire 1/10 Low
- Heat 5/10 Major 7 d/yr ≥105°F today · 20 d/yr by 30 yrs out
- Wind 2/10 Low 2% chance of damaging wind over 30 yrs
- Air quality 3/10 Moderate 2 unhealthy d/yr today · 3 by 30 yrs out
Nearby sold comps map
Loading sold comps map…
Walkable amenities ~0.75 mi
Loading nearby amenities…
Taxation est. · year 1
- Rental income
- $55,584
- − Mortgage interest
- −$29,408
- − Property taxes
- −$5,053
- − Insurance
- −$2,625
- − Repairs & maintenance
- −$4,447
- − Management
- −$4,447
- − Depreciation
- −$15,273
- Taxable loss
- −$5,669
- Est. tax savings @ 24.0%
- +$1,361
- After-tax cash flow
- $4,556/yr
For passive investors: Depreciation is non-cash, so a rental often shows a tax loss while cash-flowing — sheltering income. Rental losses are passive: they offset passive income freely, and up to $25,000/yr can offset ordinary (W-2) income if you actively participate and your MAGI is under $100k (phasing out to $0 by $150k); unused losses carry forward. On sale, claimed depreciation is recaptured at up to 25%, and gains may owe capital-gains tax (a 1031 exchange can defer both). Figures are a year-1 estimate at your 24.0% rate — not tax advice; consult a CPA.
Schools (NCES district)
- District
- Jefferson County
- NCES district ID
- 2102990
- Math proficiency
- 19% ▼ -17.00%
- Reading proficiency
- 35% ▼ -11.00%
- Median HH income
- $47,885
- Composite
- 23.45/100
- National rank
- #7884
- State rank
- #121 of 165 in KY
Livability — St. Matthews
No livability data for this city. (Only ~50 U.S. cities are tracked.)
Census & demographics
- Census place
- St. Matthews, KY
- County
- Jefferson County · 790,184 people
- City population
- 50,267
- Metro
- Louisville/Jefferson County, KY-IN
- Population (ZIP)
- 28,903
- Household income
- $101,898
- Rent vs Own
- Severe rent burden
- 751.0
Population outlook (Jefferson County) Hauer SSP2
- Today (2025)
- 823,112 people
- By 2030
- 849,343 · +3.2%
- By 2040
- 895,696 · +8.8%
- By 2050
- 933,630 · +13.4%
- By 2075
- 1,028,262 · +24.9%
- By 2100
- 1,072,675 · +30.3%
Race, ethnicity, and origin ACS 2023
- Neighborhood character
- Predominantly White (88%)
- Race & ethnicity
- White 88% Two or more races 4% Black 3% Asian 3% Hispanic / Latino 3%
- Common ancestry
- Italian 3% Lithuanian 3% Slovak 2%
- Foreign-born
- 5% · Canada, China, South Korea
- Languages at home
- 95% English-only · Spanish 1% Other Indo-European 1% German/W. Germanic 1%
Political lean MEDSL · Jefferson
- 2024 margin
- D (+16.6) · D 57.4% · R 40.9% · Other 1.7%
- 2008→2024 swing
- +4.5pp toward D · 2008: 12.0pp · 2024: 16.6pp
- All cycles
- 2024: D+16.6 2020: D+20.1 2016: D+13.3 2012: D+11.1 2008: D+12.0
Not yet ingested
- Civics
- —
Market trends
- HPI YoY
- ▼ -335.02%
- Current HPI
- 220.6522
- Rent YoY
- ▲ 2.63%
- Metro
- Louisville/Jefferson County, KY-IN
- State GDP YoY
- ▲ 1.81%
- F500 in state
- 4
Industry mix (Fortune 500 HQ in KY)
| Industry | F500 HQs | Revenue |
|---|---|---|
| Healthcare | 1 | $118B |
|
||
| Food / Beverage | 1 | $7B |
|
||
Price history
+0.0% since first listed5 events — show timeline
- 2026-04-26 Pending — Metro Search MLS
- 2026-04-24 Contingent — Metro Search MLS
- 2026-04-23 Listing Removed — Metro Search MLS
- 2026-04-23 Listed $525,000 Metro Search MLS
- 2026-04-10 Listed $525,000 Metro Search MLS
Property tax history
+8.3%/yrLatest (2025): $5,053 · +1.0% YoY. Source: county tax records.
Cash-flow waterfall
monthlySold comps — $/sqft
last 12 mo · ≤1 miLoading sold comps…