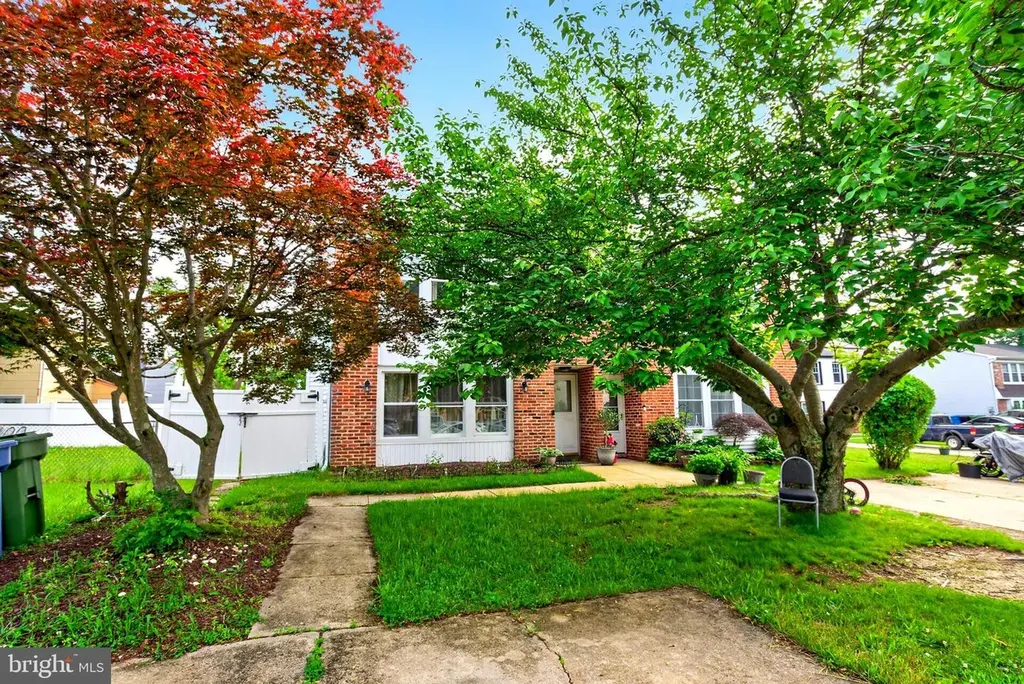
46 Ptolemy Ct · Turnersville, NJ
Flood risk 1/10 · Minimal
- FEMA flood zone
- X (unshaded)
- Chance of flooding over 30 yrs
- 0.0%
- Est. flood insurance / yr
- $507 – $1,088
Fire risk 2/10 · Minimal
- Est. fire insurance / yr
- $526 – $976
Heat risk 7/10 · Major
- Hot days now (above 102°F)
- 7 days/yr
- Hot days in 30 yrs
- 15 days/yr
Wind risk 6/10 · Moderate
- Chance of severe wind over 30 yrs
- 62.0%
Air-quality risk 3/10 · Minor
- Unhealthy air days now
- 2 days/yr
- Unhealthy air days in 30 yrs
- 5 days/yr
Risk factors via First Street. Map © Google.
Why this score? — see what drove the D grade
The composite is a weighted blend of 9 inputs, each scored 0–100. Each bar is that input's sub-score; the figure is the points it added to the 100-point composite (weight × sub-score).
- Cash flow +12.7/30.0
- ARV discount +9.8/15.0
- 1% rule +3.8/10.0
- DSCR +3.8/10.0
- Livability +3.6/5.0
- Schools +3.3/10.0
- Rent growth +2.5/5.0
- Condition / age +2.5/5.0
- Appreciation +0.0/10.0
$295,000
🖨 Deal sheet 📄 Offer letter ✓ Due diligence
Listing remarks
Welcome to this spacious expanded twin tucked away on a quiet cul-de-sac! Offering 3 bedrooms and 1.5 baths, this home has plenty of room to spread out and enjoy. The highlight of the home is the large sunroom addition, creating the perfect space to relax with your morning coffee, entertain friends and family, or simply enjoy the natural light all year long. The home's layout is both comfortable and functional, making everyday living easy. Conveniently located near shopping, dining, parks, and major roadways, this home offers a great combination of space, comfort, and location. Whether you're a first-time buyer or looking for a place to make your own, this is one you won't want to miss.
Key facts
- Near dining
- Quiet cul-de-sac
- Near shopping
Tags
Property features AI
Finance
- Other: Pets allowed with no pet restrictions
Exterior
- Parking: Driveway
- Utilities: Public water; Public sewer; Electric cooling fuel; Natural gas heating fuel
- Home design: Semi-detached property; Fee simple ownership
- Construction: Frame construction; Slab foundation; Other structures noted above and below grade; Year built reported as estimated
- Exterior features: Lot dimensions approximately 30 x 116
Interior
- Bedrooms: Three bedrooms on the first upper level
- Bathrooms: One full bathroom (all upper levels); One half bathroom on the main level
- Heating & cooling: Forced air heating; Central air conditioning; Electric hot water
- Interior features: No basement; Finished above-grade living area reported by assessor
Neighborhood map
What this means for you Summary
Snapshot
- This is a 3-bed/1.5-bath townhouse listed at $295k.
Deal economics
- At list price, monthly cash flow is $-32 ($-389/yr) — negative.
- To cash-flow at today's rent, offer at most $289k (1.9% below list).
- To meet the 1% rule (rent ≥ 1% of price), the offer needs to be $259k (12.3% below list).
- Recommended offer: $259k (12.3% below list) — sets the bar for 1% rule.
- Cap rate 6.2% vs local median 3.0% in Turnersville — top-decile yield for the area; either an underpriced asset or a hidden risk that comps aren't pricing in. Stress-test before assuming the spread holds.
Location & tenants
- Location reads 71/100 on livability (#246 in NJ) — a middle-class / working-renter tenant base. Strengths: crime A+, employment A+, housing A+; Watch: amenities F, commute F, cost of living F.
- Washington Township School District (suburban): math 21% / reading 49% proficiency, ranked #257 of 472 in NJ (top 54%) — families likely to look elsewhere, expect single-tenant / working-renter base with shorter leases; only 15% free/reduced lunch — higher-income household profile.
- Market conditions: 143 active listings in the ZIP; 5 comparable units currently listed for rent nearby; rentals leasing fast (median 13d on market — plan ~1-2 weeks tenant-placement turnaround); high-income renter base; 1,047 units permitted in Gloucester County in 2024 (183 in 5+ unit buildings).
Forward outlook
- Local home prices are declining (-3.0%/yr); year-one equity from $2k of loan paydown is wiped out by about $9k of value loss. Plan a longer hold.
- Gloucester County population projected to shrink 5% by 2050 — rents likely to lag national; underwrite the cash flow, not the appreciation.
Negotiation context
- Only 4 days on market — expect competitive offers; lowballing is unlikely to land.
- 5 sale attempts since 20y ago with the ask held roughly flat each time — persistent listings suggest the price (not the market) is what's stuck; bring a comps-based counter.
- Current owner paid $235k; 26% above their basis — modest negotiation headroom, anchor on the comps not their cost.
Risks & watch-outs
- Climate carrying-cost: major wind risk, 62% chance of damaging wind over 30y; extreme-heat days projected 7→15/yr by 2055 (HVAC capex compounding) — expect insurance premiums to compound above CPI over the hold.
Questions for the listing agent
- What do current leases actually rent for vs. the listed asking? Can we see a recent rent roll and the last 12 months of T-12 income?
- Is there a deadline driving the sale (1031 exchange, divorce, estate, relocation)? That informs how much negotiation room exists.
- Schools are B-rated — typically a magnet for longer-tenancy family renters. What's the average tenant stay here, and is there a school-zone premium baked into asking?
- The area grade is low — what's the realistic commute time and amenity access for the typical tenant pool here? Any planned neighborhood developments (good or bad) we should know about?
- What's the average days-on-market for RENTAL listings here right now (not sales)? A rising rental-DOM trend means longer vacancies and softer asking-rent achievability than the comps imply.
- What's the recent tenant-quality profile in this submarket — average credit score on applications, eviction rate, late-payment / NSF rate, and stable-employment percentage? A property-management company in the area should have these aggregated.
- How much new for-sale + rental construction is in the pipeline within 1–3 miles? Heavy new supply typically softens prices + rents 12–24 months out; constrained supply supports both.
Investment metrics
- 1% rule
- 0.88% ✗
- Cap rate
- 6.16%
- Cash-on-cash
- -0.47%
- DSCR
- 0.98
- GRM
- 9.5
CMA / ARV
- ARV (on-the-fly)
- $310,648
- Comps found
- 12
Show comp detail 12 sales within ~0.75 mi
| Address | Dist | Beds/Ba | Sqft | Sold | Price | $/sf | Match |
|---|---|---|---|---|---|---|---|
| 1 Corvas Ct | 0.05mi | 3/1.5 | 1,508 (0%) | 2mo | $335,000 | $222 | 96 |
| 19 Ptolemy Ct | 0.06mi | 3/1.5 | 1,508 (0%) | 4mo | $290,000 | $192 | 93 |
| 4 Corvas Ct | 0.06mi | 3/1.5 | 1,508 (0%) | 5mo | $312,000 | $207 | 92 |
| 2 Procyon Rd | 0.23mi | 3/1.5 | 1,578 (+5%) | 3mo | $209,900 | $133 | 79 |
| 41 Sirius Ct | 0.27mi | 3/1.5 | 1,570 (+4%) | 3mo | $295,000 | $188 | 78 |
| 41 Fomalhaut Ave | 0.27mi | 3/1.5 | 1,578 (+5%) | 2mo | $351,000 | $222 | 78 |
| 24 Fomalhaut Ave | 0.27mi | 3/1.5 | 1,578 (+5%) | 8mo | $294,000 | $186 | 73 |
| 11 Fomal Ct | 0.16mi | 3/1.0 | 1,360 (-10%) | 2mo | $280,000 | $206 | 73 |
| 109 Fomalhaut Ave | 0.18mi | 3/1.5 | 1,352 (-10%) | 4mo | $289,900 | $214 | 71 |
| 29 Hamal Ct | 0.23mi | 3/1.0 | 1,360 (-10%) | 2mo | $193,000 | $142 | 69 |
| 46 Fomalhaut Ave | 0.24mi | 3/1.5 | 1,650 (+9%) | 10mo | $317,000 | $192 | 65 |
| 1606 Hawthorne Ct | 0.73mi | 2/2.0 (-1) | 1,374 (-9%) | 6mo | $305,000 | $222 | 39 |
Match score weights: distance 35% · size 25% · config 20% · recency 20%. Top-matched comps best support the ARV.
Projected returns pro-forma
-3.0% appreciation · 3.0% rent growth · sell at horizon
- IRR
- -17.1%
- Equity multiple
- 0.40×
- Total profit
- $-49,806
- Equity at exit
- $43,985
- IRR
- -8.9%
- Equity multiple
- 0.45×
- Total profit
- $-45,779
- Equity at exit
- $25,506
Cash invested: $82,600 (down + closing). Projections, not guarantees.
Landlord ↔ Tenant lean methodology
- Overall (STATE)
- 21 Tenant-Leaning
- State New Jersey
- 21 Tenant-Leaning · D+6
- County
- — inherits STATE
- City
- — inherits STATE
ZIP-level market 08080
- Home prices YoY
- -33.2%
- Active inventory
- 143
- Price-to-rent
- 9.5×
Monthly cashflow live
- Estimated rent
- $2,587 high interval (Pro) →
- Mortgage (P&I)
- −$1,547
- Tax from tax record
- −$406 /mo · $4,873/yr
- Insurance
- −$123
- HOA
- −$0
- Vacancy / Maint / Mgmt
- −$543
- Net cashflow
- $-32
Break-even live
UW: 25.0% down · 7.5% · 30yr · 1.5% tax · 5.0% vac · 8.0% maint · 8.0% mgmt
Financing live
Cash to close
- Down payment
- $73,750
- Closing costs
- $8,850
- Reserves months
- —
- Total cash needed
- —
Loan-product check · same deal, 3 products live
Conventional
25% down · 7.5% · 30yr
- Down + closing
- —
- Monthly P&I
- —
- Monthly cashflow
- —
- DSCR
- —
- Eligible?
- —
Personal DTI + credit; lowest rate.
DSCR
20% down · 8.5% · 30yr
- Down + closing
- —
- Monthly P&I
- —
- Monthly cashflow
- —
- DSCR
- —
- Eligible?
- —
No personal income docs; deal must DSCR.
Hard money
10% down · 12.0% · 12mo
- Down + closing
- —
- Monthly P&I
- —
- Monthly cashflow
- —
- DSCR
- —
- Eligible?
- —
Short-term bridge; refi at stabilization.
Rent comps 5 comps
| Address | Beds | Baths | Sqft | Rent | $/sqft | DOM | Units | Dist |
|---|---|---|---|---|---|---|---|---|
| 22 Fomalhaut Ct Blackwood, NJ | 3.0 | 1.5 | 1508 | $2,310 | $1.53 | 13d | 1 | 0.20mi |
| 620 Covington Ct Sewell, NJ | 2.0 | 2.0 | 1086 | $2,250 | $2.07 | 13d | 1 | 0.96mi |
| 656 Covington Ct Sewell, NJ | 2.0 | 2.0 | 1086 | $2,200 | $2.03 | 13d | 1 | 1.01mi |
| 339 Georgia Ct Sewell, NJ | 2.0 | 2.0 | 1488 | $2,600 | $1.75 | 13d | 1 | 1.12mi |
| 100 Town Center Blvd Sewell, NJ | 1.0–2.0 | 1.0–2.0 | 1107 | $3,130 | $2.83 | 1d | 16 | 1.17mi |
Listing history 3 events
-
2026-06-07statusdays on market $295,000 Pending 4 DOM
-
2026-06-02remarks 695-char remark
-
2026-06-02$295,000 Active 1 DOM
ⓘ Source: listings_history table (triggers on properties + properties_extension) + one-shot
backfill from property_details.listing_events for pre-trigger history.
Tax reassessment forecast NJ · Partial reset (capped growth)
- Current annual tax
- $4,873 · $406/mo
- Projected year-2 tax
- $6,109 · $509/mo
- Expected delta
- +$1,236/yr (+$103/mo · 25.4%)
ⓘ Screening estimate from a state-policy table — verify with the county assessor before closing.
Climate risk First Street
- Flood 1/10 Low FEMA zone X (unshaded) · 0% chance over 30 yrs
- Wildfire 2/10 Low
- Heat 7/10 Severe 7 d/yr ≥102°F today · 15 d/yr by 30 yrs out
- Wind 6/10 Major 62% chance of damaging wind over 30 yrs
- Air quality 3/10 Moderate 2 unhealthy d/yr today · 5 by 30 yrs out
Nearby sold comps map
Loading sold comps map…
Walkable amenities ~0.75 mi
Loading nearby amenities…
Taxation est. · year 1
- Rental income
- $31,041
- − Mortgage interest
- −$16,525
- − Property taxes
- −$4,873
- − Insurance
- −$1,475
- − Repairs & maintenance
- −$2,483
- − Management
- −$2,483
- − Depreciation
- −$8,582
- Taxable loss
- −$5,379
- Est. tax savings @ 24.0%
- +$1,291
- After-tax cash flow
- $902/yr
For passive investors: Depreciation is non-cash, so a rental often shows a tax loss while cash-flowing — sheltering income. Rental losses are passive: they offset passive income freely, and up to $25,000/yr can offset ordinary (W-2) income if you actively participate and your MAGI is under $100k (phasing out to $0 by $150k); unused losses carry forward. On sale, claimed depreciation is recaptured at up to 25%, and gains may owe capital-gains tax (a 1031 exchange can defer both). Figures are a year-1 estimate at your 24.0% rate — not tax advice; consult a CPA.
Schools (NCES district)
- District
- Washington Township School District
- NCES district ID
- 3417070
- Math proficiency
- 21% ▼ -19.00%
- Reading proficiency
- 49% ▼ -1.00%
- Median HH income
- $83,707
- Composite
- 33.46/100
- National rank
- #5456
- State rank
- #257 of 472 in NJ
Livability — Turnersville
- Score
- 71/100
- State rank
- #246
- US rank
- #6866
Category grades
Schools grade is shown separately in the Schools card above.
Census & demographics
- County
- Gloucester County · 160,422 people
- Metro
- Philadelphia-Camden-Wilmington, PA-NJ-DE-MD
- Population (ZIP)
- 38,159
- Household income
- $122,262
- Rent vs Own
- Severe rent burden
- 637.0
Population outlook (Gloucester County) Hauer SSP2
- Today (2025)
- 298,895 people
- By 2030
- 299,031 · +0.0%
- By 2040
- 294,020 · -1.6%
- By 2050
- 284,188 · -4.9%
- By 2075
- 260,720 · -12.8%
- By 2100
- 229,565 · -23.2%
Race, ethnicity, and origin ACS 2023
- Neighborhood character
- Predominantly White (82%)
- Race & ethnicity
- White 82% Black 6% Hispanic / Latino 5% Two or more races 5% Asian 4%
- Common ancestry
- Romanian 6% Slovak 2% Lithuanian 1%
- Foreign-born
- 5% · Canada, South Korea
- Languages at home
- 91% English-only · Spanish 3% Other Indo-European 2% Tagalog/Filipino 1%
Political lean MEDSL · Gloucester
- 2024 margin
- Toss-up / Even · D 47.8% · R 50.6% · Other 1.6%
- 2008→2024 swing
- -15.0pp toward R · 2008: 12.2pp · 2024: -2.8pp
- All cycles
- 2024: R+2.8 2020: D+1.9 2016: R+0.4 2012: D+10.5 2008: D+12.2
Not yet ingested
- Civics
- —
Market trends
- HPI YoY
- ▼ -152.50%
- Current HPI
- 306.2983
- Rent YoY
- —
- Metro
- Philadelphia-Camden-Wilmington, PA-NJ-DE-MD
- State GDP YoY
- ▲ 2.05%
- F500 in state
- 34
Industry mix (Fortune 500 HQ in NJ)
| Industry | F500 HQs | Revenue |
|---|---|---|
| Consumer Goods | 3 | $31B |
|
||
| Pharmaceuticals | 2 | $153B |
|
||
| Technology | 2 | $21B |
|
||
| Insurance | 2 | $20B |
|
||
| Healthcare | 2 | $19B |
|
||
| Financial Services | 1 | $70B |
|
||
Price history
+668.2% since first listed16 events — show timeline
- 2026-06-01 Listed $295,000 BRIGHT MLS
- 2023-07-06 Sold (Public Records) $235,000 Public Records
- 2023-06-30 Sold (MLS) $235,000 BRIGHT MLS
- 2023-06-26 Pending — BRIGHT MLS
- 2023-06-10 Contingent — BRIGHT MLS
- 2023-06-05 Price Changed $225,000 BRIGHT MLS
- 2023-05-20 Price Changed $230,000 BRIGHT MLS
- 2023-05-20 Relisted — BRIGHT MLS
- 2023-05-19 Contingent — BRIGHT MLS
- 2023-05-15 Listed $225,000 BRIGHT MLS
- 2013-07-25 Listing Removed — BRIGHT MLS
- 2013-04-06 Listed $129,211 BRIGHT MLS
- 2006-12-15 Sold (MLS) $140,000 BRIGHT MLS
- 2006-11-03 Listing Removed — BRIGHT MLS
- 2006-07-31 Listed $140,000 BRIGHT MLS
- 1979-01-01 Sold (Public Records) $38,400 Public Records
Property tax history
+1.4%/yrLatest (2025): $4,873 · +4.3% YoY. Source: county tax records.
Cash-flow waterfall
monthlySold comps — $/sqft
last 12 mo · ≤1 miLoading sold comps…