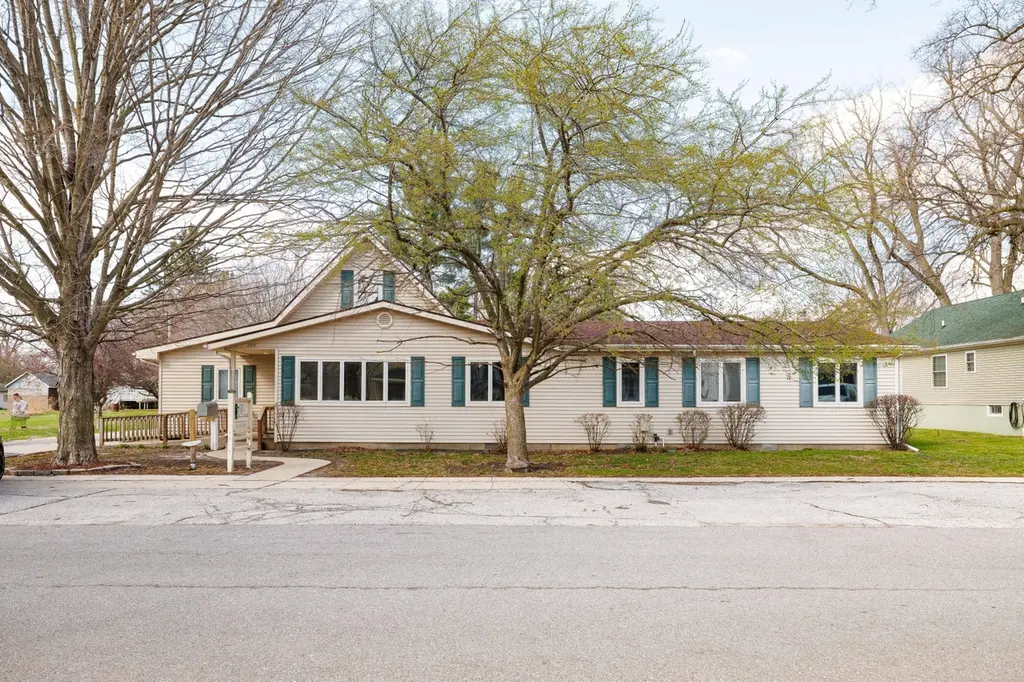
310 E Lincoln St · Kentland, IN
Flood risk 7/10 · Major
- FEMA flood zone
- X (unshaded)
- Chance of flooding over 30 yrs
- 0.96%
- Est. flood insurance / yr
- $507 – $1,088
Fire risk 1/10 · Minimal
- Est. fire insurance / yr
- $717 – $1,331
Heat risk 3/10 · Minor
- Hot days now (above 103°F)
- 7 days/yr
- Hot days in 30 yrs
- 17 days/yr
Wind risk 2/10 · Minimal
- Chance of severe wind over 30 yrs
- —
Air-quality risk 2/10 · Minimal
- Unhealthy air days now
- 2 days/yr
- Unhealthy air days in 30 yrs
- 2 days/yr
Risk factors via First Street. Map © Google.
Why this score? — see what drove the D grade
The composite is a weighted blend of 9 inputs, each scored 0–100. Each bar is that input's sub-score; the figure is the points it added to the 100-point composite (weight × sub-score).
- ARV discount +15.0/15.0
- Appreciation +10.0/10.0
- Cash flow +5.1/30.0
- Livability +3.4/5.0
- Schools +2.8/10.0
- Rent growth +2.5/5.0
- Condition / age +2.5/5.0
- 1% rule +1.2/10.0
- DSCR +0.0/10.0
$175,000
🖨 Deal sheet 📄 Offer letter ✓ Due diligence
Listing remarks MLS
Opportunity is knocking at 310 E. Lincoln St. , Kentland! Packed with character, space, and endless potential, this one-of-a-kind 3,129 sq. ft. property offers a rare chance to bring your vision to life. Formerly operated as a dentist office, this versatile property is now ready for its next chapter--whether that means creating a spacious single-family home, converting into an income-producing multi-unit investment, or launching the business venture you've been dreaming about. The residential portion offers 1,766 sq. ft. of living space featuring 3 bedrooms, 1 full bath, 1.5 half baths, a cozy fireplace, and a sprawling deck perfect for relaxing or entertaining. Attached to the home is an additional 1,363 sq. ft. office space, opening the door to a wide range of residential, rental, or commercial possibilities. Outside, the value continues with a 2-car detached garage, front parking, and an additional paved parking lot accessible from the rear of the property--a major bonus for business use, tenants, or guests. Whether you're an entrepreneur, investor, or buyer with a creative eye, this property is full of potential, flexibility, and opportunity in a prime Kentland location. Live in it. Rent it. Work from it. Reimagine it. 310 E. Lincoln St. is the blank canvas you've been waiting for.
Key facts
- Office space
- Paved parking lot
- Sprawling deck
Tags
Neighborhood map
What this means for you Summary
Snapshot
- This is a 3-bed/1.5-bath single-family listed at $175k.
Deal economics
- At list price, monthly cash flow is $-470 ($-6k/yr) — negative.
- To cash-flow at today's rent, offer at most $92k (47.5% below list).
- To meet the 1% rule (rent ≥ 1% of price), the offer needs to be $108k (38.2% below list).
- Recommended offer: $92k (47.5% below list) — sets the bar for cash-flow.
Location & tenants
- Location reads 67/100 on livability (#265 in IN) — a middle-class / working-renter tenant base. Strengths: crime A+, cost of living A+, housing A; Watch: schools D, amenities F, commute F.
- South Newton School Corporation (rural): math 29% / reading 35% proficiency, ranked #219 of 301 in IN (top 73%) — families likely to look elsewhere, expect single-tenant / working-renter base with shorter leases.
- Market conditions: 24 active listings in the ZIP; 24 units permitted in Newton County in 2024 (0 in 5+ unit buildings).
Forward outlook
- In year one you build about $19k of equity ($1k loan paydown + $18k appreciation (10.0% local appreciation)).
- Newton County population projected at -12% by 2050 — secular population decline; favor cash flow + early exit over multi-decade hold.
- By year 2, paydown + projected appreciation supports a ~$30k cash-out refi (75% LTV) — recoverable capital for the next deal without selling this one.
Negotiation context
- It's been on market 68 days — a 6% lower offer ($164k) is reasonable based on typical stale-listing flexibility.
Risks & watch-outs
- Watch-outs: flood insurance adds $66/mo.
- Climate carrying-cost: major flood risk — expect insurance premiums to compound above CPI over the hold.
Questions for the listing agent
- What do current leases actually rent for vs. the listed asking? Can we see a recent rent roll and the last 12 months of T-12 income?
- It's been on market 68 days. Have you received any prior offers? Is the seller open to a 47% concession, seller financing, or rate buy-down credit?
- Built in 1970 — when were the roof, HVAC, electrical panel, plumbing, and water heater last replaced?
- What's the actual annual flood-insurance premium (NFIP or private), and is the property in a SFHA with mandatory coverage?
- Why hasn't it sold? Are there any deal-killer items the seller is aware of (foundation, flood, title, zoning, code violations)?
- Is there a deadline driving the sale (1031 exchange, divorce, estate, relocation)? That informs how much negotiation room exists.
- Schools are D-rated, which usually means shorter tenancies and higher turnover. Who's the typical renter profile here, and what's been the actual vacancy rate?
- The area grade is low — what's the realistic commute time and amenity access for the typical tenant pool here? Any planned neighborhood developments (good or bad) we should know about?
- What's the average days-on-market for RENTAL listings here right now (not sales)? A rising rental-DOM trend means longer vacancies and softer asking-rent achievability than the comps imply.
- What's the recent tenant-quality profile in this submarket — average credit score on applications, eviction rate, late-payment / NSF rate, and stable-employment percentage? A property-management company in the area should have these aggregated.
- How much new for-sale + rental construction is in the pipeline within 1–3 miles? Heavy new supply typically softens prices + rents 12–24 months out; constrained supply supports both.
Investment metrics
- 1% rule
- 0.62% ✗
- Cap rate
- 3.52%
- Cash-on-cash
- -9.89%
- DSCR
- 0.56
- GRM
- 13.5
CMA / ARV
- ARV (median comp)
- $213,497
- List price
- $175,000
- Delta
- -18.03%
- Verdict
- UNDERPRICED
- Comps
- 13 within 1.0 mi
Show comp detail 3 sales within ~0.75 mi
| Address | Dist | Beds/Ba | Sqft | Sold | Price | $/sf | Match |
|---|---|---|---|---|---|---|---|
| 313 E Graham St | 0.32mi | 3/1.5 | 3,040 (-3%) | 4mo | $206,000 | $68 | 78 |
| 111 E Graham St | 0.37mi | 4/2.0 (+1) | 3,060 (-2%) | 7mo | $148,500 | $49 | 66 |
| 307 E Carroll St | 0.17mi | 4/1.0 (+1) | 2,820 (-10%) | 22mo | $199,500 | $71 | 50 |
Match score weights: distance 35% · size 25% · config 20% · recency 20%. Top-matched comps best support the ARV.
Projected returns pro-forma
10.0% appreciation · 3.0% rent growth · sell at horizon
- IRR
- 16.2%
- Equity multiple
- 2.34×
- Total profit
- $65,450
- Equity at exit
- $157,654
- IRR
- 15.6%
- Equity multiple
- 5.42×
- Total profit
- $216,462
- Equity at exit
- $339,987
Cash invested: $49,000 (down + closing). Projections, not guarantees.
Landlord ↔ Tenant lean methodology
- Overall (STATE)
- 90 Strongly Landlord-Friendly
- State Indiana
- 90 Strongly Landlord-Friendly · R+11
- County
- — inherits STATE
- City
- — inherits STATE
ZIP-level market 47951
- Home prices YoY
- 11.4%
- Active inventory
- 24
- Price-to-rent
- 13.5×
Monthly cashflow live
- Estimated rent
- $1,081 medium interval (Pro) →
- Mortgage (P&I)
- −$918
- Tax from tax record
- −$267 /mo · $3,207/yr
- Insurance
- −$73
- Flood insurance flood zone
- −$66 /mo · $798/yr
- HOA
- −$0
- Vacancy / Maint / Mgmt
- −$227
- Net cashflow
- $-470
Break-even live
UW: 25.0% down · 7.5% · 30yr · 1.5% tax · 5.0% vac · 8.0% maint · 8.0% mgmt
Financing live
Cash to close
- Down payment
- $43,750
- Closing costs
- $5,250
- Reserves months
- —
- Total cash needed
- —
Loan-product check · same deal, 3 products live
Conventional
25% down · 7.5% · 30yr
- Down + closing
- —
- Monthly P&I
- —
- Monthly cashflow
- —
- DSCR
- —
- Eligible?
- —
Personal DTI + credit; lowest rate.
DSCR
20% down · 8.5% · 30yr
- Down + closing
- —
- Monthly P&I
- —
- Monthly cashflow
- —
- DSCR
- —
- Eligible?
- —
No personal income docs; deal must DSCR.
Hard money
10% down · 12.0% · 12mo
- Down + closing
- —
- Monthly P&I
- —
- Monthly cashflow
- —
- DSCR
- —
- Eligible?
- —
Short-term bridge; refi at stabilization.
Listing history 15 events
-
2026-06-18days on market $175,000 Active 68 DOM
-
2026-06-17days on market $175,000 Active 67 DOM
-
2026-06-16days on market $175,000 Active 66 DOM
-
2026-06-15days on market $175,000 Active 65 DOM
-
2026-06-13days on market $175,000 Active 63 DOM
-
2026-06-12days on market $175,000 Active 62 DOM
-
2026-06-09days on market $175,000 Active 59 DOM
-
2026-06-08days on market $175,000 Active 58 DOM
-
2026-06-07days on market $175,000 Active 57 DOM
-
2026-06-04days on market $175,000 Active 53 DOM
-
2026-06-02days on market $175,000 Active 52 DOM
-
2026-06-01days on market $175,000 Active 51 DOM
-
2026-05-31days on market $175,000 Active 50 DOM
-
2026-05-31days on market $175,000 Active 49 DOM
-
2026-04-11$175,000 Active 1307-char remark
Show marketing remark (1307 chars)
Opportunity is knocking at 310 E. Lincoln St. , Kentland! Packed with character, space, and endless potential, this one-of-a-kind 3,129 sq. ft. property offers a rare chance to bring your vision to life. Formerly operated as a dentist office, this versatile property is now ready for its next chapter--whether that means creating a spacious single-family home, converting into an income-producing multi-unit investment, or launching the business venture you've been dreaming about. The residential portion offers 1,766 sq. ft. of living space featuring 3 bedrooms, 1 full bath, 1.5 half baths, a cozy fireplace, and a sprawling deck perfect for relaxing or entertaining. Attached to the home is an additional 1,363 sq. ft. office space, opening the door to a wide range of residential, rental, or commercial possibilities. Outside, the value continues with a 2-car detached garage, front parking, and an additional paved parking lot accessible from the rear of the property--a major bonus for business use, tenants, or guests. Whether you're an entrepreneur, investor, or buyer with a creative eye, this property is full of potential, flexibility, and opportunity in a prime Kentland location. Live in it. Rent it. Work from it. Reimagine it. 310 E. Lincoln St. is the blank canvas you've been waiting for.
ⓘ Source: listings_history table (triggers on properties + properties_extension) + one-shot
backfill from property_details.listing_events for pre-trigger history.
Tax reassessment forecast IN · Partial reset (capped growth)
- Current annual tax
- $3,207 · $267/mo
- Projected year-2 tax
- $3,207 · $267/mo
- Expected delta
- $0/yr ($0/mo · 0.0%)
ⓘ Screening estimate from a state-policy table — verify with the county assessor before closing.
Climate risk First Street
- Flood 7/10 Severe FEMA zone X (unshaded) · 96% chance over 30 yrs
- Wildfire 1/10 Low
- Heat 3/10 Moderate 7 d/yr ≥103°F today · 17 d/yr by 30 yrs out
- Wind 2/10 Low
- Air quality 2/10 Low 2 unhealthy d/yr today · 2 by 30 yrs out
Nearby sold comps map
Loading sold comps map…
Walkable amenities ~0.75 mi
Loading nearby amenities…
Taxation est. · year 1
- Rental income
- $12,975
- − Mortgage interest
- −$9,803
- − Property taxes
- −$3,207
- − Insurance
- −$1,672
- − Repairs & maintenance
- −$1,038
- − Management
- −$1,038
- − Depreciation
- −$5,091
- Taxable loss
- −$8,875
- Est. tax savings @ 24.0%
- +$2,130
- After-tax cash flow
- $-3,512/yr
For passive investors: Depreciation is non-cash, so a rental often shows a tax loss while cash-flowing — sheltering income. Rental losses are passive: they offset passive income freely, and up to $25,000/yr can offset ordinary (W-2) income if you actively participate and your MAGI is under $100k (phasing out to $0 by $150k); unused losses carry forward. On sale, claimed depreciation is recaptured at up to 25%, and gains may owe capital-gains tax (a 1031 exchange can defer both). Figures are a year-1 estimate at your 24.0% rate — not tax advice; consult a CPA.
Schools (NCES district)
- District
- South Newton School Corporation
- NCES district ID
- 1810470
- Math proficiency
- 29% ▼ -18.00%
- Reading proficiency
- 35% ▼ -14.00%
- Median HH income
- $46,624
- Composite
- 27.52/100
- National rank
- #6952
- State rank
- #219 of 301 in IN
Livability — Kentland
- Score
- 67/100
- State rank
- #265
- US rank
- #11108
Category grades
Schools grade is shown separately in the Schools card above.
Census & demographics
- Census place
- Kentland, IN
- City population
- 2,246
- Population (ZIP)
- 2,246
Population outlook (Newton County) Hauer SSP2
- Today (2025)
- 13,726 people
- By 2030
- 13,448 · -2.0%
- By 2040
- 12,771 · -7.0%
- By 2050
- 12,104 · -11.8%
- By 2075
- 11,059 · -19.4%
- By 2100
- 9,813 · -28.5%
Race, ethnicity, and origin ACS 2023
- Neighborhood character
- Predominantly White (83%)
- Race & ethnicity
- White 83% Hispanic / Latino 8% Black 6% Two or more races 6%
- Hispanic origin (detail)
- Mexican 6%
- Common ancestry
- Lithuanian 3% Iranian 2% Romanian 1%
- Foreign-born
- 3% · Canada
- Languages at home
- 96% English-only · Spanish 4%
Political lean MEDSL · Newton
- 2024 margin
- Solid R (+57.0) · D 20.8% · R 77.7% · Other 1.5%
- 2008→2024 swing
- -45.8pp toward R · 2008: -11.2pp · 2024: -57.0pp
- All cycles
- 2024: R+57.0 2020: R+52.1 2016: R+46.1 2012: R+19.1 2008: R+11.2
Not yet ingested
- Civics
- —
Market trends
- HPI YoY
- ▲ 26.78%
- Current HPI
- 262.4146
- Rent YoY
- —
- Metro
- —
- State GDP YoY
- ▲ 2.90%
- F500 in state
- 18
Industry mix (Fortune 500 HQ in IN)
| Industry | F500 HQs | Revenue |
|---|---|---|
| Industrial Machinery | 2 | $37B |
|
||
| Healthcare | 1 | $177B |
|
||
| Pharmaceuticals | 1 | $45B |
|
||
| Metals / Steel | 1 | $18B |
|
||
| Agriculture | 1 | $17B |
|
||
| Packaging | 1 | $12B |
|
||
Price history
1 event — show timeline
- 2026-04-11 Listed $175,000 NIRA MLS as Distributed by MLS Grid
Property tax history
+1.8%/yrLatest (2024): $3,207 · -8.1% YoY. Source: county tax records.
Cash-flow waterfall
monthlySold comps — $/sqft
last 12 mo · ≤1 miLoading sold comps…