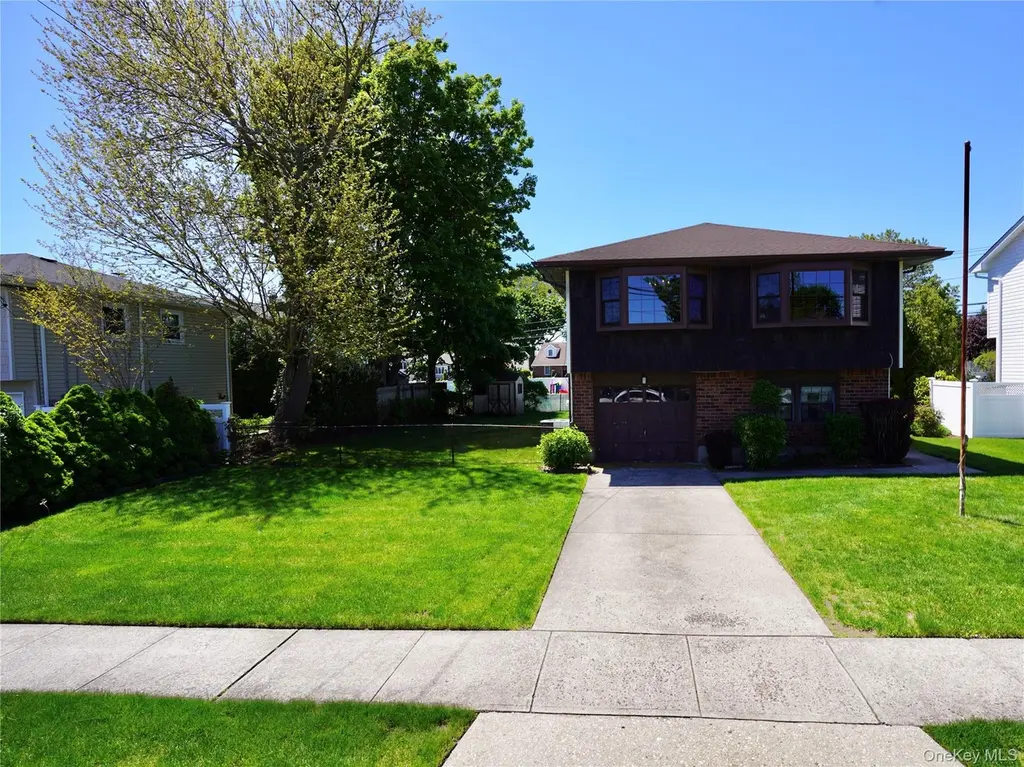
9 John St · Bethpage, NY
Flood risk 6/10 · Moderate
- FEMA flood zone
- X (unshaded)
- Chance of flooding over 30 yrs
- 0.71%
- Est. flood insurance / yr
- $473 – $860
Fire risk 1/10 · Minimal
- Est. fire insurance / yr
- $691 – $1,283
Heat risk 5/10 · Moderate
- Hot days now (above 95°F)
- 7 days/yr
- Hot days in 30 yrs
- 16 days/yr
Wind risk 6/10 · Moderate
- Chance of severe wind over 30 yrs
- 58.0%
Air-quality risk 4/10 · Minor
- Unhealthy air days now
- 3 days/yr
- Unhealthy air days in 30 yrs
- 5 days/yr
Risk factors via First Street. Map © Google.
Why this score? — see what drove the D grade
The composite is a weighted blend of 9 inputs, each scored 0–100. Each bar is that input's sub-score; the figure is the points it added to the 100-point composite (weight × sub-score).
- ARV discount +15.0/15.0
- Cash flow +7.5/30.0
- Schools +7.2/10.0
- Livability +4.0/5.0
- Rent growth +2.5/5.0
- Condition / age +2.5/5.0
- 1% rule +2.3/10.0
- DSCR +1.7/10.0
- Appreciation +0.0/10.0
$639,000
🖨 Deal sheet (PDF) 📄 Offer letter ✓ Due diligence
Listing remarks
First time on the market! Welcome to 9 John Street in the heart of Bethpage. Situated on a flat 70x100 lot, this 4-bedroom, 1.5-bath home is filled with an abundance of natural light and features a great layout, oversized living room, eat-in kitchen, dining room, abundant storage, spacious laundry room, large garage, and a generous backyard with plenty of potential. Offering great bones, this is a fantastic opportunity for buyers looking to make it their own. Being sold as is, the property offers excellent potential to expand or redesign. Conveniently located near shopping, restaurants, golf courses, major parkways, and the Long Island Rail Road. A rare opportunity in a desirable Bethpage l
Key facts
- Flat 70x100 lot
- Abundant storage
- Generous backyard
Tags
Property features AI
Exterior
- Parking: Driveway; 2-car garage
- Utilities: Public sewer; Utilities: see remarks
- Home design: Single family residence; Two-story
- Construction: Frame construction
- Exterior features: Frame construction; Not waterfront
Interior
- Kitchen: Dishwasher; Oven; Range; Refrigerator; ENERGY STAR qualified appliances
- Bedrooms: Two levels (total rooms: 7)
- Flooring: Hardwood
- Bathrooms: 1 full bath; 1 half bath
- Heating & cooling: Baseboard heating; Oil heating; Central air conditioning
- Interior features: Eat-in kitchen; Entrance foyer; Formal dining room; Basement present (unfinished crawl attic)
- Laundry & utility: Washer; Dryer; Laundry in basement
Neighborhood map
What this means for you Summary
Snapshot
- This is a 4-bed/1.5-bath single-family listed at $639k.
Deal economics
- At list price, monthly cash flow is $-787 ($-9k/yr) — negative.
- To cash-flow at today's rent, offer at most $500k (21.7% below list).
- To meet the 1% rule (rent ≥ 1% of price), the offer needs to be $464k (27.4% below list).
- Recommended offer: $464k (27.4% below list) — sets the bar for 1% rule.
- Cap rate 4.8% vs local median 3.2% in Bethpage — top-decile yield for the area; either an underpriced asset or a hidden risk that comps aren't pricing in. Stress-test before assuming the spread holds.
Location & tenants
- Location reads 79/100 on livability (#131 in NY, #2,116 nationally) — a middle-class / working-renter tenant base. Strengths: crime A+, commute A+, employment A+; Watch: amenities F, cost of living F.
- Bethpage Union Free School District (suburban): math 79% / reading 79% proficiency, ranked #45 of 590 in NY (top 8%) — strong family-tenant draw, lease renewals of 3-5y typical; only 9% free/reduced lunch — higher-income household profile.
- Zoned schools: Central Boulevard Elementary School (math 62% / reading 62%, grade B, #675 of 2,108 statewide, top 35%, 533 students, 0% FRL); John F Kennedy Middle School (math 72% / reading 81%, grade A, #47 of 729 statewide, top 7%, 717 students, 24% FRL); Bethpage Senior High School (math 98% / reading 98%, grade A+, #13 of 1,100 statewide, top 2%, 932 students, 27% FRL).
- Market conditions: 113 active listings in the ZIP; 9 comparable units currently listed for rent nearby; rentals leasing fast (median 0d on market — plan ~1-2 weeks tenant-placement turnaround); 824 units permitted in Nassau County in 2024 (153 in 5+ unit buildings).
Forward outlook
- Local home prices are declining (-3.0%/yr); year-one equity from $4k of loan paydown is wiped out by about $19k of value loss. Plan a longer hold.
- Nassau County population projected at +7% by 2050 — modest demand growth; plan on rents tracking national, not racing it.
Negotiation context
- Only 7 days on market — expect competitive offers; lowballing is unlikely to land.
Risks & watch-outs
- Climate carrying-cost: major flood risk; major wind risk, 58% chance of damaging wind over 30y; extreme-heat days projected 7→16/yr by 2055 (HVAC capex compounding) — expect insurance premiums to compound above CPI over the hold.
Questions for the listing agent
- What do current leases actually rent for vs. the listed asking? Can we see a recent rent roll and the last 12 months of T-12 income?
- Built in 1963 — when were the roof, HVAC, electrical panel, plumbing, and water heater last replaced?
- Is there a deadline driving the sale (1031 exchange, divorce, estate, relocation)? That informs how much negotiation room exists.
- Schools are A-rated — typically a magnet for longer-tenancy family renters. What's the average tenant stay here, and is there a school-zone premium baked into asking?
- The area grade is low — what's the realistic commute time and amenity access for the typical tenant pool here? Any planned neighborhood developments (good or bad) we should know about?
- What's the average days-on-market for RENTAL listings here right now (not sales)? A rising rental-DOM trend means longer vacancies and softer asking-rent achievability than the comps imply.
- What's the recent tenant-quality profile in this submarket — average credit score on applications, eviction rate, late-payment / NSF rate, and stable-employment percentage? A property-management company in the area should have these aggregated.
- How much new for-sale + rental construction is in the pipeline within 1–3 miles? Heavy new supply typically softens prices + rents 12–24 months out; constrained supply supports both.
Investment metrics
- 1% rule
- 0.73% ✗
- Cap rate
- 4.82%
- Cash-on-cash
- -5.28%
- DSCR
- 0.77
- GRM
- 11.5
CMA / ARV
- ARV (median comp)
- $903,533
- List price
- $639,000
- Delta
- -29.28%
- Verdict
- UNDERPRICED
- Comps
- 20 within 1.0 mi
Show comp detail 12 sales within ~0.75 mi
| Address | Dist | Beds/Ba | Sqft | Sold | Price | $/sf | Match |
|---|---|---|---|---|---|---|---|
| 49 Norcross Ave | 0.52mi | 4/2.0 | 1,664 (+0%) | 5mo | $800,000 | $481 | 69 |
| 4000 Avoca Ave | 0.49mi | 4/2.0 | 1,777 (+7%) | 0mo | $795,000 | $447 | 64 |
| 96 S Windhorst Ave | 0.35mi | 4/3.0 | 1,500 (-10%) | 4mo | $785,000 | $523 | 58 |
| 144 N Herman Ave | 0.23mi | 5/2.0 (+1) | 1,482 (-11%) | 7mo | $775,000 | $523 | 58 |
| 35 Whaley Ave | 0.50mi | 4/2.0 | 1,800 (+8%) | 4mo | $825,000 | $458 | 58 |
| 315 Fern Pl | 0.52mi | 4/2.0 | 1,551 (-7%) | 8mo | $650,000 | $419 | 56 |
| 7 Plainview Rd | 0.64mi | 3/2.5 (-1) | 1,710 (+3%) | 1mo | $843,999 | $494 | 56 |
| 36 Irving St | 0.42mi | 3/2.0 (-1) | 1,770 (+6%) | 10mo | $780,000 | $441 | 55 |
| 30 Acme Ave | 0.17mi | 3/3.0 (-1) | 1,887 (+14%) | 7mo | $950,000 | $503 | 52 |
| 87 Brenner Ave | 0.46mi | 4/2.0 | 1,470 (-12%) | 7mo | $765,000 | $520 | 51 |
| 34 Scherer St | 0.49mi | 3/2.0 (-1) | 1,899 (+14%) | 6mo | $750,000 | $395 | 42 |
| 4 Manchester Dr | 0.61mi | 3/3.0 (-1) | 1,850 (+11%) | 2mo | $800,000 | $432 | 40 |
Match score weights: distance 35% · size 25% · config 20% · recency 20%. Top-matched comps best support the ARV.
Projected returns pro-forma
-3.0% appreciation · 3.0% rent growth · sell at horizon
- IRR
- -25.3%
- Equity multiple
- 0.14×
- Total profit
- $-153,549
- Equity at exit
- $95,277
- IRR
- -21.4%
- Equity multiple
- -0.11×
- Total profit
- $-197,839
- Equity at exit
- $55,249
Cash invested: $178,920 (down + closing). Projections, not guarantees.
Landlord ↔ Tenant lean methodology
- Overall (STATE)
- 15 Strongly Tenant-Friendly
- State New York
- 15 Strongly Tenant-Friendly · D+10
- County
- — inherits STATE
- City
- — inherits STATE
ZIP-level market 11714
- Active inventory
- 113
- Price-to-rent
- 11.5×
Monthly cashflow live
- Estimated rent
- $4,640 high interval (Pro) →
- Mortgage (P&I)
- −$3,351
- Tax from tax record
- −$835 /mo · $10,018/yr
- Insurance
- −$266
- HOA
- −$0
- Vacancy / Maint / Mgmt
- −$974
- Net cashflow
- $-787
Break-even live
Sensitivity live
| Price | -10% $-425 | -5% $-606 | +0% $-787 | +5% $-967 | +10% $-1,148 |
|---|---|---|---|---|---|
| Rent | -10% $-1,153 | -5% $-970 | +0% $-787 | +5% $-603 | +10% $-420 |
| Rate | -1.0pp $-465 | -0.5pp $-624 | base $-787 | +0.5pp $-952 | +1.0pp $-1,121 |
UW: 25.0% down · 7.5% · 30yr · 1.5% tax · 5.0% vac · 8.0% maint · 8.0% mgmt
Financing live
Cash to close
- Down payment
- $159,750
- Closing costs
- $19,170
- Reserves months
- —
- Total cash needed
- —
Loan-product check · same deal, 3 products live
Conventional
25% down · 7.5% · 30yr
- Down + closing
- —
- Monthly P&I
- —
- Monthly cashflow
- —
- DSCR
- —
- Eligible?
- —
Personal DTI + credit; lowest rate.
DSCR
20% down · 8.5% · 30yr
- Down + closing
- —
- Monthly P&I
- —
- Monthly cashflow
- —
- DSCR
- —
- Eligible?
- —
No personal income docs; deal must DSCR.
Hard money
10% down · 12.0% · 12mo
- Down + closing
- —
- Monthly P&I
- —
- Monthly cashflow
- —
- DSCR
- —
- Eligible?
- —
Short-term bridge; refi at stabilization.
Rent comps 9 comps
| Address | Beds | Baths | Sqft | Rent | $/sqft | DOM | Units | Dist |
|---|---|---|---|---|---|---|---|---|
| 152 Harrison Ave Unit A Bethpage, NY | 4.0 | 2.0 | 1200 | $4,200 | $3.50 | 45d | 1 | 0.62mi |
| 539 Central Ave Bethpage, NY | 3.0 | 1.0 | 2084 | $3,500 | $1.68 | 45d | 1 | 0.65mi |
| 80 Ellen St Bethpage, NY | 4.0 | 2.0 | 1464 | $4,999 | $3.41 | 0d | 1 | 0.84mi |
| 8 Farmedge Rd Bethpage, NY | 4.0 | 2.0 | 1269 | $4,500 | $3.55 | 0d | 1 | 0.88mi |
| 23 Ginny Ln Bethpage, NY | 5.0 | 2.0 | 2034 | $5,000 | $2.46 | 0d | 1 | 0.94mi |
| 3685 Prairie Path Bethpage, NY | 3.0 | 2.0 | 1300 | $4,500 | $3.46 | 45d | 1 | 0.94mi |
| 4 West Ct Bethpage, NY | 4.0 | 2.0 | 1075 | $4,500 | $4.19 | 0d | 1 | 0.99mi |
| 4278 Clarissa Rd Bethpage, NY | 4.0 | 2.0 | 1948 | $4,300 | $2.21 | 12d | 1 | 1.21mi |
| 278 N 4th St Bethpage, NY | 5.0 | 2.0 | 1872 | $5,200 | $2.78 | 0d | 1 | 1.28mi |
Listing history 1 events
-
2026-05-15$639,000 Active 707-char remark
ⓘ Source: listings_history table (triggers on properties + properties_extension) + one-shot
backfill from property_details.listing_events for pre-trigger history.
Tax reassessment forecast NY · Partial reset (capped growth)
- Current annual tax
- $10,018 · $835/mo
- Projected year-2 tax
- $10,408 · $867/mo
- Expected delta
- +$391/yr (+$33/mo · 3.9%)
ⓘ Screening estimate from a state-policy table — verify with the county assessor before closing.
Climate risk First Street
- Flood 6/10 Major FEMA zone X (unshaded) · 71% chance over 30 yrs
- Wildfire 1/10 Low
- Heat 5/10 Major 7 d/yr ≥95°F today · 16 d/yr by 30 yrs out
- Wind 6/10 Major 58% chance of damaging wind over 30 yrs
- Air quality 4/10 Moderate 3 unhealthy d/yr today · 5 by 30 yrs out
Nearby sold comps map
Loading sold comps map…
Walkable amenities ~0.75 mi
Loading nearby amenities…
Taxation est. · year 1
- Rental income
- $55,679
- − Mortgage interest
- −$35,794
- − Property taxes
- −$10,018
- − Insurance
- −$3,195
- − Repairs & maintenance
- −$4,454
- − Management
- −$4,454
- − Depreciation
- −$18,589
- Taxable loss
- −$20,826
- Est. tax savings @ 24.0%
- +$4,998
- After-tax cash flow
- $-4,440/yr
For passive investors: Depreciation is non-cash, so a rental often shows a tax loss while cash-flowing — sheltering income. Rental losses are passive: they offset passive income freely, and up to $25,000/yr can offset ordinary (W-2) income if you actively participate and your MAGI is under $100k (phasing out to $0 by $150k); unused losses carry forward. On sale, claimed depreciation is recaptured at up to 25%, and gains may owe capital-gains tax (a 1031 exchange can defer both). Figures are a year-1 estimate at your 24.0% rate — not tax advice; consult a CPA.
Schools (NCES district)
- District
- Bethpage Union Free School District
- NCES district ID
- 3604740
- Math proficiency
- 79% ▼ -3.00%
- Reading proficiency
- 79% ▲ 3.00%
- Median HH income
- $98,909
- Composite
- 71.51/100
- National rank
- #224
- State rank
- #45 of 590 in NY
Livability — Bethpage
- Score
- 79/100
- State rank
- #131
- US rank
- #2116
Category grades
Schools grade is shown separately in the Schools card above.
Census & demographics
- Census place
- Bethpage, NY
- City population
- 22,475
- Population (ZIP)
- 22,475
Population outlook (Nassau County) Hauer SSP2
- Today (2025)
- 1,409,302 people
- By 2030
- 1,431,482 · +1.6%
- By 2040
- 1,471,607 · +4.4%
- By 2050
- 1,502,845 · +6.6%
- By 2075
- 1,575,403 · +11.8%
- By 2100
- 1,554,356 · +10.3%
Race, ethnicity, and origin ACS 2023
- Neighborhood character
- Predominantly White (69%)
- Race & ethnicity
- White 69% Asian 14% Hispanic / Latino 14% Two or more races 8%
- Hispanic origin (detail)
- Mexican 2% Puerto Rican 4%
- Common ancestry
- Romanian 3% Lithuanian 1% Scotch-Irish 1%
- Foreign-born
- 17% · Canada, China, Jamaica
- Languages at home
- 76% English-only · Other Indo-European 13% Spanish 6% Chinese 2%
Political lean MEDSL · Nassau
- 2024 margin
- Toss-up / Even · D 47.9% · R 52.1%
- 2008→2024 swing
- -12.6pp toward R · 2008: 8.4pp · 2024: -4.2pp
- All cycles
- 2024: R+4.2 2020: D+9.5 2016: D+5.3 2012: D+6.7 2008: D+8.4
Not yet ingested
- Civics
- —
Market trends
- HPI YoY
- ▼ -803.80%
- Current HPI
- 311.8915
- Rent YoY
- —
- Metro
- —
- State GDP YoY
- ▲ 2.60%
- F500 in state
- 92
Industry mix (Fortune 500 HQ in NY)
| Industry | F500 HQs | Revenue |
|---|---|---|
| Financial Services | 10 | $950B |
|
||
| Consumer Goods | 9 | $162B |
|
||
| Insurance | 4 | $225B |
|
||
| Telecommunications | 2 | $144B |
|
||
| Pharmaceuticals | 2 | $112B |
|
||
| Media / Entertainment | 2 | $69B |
|
||
Price history
2 events — show timeline
- 2026-05-22 Pending — OneKey® MLS as Distributed by MLS Grid
- 2026-05-15 Listed $639,000 OneKey® MLS as Distributed by MLS Grid
Property tax history
+1.7%/yrLatest (2024): $10,018 · -10.9% YoY. Source: county tax records.
Cash-flow waterfall
monthlySold comps — $/sqft
last 12 mo · ≤1 miLoading sold comps…