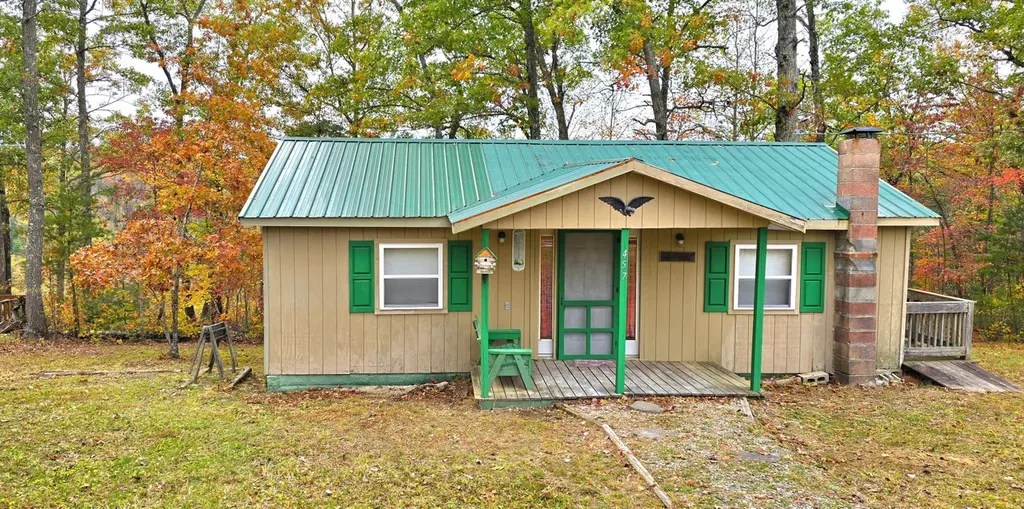
457 Ryan Rd · Ezel, KY
Flood risk No data
- FEMA flood zone
- —
- Chance of flooding over 30 yrs
- —
- Est. flood insurance / yr
- —
Fire risk No data
- Est. fire insurance / yr
- —
Heat risk No data
- Hot days now (above threshold)
- —
- Hot days in 30 yrs
- —
Wind risk No data
- Chance of severe wind over 30 yrs
- —
Air-quality risk No data
- Unhealthy air days now
- —
- Unhealthy air days in 30 yrs
- —
Risk factors via First Street. Map © Google.
Why this score? — see what drove the B- grade
The composite is a weighted blend of 9 inputs, each scored 0–100. Each bar is that input's sub-score; the figure is the points it added to the 100-point composite (weight × sub-score).
- Cash flow +25.6/30.0
- ARV discount +15.0/15.0
- DSCR +8.5/10.0
- 1% rule +6.8/10.0
- Appreciation +3.2/10.0
- Livability +3.1/5.0
- Rent growth +2.5/5.0
- Condition / age +2.2/5.0
- Schools +2.0/10.0
$68,000
🖨 Deal sheet 📄 Offer letter ✓ Due diligence
Listing remarks
* * Cabin Retreat in the Daniel Boone National Forest * * Nestled in the serene woods of the Daniel Boone National Forest, this charming 2-bedroom, 1-bath home is the perfect escape you've been searching for. With a cozy living room, 2 Bedrooms, 1 Full Bath and Kitchen Area you'll find everything you need to relax. Plus, furniture and kitchen appliances are included, making your move effortless! This cabin features essential amenities including city water, electricity, and a mini-split unit for efficient heating and cooling--ensuring comfort all year round. Step outside to discover a spacious partially wrap-around deck, ideal for enjoying peaceful moments amidst nature. A convenient sh
Key facts
- Convenient shed
- Abundant wildlife
- City water
Tags
Property features AI
Finance
- Other: Parcel number 71-08-B_220
Exterior
- Parking: Driveway
- Utilities: Public water; Septic tank; Electricity connected; Sewer connected; Water connected
- Home design: Cabin-style property; One-level home; Views facing rural/wooded and mountain scenery
- Construction: Wood siding; Metal roof; Pillar/post/pier foundation; Built area approximately 640
- Exterior features: Shed(s); Wooded lot with many trees; Rural, trees/woods and mountain views
Interior
- Kitchen: Includes refrigerator and oven
- Bedrooms: 3 total rooms (includes bedrooms and living areas)
- Flooring: Carpet; Vinyl
- Bathrooms: 1 full bathroom
- Heating & cooling: Electric heating; Electric cooling
- Interior features: Refrigerator; Oven; Blinds
- Laundry & utility: Utilities connected: electricity, water, sewer
Neighborhood map
What this means for you Summary
Snapshot
- This is a 2-bed/1.0-bath single-family listed at $68k. Condition is rated fair.
Deal economics
- At list price, monthly cash flow is $161 ($2k/yr) — positive.
- The deal already cash-flows at list — no discount required.
- Meets the 1% rule at list price ($799 rent vs $68k).
- Recommended offer: $67k (1.5% below list) — sets the bar for market timing.
- Cap rate 9.1% vs local median 3.4% in Ezel — top-decile yield for the area; either an underpriced asset or a hidden risk that comps aren't pricing in. Stress-test before assuming the spread holds.
Location & tenants
- Location reads 61/100 on livability (#375 in KY) — a middle-class / working-renter tenant base. Strengths: cost of living A+, housing A-; Watch: health & safety D+, schools D, amenities F.
- Morgan County (rural): math 14% / reading 35% proficiency, ranked #150 of 165 in KY (top 91%) — low school quality limits family demand, transient renter base, plan for 1-2y turnover; 64% free/reduced lunch — lower-income household profile, screen leases tightly.
- Market conditions: 62 active listings in the ZIP; 2 units permitted in Morgan County in 2024 (0 in 5+ unit buildings).
Forward outlook
- Local home prices are declining (-3.0%/yr); year-one equity from $470 of loan paydown is wiped out by about $2k of value loss. Plan a longer hold.
- Morgan County population projected at -16% by 2050 — secular population decline; favor cash flow + early exit over multi-decade hold.
Negotiation context
- It's been on market 18 days — a 2% lower offer ($67k) is reasonable based on typical stale-listing flexibility.
- 5 sale attempts with the ask held roughly flat each time — persistent listings suggest the price (not the market) is what's stuck; bring a comps-based counter.
Questions for the listing agent
- Have any recent inspections been done? Can we get a copy of the seller's disclosures and any deferred-maintenance estimates?
- Is there a deadline driving the sale (1031 exchange, divorce, estate, relocation)? That informs how much negotiation room exists.
- Schools are D-rated, which usually means shorter tenancies and higher turnover. Who's the typical renter profile here, and what's been the actual vacancy rate?
- What's the average days-on-market for RENTAL listings here right now (not sales)? A rising rental-DOM trend means longer vacancies and softer asking-rent achievability than the comps imply.
- What's the recent tenant-quality profile in this submarket — average credit score on applications, eviction rate, late-payment / NSF rate, and stable-employment percentage? A property-management company in the area should have these aggregated.
- How much new for-sale + rental construction is in the pipeline within 1–3 miles? Heavy new supply typically softens prices + rents 12–24 months out; constrained supply supports both.
Investment metrics
- 1% rule
- 1.18% ✓
- Cap rate
- 9.14%
- Cash-on-cash
- 10.17%
- DSCR
- 1.45
- GRM
- 7.1
CMA / ARV
- ARV (median comp)
- $123,501
- List price
- $68,000
- Delta
- -44.94%
- Verdict
- UNDERPRICED
- Comps
- 5 within 1.0 mi
Projected returns pro-forma
-3.0% appreciation · 3.0% rent growth · sell at horizon
- IRR
- -1.0%
- Equity multiple
- 0.96×
- Total profit
- $-732
- Equity at exit
- $10,139
- IRR
- 8.7%
- Equity multiple
- 1.66×
- Total profit
- $12,642
- Equity at exit
- $5,879
Cash invested: $19,040 (down + closing). Projections, not guarantees.
Landlord ↔ Tenant lean methodology
- Overall (STATE)
- 83 Strongly Landlord-Friendly
- State Kentucky
- 83 Strongly Landlord-Friendly · R+16
- County
- — inherits STATE
- City
- — inherits STATE
ZIP-level market 40387
- Home prices YoY
- -1.6%
- Active inventory
- 62
- Price-to-rent
- 7.1×
Monthly cashflow live
- Estimated rent
- $799 medium interval (Pro) →
- Mortgage (P&I)
- −$357
- Tax est. 1.5%
- −$85 /mo · $1,020/yr
- Insurance
- −$28
- HOA
- −$0
- Vacancy / Maint / Mgmt
- −$168
- Net cashflow
- $161
Break-even live
UW: 25.0% down · 7.5% · 30yr · 1.5% tax · 5.0% vac · 8.0% maint · 8.0% mgmt
Financing live
Cash to close
- Down payment
- $17,000
- Closing costs
- $2,040
- Reserves months
- —
- Total cash needed
- —
Loan-product check · same deal, 3 products live
Conventional
25% down · 7.5% · 30yr
- Down + closing
- —
- Monthly P&I
- —
- Monthly cashflow
- —
- DSCR
- —
- Eligible?
- —
Personal DTI + credit; lowest rate.
DSCR
20% down · 8.5% · 30yr
- Down + closing
- —
- Monthly P&I
- —
- Monthly cashflow
- —
- DSCR
- —
- Eligible?
- —
No personal income docs; deal must DSCR.
Hard money
10% down · 12.0% · 12mo
- Down + closing
- —
- Monthly P&I
- —
- Monthly cashflow
- —
- DSCR
- —
- Eligible?
- —
Short-term bridge; refi at stabilization.
Listing history 21 events
-
2026-05-31status $68,000 Pending 18 DOM
-
2026-05-31days on market $68,000 Active 18 DOM
-
2026-05-31days on market $68,000 Active 17 DOM
-
2026-05-13$68,000 Active 1232-char remark
-
2026-04-29historical
-
2026-04-29price $72,000
-
2026-04-13price $76,000
-
2026-04-09price $79,500
-
2026-03-30price $81,000
-
2025-11-25price $83,000
-
2025-10-29$87,500 Active
-
2025-09-24historical
-
2025-08-25price $84,900
-
2025-08-14historical
-
2025-08-14$87,000 Active
-
2025-07-07$89,000 Active
-
2025-07-07historical
-
2025-05-30price $94,000
-
2025-05-01price $99,000
-
2025-04-17price $109,000
-
2025-03-27$115,000 Active
ⓘ Source: listings_history table (triggers on properties + properties_extension) + one-shot
backfill from property_details.listing_events for pre-trigger history.
Nearby sold comps map
Loading sold comps map…
Walkable amenities ~0.75 mi
Loading nearby amenities…
Taxation est. · year 1
- Rental income
- $9,589
- − Mortgage interest
- −$3,809
- − Property taxes
- −$1,020
- − Insurance
- −$340
- − Repairs & maintenance
- −$767
- − Management
- −$767
- − Depreciation
- −$1,978
- Taxable income
- $907
- Est. tax owed @ 24.0%
- −$218
- After-tax cash flow
- $1,718/yr
For passive investors: Depreciation is non-cash, so a rental often shows a tax loss while cash-flowing — sheltering income. Rental losses are passive: they offset passive income freely, and up to $25,000/yr can offset ordinary (W-2) income if you actively participate and your MAGI is under $100k (phasing out to $0 by $150k); unused losses carry forward. On sale, claimed depreciation is recaptured at up to 25%, and gains may owe capital-gains tax (a 1031 exchange can defer both). Figures are a year-1 estimate at your 24.0% rate — not tax advice; consult a CPA.
Condition & rehab AI · 12 photos
This cabin requires moderate renovations to improve its curb appeal and interior condition, significantly increasing its resale and rental value.
Repairs flagged
- Major exterior siding — Significant peeling and wear
- Major interior paint — Worn and peeling
- Major bathroom fixtures — Outdated and in poor condition
Value-add opportunities
- Both Paint exterior — Enhances curb appeal and value
- Both Replace carpet — Improves comfort and appearance
- Both Upgrade bathroom fixtures — Enhances functionality and value
Renovation cost estimate screening
| Repair item | Severity | Est. cost |
|---|---|---|
| exterior siding · Significant peeling and wear | Major | $15,000–50,000 |
| interior paint · Worn and peeling | Major | $15,000–50,000 |
| bathroom fixtures · Outdated and in poor condition | Major | $15,000–50,000 |
| Total estimated repair cost · 3 items | $45,000–150,000 |
Value-add ROI direction
- Both Paint exterior — Enhances curb appeal and value ↑
- Both Replace carpet — Improves comfort and appearance ↑
- Both Upgrade bathroom fixtures — Enhances functionality and value ↑
ⓘ Cost ranges are severity-bucket heuristics (US national rule-of-thumb). Get contractor quotes + a written scope before underwriting a rehab budget.
Schools (NCES district)
- District
- Morgan County
- NCES district ID
- 2104290
- Math proficiency
- 14% ▼ -30.00%
- Reading proficiency
- 35% ▼ -21.00%
- Median HH income
- $31,371
- Composite
- 19.78/100
- National rank
- #8704
- State rank
- #150 of 165 in KY
Livability — Ezel
- Score
- 61/100
- State rank
- #375
- US rank
- #17739
Category grades
Schools grade is shown separately in the Schools card above.
Census & demographics
- Population (ZIP)
- 1,805
Population outlook (Morgan County) Hauer SSP2
- Today (2025)
- 12,632 people
- By 2030
- 12,211 · -3.3%
- By 2040
- 11,408 · -9.7%
- By 2050
- 10,612 · -16.0%
- By 2075
- 8,790 · -30.4%
- By 2100
- 6,944 · -45.0%
Race, ethnicity, and origin ACS 2023
- Neighborhood character
- Predominantly White (96%)
- Race & ethnicity
- White 96% Hispanic / Latino 2% Asian 1%
- Common ancestry
- Lithuanian 2% Slovak 1% Scotch-Irish 1%
- Languages at home
- 98% English-only · Spanish 2%
Political lean MEDSL · Morgan
- 2024 margin
- Solid R (+63.5) · D 17.5% · R 81.0% · Other 1.5%
- 2008→2024 swing
- -51.7pp toward R · 2008: -11.8pp · 2024: -63.5pp
- All cycles
- 2024: R+63.5 2020: R+56.4 2016: R+55.0 2012: R+36.9 2008: R+11.8
Not yet ingested
- Civics
- —
Market trends
- HPI YoY
- ▼ -3.58%
- Current HPI
- 215.8197
- Rent YoY
- —
- Metro
- —
- State GDP YoY
- ▲ 1.81%
- F500 in state
- 4
Industry mix (Fortune 500 HQ in KY)
| Industry | F500 HQs | Revenue |
|---|---|---|
| Healthcare | 1 | $118B |
|
||
| Food / Beverage | 1 | $7B |
|
||
Price history
-40.9% since first listed19 events — show timeline
- 2026-05-31 Pending — ImagineMLS
- 2026-05-13 Listed $68,000 ImagineMLS
- 2026-04-29 Listing Removed — ImagineMLS
- 2026-04-29 Price Changed $72,000 ImagineMLS
- 2026-04-13 Price Changed $76,000 ImagineMLS
- 2026-04-09 Price Changed $79,500 ImagineMLS
- 2026-03-30 Price Changed $81,000 ImagineMLS
- 2025-11-25 Price Changed $83,000 ImagineMLS
- 2025-10-29 Listed $87,500 ImagineMLS
- 2025-09-24 Listing Removed — ImagineMLS
- 2025-08-25 Price Changed $84,900 ImagineMLS
- 2025-08-14 Listed $87,000 ImagineMLS
- 2025-08-14 Listing Removed — ImagineMLS
- 2025-07-07 Listing Removed — ImagineMLS
- 2025-07-07 Listed $89,000 ImagineMLS
- 2025-05-30 Price Changed $94,000 ImagineMLS
- 2025-05-01 Price Changed $99,000 ImagineMLS
- 2025-04-17 Price Changed $109,000 ImagineMLS
- 2025-03-27 Listed $115,000 ImagineMLS
Cash-flow waterfall
monthlySold comps — $/sqft
last 12 mo · ≤1 miLoading sold comps…