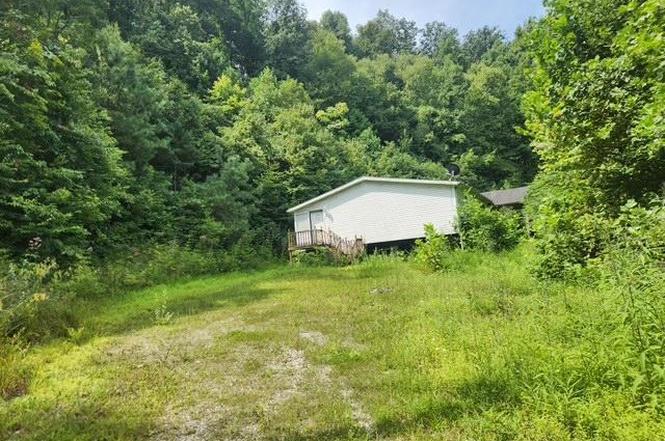
1144 Grassy Branch Rd · Hyden, KY
Flood risk 1/10 · Minimal
- FEMA flood zone
- X (unshaded)
- Chance of flooding over 30 yrs
- 0.0%
- Est. flood insurance / yr
- $507 – $1,088
Fire risk 8/10 · Major
- Est. fire insurance / yr
- $839 – $1,559
Heat risk 3/10 · Minor
- Hot days now (above 98°F)
- 6 days/yr
- Hot days in 30 yrs
- 15 days/yr
Wind risk 2/10 · Minimal
- Chance of severe wind over 30 yrs
- 1.0%
Air-quality risk 1/10 · Minimal
- Unhealthy air days now
- 0 days/yr
- Unhealthy air days in 30 yrs
- 0 days/yr
Risk factors via First Street. Map © Google.
Why this score? — see what drove the C- grade
The composite is a weighted blend of 9 inputs, each scored 0–100. Each bar is that input's sub-score; the figure is the points it added to the 100-point composite (weight × sub-score).
- Cash flow +15.0/30.0
- ARV discount +7.5/15.0
- Appreciation +6.2/10.0
- 1% rule +5.0/10.0
- DSCR +5.0/10.0
- Livability +3.5/5.0
- Schools +3.3/10.0
- Rent growth +2.5/5.0
- Condition / age +2.5/5.0
$11,900
🖨 Deal sheet 📄 Offer letter ✓ Due diligence
Listing remarks
PROPERTY IS NOW AT AUCTION. SEE PRIVATE REMARKS OR CALL LISTING AGENT!!! Manufactured home located in Leslie county on over 5 acres. Don't let this one pass by!!!
Key facts
- Manufactured home
- Over 5 acres
- 5.87 acre lot
Tags
Neighborhood map
What this means for you Summary
Snapshot
- This is a 3-bed/2.0-bath manufactured listed at $12k.
Deal economics
- At list price, monthly cash flow is $888 ($11k/yr) — positive.
- The deal already cash-flows at list — no discount required.
- Meets the 1% rule at list price ($1k rent vs $12k).
- Recommended offer: $10k (12.0% below list) — sets the bar for market timing.
Location & tenants
- Location reads 70/100 on livability (#156 in KY) — a middle-class / working-renter tenant base. Strengths: crime A+, employment A+, cost of living A+; Watch: amenities F, commute F.
- Leslie County (rural): math 35% / reading 46% proficiency, ranked #36 of 165 in KY (top 22%) — families likely to look elsewhere, expect single-tenant / working-renter base with shorter leases.
- Zoned schools: Stinnett Elementary School (math 39% / reading 46%, grade F, #169 of 676 statewide, top 26%, 318 students, 65% FRL); Leslie County High School (math 32% / reading 32%, grade F, #97 of 254 statewide, top 46%, 472 students, 68% FRL).
- Market conditions: 2 active listings in the ZIP.
Forward outlook
- In year one you build about $362 of equity ($82 loan paydown + $280 appreciation (2.4% local appreciation)).
- Leslie County population projected at -35% by 2050 — secular population decline; favor cash flow + early exit over multi-decade hold.
- At projected returns (2.4% appreciation + 3.0% rent growth), your $3k cash investment doubles in ~1 year — after that, you're playing with house money.
Negotiation context
- It's been on market 210 days — a 12% lower offer ($10k) is reasonable based on typical stale-listing flexibility.
Risks & watch-outs
- Climate carrying-cost: severe wildfire risk — expect insurance premiums to compound above CPI over the hold.
Questions for the listing agent
- It's been on market 210 days. Have you received any prior offers? Is the seller open to a 12% concession, seller financing, or rate buy-down credit?
- Why hasn't it sold? Are there any deal-killer items the seller is aware of (foundation, flood, title, zoning, code violations)?
- Is there a deadline driving the sale (1031 exchange, divorce, estate, relocation)? That informs how much negotiation room exists.
- Schools are D-rated, which usually means shorter tenancies and higher turnover. Who's the typical renter profile here, and what's been the actual vacancy rate?
- What's the average days-on-market for RENTAL listings here right now (not sales)? A rising rental-DOM trend means longer vacancies and softer asking-rent achievability than the comps imply.
- What's the recent tenant-quality profile in this submarket — average credit score on applications, eviction rate, late-payment / NSF rate, and stable-employment percentage? A property-management company in the area should have these aggregated.
- How much new for-sale + rental construction is in the pipeline within 1–3 miles? Heavy new supply typically softens prices + rents 12–24 months out; constrained supply supports both.
Investment metrics
- 1% rule
- 10.32% ✓
- Cap rate
- 95.87%
- Cash-on-cash
- 319.91%
- DSCR
- 15.23
- GRM
- 0.8
CMA / ARV
No comps found within radius.
Projected returns pro-forma
2.35% appreciation · 3.0% rent growth · sell at horizon
- IRR
- —
- Equity multiple
- 18.29×
- Total profit
- $57,625
- Equity at exit
- $4,923
- IRR
- —
- Equity multiple
- 38.93×
- Total profit
- $126,393
- Equity at exit
- $7,269
Cash invested: $3,332 (down + closing). Projections, not guarantees.
Landlord ↔ Tenant lean methodology
- Overall (STATE)
- 83 Strongly Landlord-Friendly
- State Kentucky
- 83 Strongly Landlord-Friendly · R+16
- County
- — inherits STATE
- City
- — inherits STATE
ZIP-level market 40827
- Home prices YoY
- 1.6%
- Active inventory
- 2
- Price-to-rent
- 0.8×
Monthly cashflow live
- Estimated rent
- $1,229 medium interval (Pro) →
- Mortgage (P&I)
- −$62
- Tax est. 1.5%
- −$15 /mo · $178/yr
- Insurance
- −$5
- HOA
- −$0
- Vacancy / Maint / Mgmt
- −$258
- Net cashflow
- $888
Break-even live
UW: 25.0% down · 7.5% · 30yr · 1.5% tax · 5.0% vac · 8.0% maint · 8.0% mgmt
Financing live
Cash to close
- Down payment
- $2,975
- Closing costs
- $357
- Reserves months
- —
- Total cash needed
- —
Loan-product check · same deal, 3 products live
Conventional
25% down · 7.5% · 30yr
- Down + closing
- —
- Monthly P&I
- —
- Monthly cashflow
- —
- DSCR
- —
- Eligible?
- —
Personal DTI + credit; lowest rate.
DSCR
20% down · 8.5% · 30yr
- Down + closing
- —
- Monthly P&I
- —
- Monthly cashflow
- —
- DSCR
- —
- Eligible?
- —
No personal income docs; deal must DSCR.
Hard money
10% down · 12.0% · 12mo
- Down + closing
- —
- Monthly P&I
- —
- Monthly cashflow
- —
- DSCR
- —
- Eligible?
- —
Short-term bridge; refi at stabilization.
Listing history 9 events
-
2026-03-19status Pending
-
2026-02-20price $11,900
-
2026-01-25price $14,900
-
2025-12-22price $19,900
-
2025-11-26price $24,900
-
2025-10-23price $34,900
-
2025-09-21price $44,900
-
2025-08-20$49,900 Active
-
2002-10-01soldstatus $94,000
ⓘ Source: listings_history table (triggers on properties + properties_extension) + one-shot
backfill from property_details.listing_events for pre-trigger history.
Climate risk First Street
- Flood 1/10 Low FEMA zone X (unshaded) · 0% chance over 30 yrs
- Wildfire 8/10 Severe
- Heat 3/10 Moderate 6 d/yr ≥98°F today · 15 d/yr by 30 yrs out
- Wind 2/10 Low 100% chance of damaging wind over 30 yrs
- Air quality 1/10 Low 0 unhealthy d/yr today · 0 by 30 yrs out
Nearby sold comps map
Loading sold comps map…
Walkable amenities ~0.75 mi
Loading nearby amenities…
Taxation est. · year 1
- Rental income
- $14,742
- − Mortgage interest
- −$667
- − Property taxes
- −$178
- − Insurance
- −$60
- − Repairs & maintenance
- −$1,179
- − Management
- −$1,179
- − Depreciation
- −$346
- Taxable income
- $11,133
- Est. tax owed @ 24.0%
- −$2,672
- After-tax cash flow
- $7,988/yr
For passive investors: Depreciation is non-cash, so a rental often shows a tax loss while cash-flowing — sheltering income. Rental losses are passive: they offset passive income freely, and up to $25,000/yr can offset ordinary (W-2) income if you actively participate and your MAGI is under $100k (phasing out to $0 by $150k); unused losses carry forward. On sale, claimed depreciation is recaptured at up to 25%, and gains may owe capital-gains tax (a 1031 exchange can defer both). Figures are a year-1 estimate at your 24.0% rate — not tax advice; consult a CPA.
Schools (NCES district)
- District
- Leslie County
- NCES district ID
- 2103330
- Math proficiency
- 35% ▼ -10.00%
- Reading proficiency
- 46% ▼ -13.00%
- Median HH income
- $29,367
- Composite
- 32.9/100
- National rank
- #5604
- State rank
- #36 of 165 in KY
Livability — Hyden
- Score
- 70/100
- State rank
- #156
- US rank
- #7902
Category grades
Schools grade is shown separately in the Schools card above.
Census & demographics
- Population (ZIP)
- 993
Population outlook (Leslie County) Hauer SSP2
- Today (2025)
- 9,439 people
- By 2030
- 8,711 · -7.7%
- By 2040
- 7,328 · -22.4%
- By 2050
- 6,134 · -35.0%
- By 2075
- 4,231 · -55.2%
- By 2100
- 3,178 · -66.3%
Race, ethnicity, and origin ACS 2023
- Neighborhood character
- Predominantly White (100%)
- Race & ethnicity
- White 100%
- Common ancestry
- Serbian 1%
Political lean MEDSL · Leslie
- 2024 margin
- Solid R (+80.9) · D 8.8% · R 89.7% · Other 1.5%
- 2008→2024 swing
- -17.1pp toward R · 2008: -63.9pp · 2024: -80.9pp
- All cycles
- 2024: R+80.9 2020: R+80.5 2016: R+80.6 2012: R+80.9 2008: R+63.9
Not yet ingested
- Civics
- —
Market trends
- HPI YoY
- ▲ 2.35%
- Current HPI
- 145.0937
- Rent YoY
- —
- Metro
- —
- State GDP YoY
- ▲ 1.81%
- F500 in state
- 4
Industry mix (Fortune 500 HQ in KY)
| Industry | F500 HQs | Revenue |
|---|---|---|
| Healthcare | 1 | $118B |
|
||
| Food / Beverage | 1 | $7B |
|
||
Price history
-87.3% since first listed9 events — show timeline
- 2026-03-19 Pending — ImagineMLS
- 2026-02-20 Price Changed $11,900 ImagineMLS
- 2026-01-25 Price Changed $14,900 ImagineMLS
- 2025-12-22 Price Changed $19,900 ImagineMLS
- 2025-11-26 Price Changed $24,900 ImagineMLS
- 2025-10-23 Price Changed $34,900 ImagineMLS
- 2025-09-21 Price Changed $44,900 ImagineMLS
- 2025-08-20 Listed $49,900 ImagineMLS
- 2002-10-01 Sold (Public Records) $94,000 Public Records
Property tax history
+2.2%/yrLatest (2025): $1,190 · -1.0% YoY. Source: county tax records.
Cash-flow waterfall
monthlySold comps — $/sqft
last 12 mo · ≤1 miLoading sold comps…