155 Rosebud · San Antonio, TX
Flood risk 1/10 · Minimal
- FEMA flood zone
- X (unshaded)
- Chance of flooding over 30 yrs
- 0.0%
- Est. flood insurance / yr
- $507 – $1,088
Fire risk 1/10 · Minimal
- Est. fire insurance / yr
- $1,222 – $2,270
Heat risk 8/10 · Major
- Hot days now (above 109°F)
- 7 days/yr
- Hot days in 30 yrs
- 22 days/yr
Wind risk 8/10 · Major
- Chance of severe wind over 30 yrs
- 80.0%
Air-quality risk 2/10 · Minimal
- Unhealthy air days now
- 1 days/yr
- Unhealthy air days in 30 yrs
- 2 days/yr
Risk factors via First Street. Map © Google.
Why this score? — see what drove the D+ grade
The composite is a weighted blend of 9 inputs, each scored 0–100. Each bar is that input's sub-score; the figure is the points it added to the 100-point composite (weight × sub-score).
- ARV discount +15.0/15.0
- Cash flow +10.6/30.0
- Appreciation +6.0/10.0
- 1% rule +4.1/10.0
- Livability +4.0/5.0
- DSCR +3.0/10.0
- Condition / age +2.5/5.0
- Schools +1.9/10.0
- Rent growth +0.7/5.0
$168,500
🖨 Deal sheet (PDF) 📄 Offer letter ✓ Due diligence
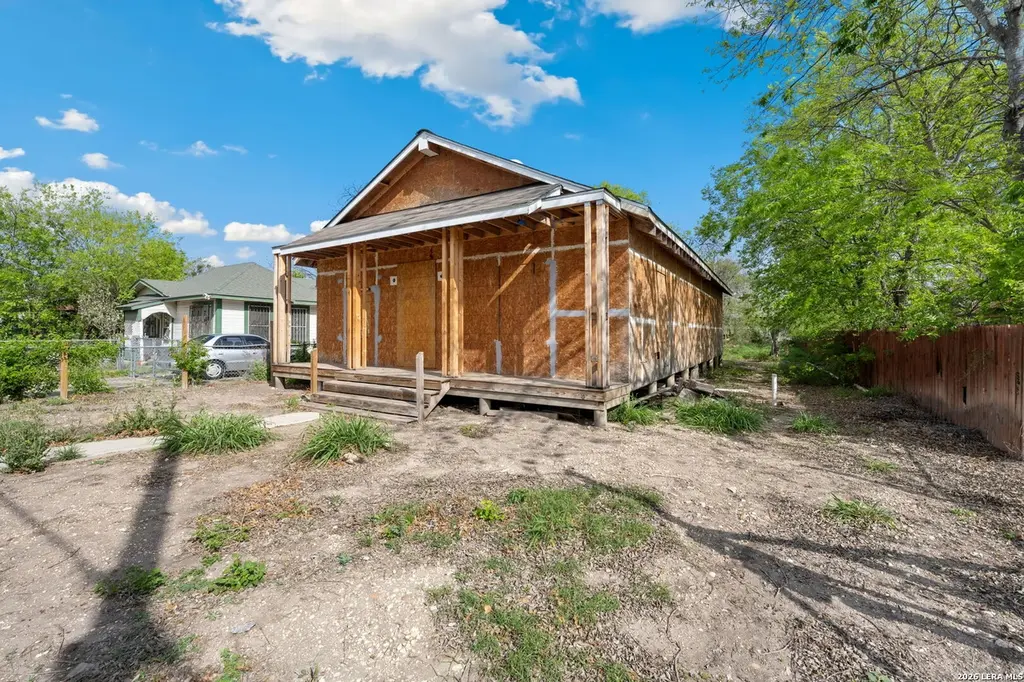
Listing remarks
Excellent opportunity to finish out a home with many major new systems already installed. Conveniently located directly across from Harlandale High School and sitting on an approximately 0.23-acre, 10,000 sqft lot. This partially completed renovation already includes a NEW foundation, NEW roof, NEW electrical system, and NEW HVAC ductwork. Property still requires finish-out work and is NOT move-in ready. Remaining work includes installation of the AC condenser along with interior completion such as flooring, paint, cabinetry, fixtures, trim, and cosmetic finishes. Ideal opportunity for investors, contractors, or buyers using renovation financing looking to customize the final design while a
Key facts
- New foundation
- New hvac ductwork
- New roof
Tags
Property features AI
Finance
- HOA & community: Located in HARLANDALE NW community
Exterior
- Utilities: City water and sewer
- Home design: Wood exterior; Wood shingle/shake roof; Custom builder; Approximately 5 years old; Recent rehab; Located in HARLANDALE NW subdivision
- Construction: Wood construction
- Exterior features: Deck or balcony; Sidewalks, streetlights, city street
Interior
- Kitchen: Kitchen approximately 10 x 10
- Bedrooms: Master bedroom (lower level), approximately 14 x 14; Bedroom 2, approximately 11 x 13; Bedroom 3, approximately 11 x 13
- Flooring: Other (see remarks)
- Bathrooms: 2 full bathrooms
- Heating & cooling: Central heating (electric); Central air conditioning
- Interior features: One living area; All window coverings remain; Laundry on main level
- Laundry & utility: Dedicated laundry room (main level), approximately 6 x 10
Neighborhood map
What this means for you Summary
Snapshot
- This is a 3-bed/2.0-bath single-family listed at $168k.
Deal economics
- At list price, monthly cash flow is $-84 ($-1k/yr) — negative.
- To cash-flow at today's rent, offer at most $154k (8.8% below list).
- To meet the 1% rule (rent ≥ 1% of price), the offer needs to be $153k (9.4% below list).
- Recommended offer: $153k (9.4% below list) — sets the bar for 1% rule.
- Cap rate 5.7% vs local median 3.8% in San Antonio — top-decile yield for the area; either an underpriced asset or a hidden risk that comps aren't pricing in. Stress-test before assuming the spread holds.
Location & tenants
- Location reads 80/100 on livability (#31 in TX, #1,616 nationally) — a professional / high-income tenant draw. Strengths: amenities A+, commute A+, cost of living A+; Watch: crime F.
- Harlandale ISD (urban): math 20% / reading 27% proficiency, ranked #748 of 826 in TX (top 91%) — low school quality limits family demand, transient renter base, plan for 1-2y turnover; 66% free/reduced lunch — lower-income household profile, screen leases tightly.
- Zoned schools: V M Adams El (math 10% / reading 22%, grade F, #3,974 of 4,322 statewide, top 92%, 591 students, 95% FRL); Harlandale Middle (math 20% / reading 26%, grade F, #1,327 of 1,662 statewide, top 81%, 770 students, 90% FRL); Harlandale H S (math 17% / reading 29%, grade F, #1,348 of 1,632 statewide, top 83%, 1,664 students, 82% FRL) — zoned schools average 89% FRL vs 66% district-wide (23 pts higher); higher-poverty schools than district average — tighter screening recommended.
- Market conditions: Rents falling (-7.2%/yr); 389 active listings in the ZIP; 35 comparable units currently listed for rent nearby; rentals at typical pace (median 26d on market — plan ~3-4 weeks tenant-placement turnaround); 8,308 units permitted in Bexar County in 2024 (2,506 in 5+ unit buildings).
Forward outlook
- In year one you build about $5k of equity ($1k loan paydown + $3k appreciation (2.0% local appreciation)).
- Bexar County population projected at +50% by 2050 — long-run rental-demand tailwind backs the buy-and-hold thesis.
- By year 8, paydown + projected appreciation supports a ~$34k cash-out refi (75% LTV) — recoverable capital for the next deal without selling this one.
Negotiation context
- It's been on market 31 days — a 3% lower offer ($163k) is reasonable based on typical stale-listing flexibility.
Risks & watch-outs
- Climate carrying-cost: severe wind risk, 80% chance of damaging wind over 30y; extreme-heat days projected 7→22/yr by 2055 (HVAC capex compounding) — expect insurance premiums to compound above CPI over the hold.
Questions for the listing agent
- What do current leases actually rent for vs. the listed asking? Can we see a recent rent roll and the last 12 months of T-12 income?
- It's been on market 31 days. Have you received any prior offers? Is the seller open to a 9% concession, seller financing, or rate buy-down credit?
- Is there a deadline driving the sale (1031 exchange, divorce, estate, relocation)? That informs how much negotiation room exists.
- Crime grade is F in this area — have there been break-ins, vandalism, or insurance claims at this property in the last 3 years? What carrier currently insures it and at what premium?
- The area grade is low — what's the realistic commute time and amenity access for the typical tenant pool here? Any planned neighborhood developments (good or bad) we should know about?
- What's the average days-on-market for RENTAL listings here right now (not sales)? A rising rental-DOM trend means longer vacancies and softer asking-rent achievability than the comps imply.
- What's the recent tenant-quality profile in this submarket — average credit score on applications, eviction rate, late-payment / NSF rate, and stable-employment percentage? A property-management company in the area should have these aggregated.
- How much new for-sale + rental construction is in the pipeline within 1–3 miles? Heavy new supply typically softens prices + rents 12–24 months out; constrained supply supports both.
Investment metrics
- 1% rule
- 0.91% ✗
- Cap rate
- 5.69%
- Cash-on-cash
- -2.14%
- DSCR
- 0.90
- GRM
- 9.2
CMA / ARV
- ARV (on-the-fly)
- $212,772
- Comps found
- 12
Show comp detail 12 sales within ~0.75 mi
| Address | Dist | Beds/Ba | Sqft | Sold | Price | $/sf | Match |
|---|---|---|---|---|---|---|---|
| 520 Pyron | 0.21mi | 3/1.0 | 1,388 (-3%) | 3mo | $195,000 | $140 | 79 |
| 134 Rosebud | 0.06mi | 3/1.0 | 1,224 (-14%) | 2mo | $91,000 | $74 | 68 |
| 114 E Mayfield | 0.27mi | 3/2.0 | 1,300 (-9%) | 8mo | $215,000 | $165 | 65 |
| 562 Kendalia Ave | 0.32mi | 3/2.0 | 1,600 (+12%) | 1mo | $230,000 | $144 | 64 |
| 825 Fitch St | 0.69mi | 3/2.0 | 1,384 (-3%) | 1mo | $209,000 | $151 | 62 |
| 738 Kendalia Ave | 0.47mi | 4/2.0 (+1) | 1,392 (-2%) | 13mo | $222,500 | $160 | 58 |
| 426 Kendalia Ave | 0.35mi | 3/2.0 | 1,240 (-13%) | 14mo | $249,000 | $201 | 50 |
| 551 E Mayfield | 0.74mi | 3/2.0 | 1,364 (-4%) | 11mo | $219,900 | $161 | 49 |
| 125 Canavan | 0.38mi | 2/1.0 (-1) | 1,230 (-14%) | 6mo | $45,000 | $37 | 45 |
| 410 W Dickson | 0.46mi | 3/1.0 | 1,234 (-14%) | 10mo | $125,000 | $101 | 44 |
| 115 Shrine Ave | 0.75mi | 3/2.0 | 1,556 (+9%) | 13mo | $89,990 | $58 | 39 |
| 3830 Terrell Trce | 0.70mi | 3/2.0 | 1,266 (-11%) | 13mo | $189,211 | $149 | 37 |
Match score weights: distance 35% · size 25% · config 20% · recency 20%. Top-matched comps best support the ARV.
Projected returns pro-forma
2.03% appreciation · 0.0% rent growth · sell at horizon
- IRR
- 0.8%
- Equity multiple
- 1.04×
- Total profit
- $2,070
- Equity at exit
- $66,720
- IRR
- 3.4%
- Equity multiple
- 1.44×
- Total profit
- $20,788
- Equity at exit
- $96,278
Cash invested: $47,180 (down + closing). Projections, not guarantees.
Landlord ↔ Tenant lean methodology
- Overall (STATE)
- 87 Strongly Landlord-Friendly
- State Texas
- 87 Strongly Landlord-Friendly · R+5
- County
- — inherits STATE
- City
- — inherits STATE
ZIP-level market 78221
- Home prices YoY
- 0.8%
- Rents YoY
- -7.2%
- Active inventory
- 389
- Price-to-rent
- 9.2×
Monthly cashflow live
- Estimated rent
- $1,526 high interval (Pro) →
- Mortgage (P&I)
- −$884
- Tax from tax record
- −$336 /mo · $4,033/yr
- Insurance
- −$70
- HOA
- −$0
- Vacancy / Maint / Mgmt
- −$321
- Net cashflow
- $-84
Break-even live
Sensitivity live
| Price | -10% $11 | -5% $-36 | +0% $-84 | +5% $-132 | +10% $-179 |
|---|---|---|---|---|---|
| Rent | -10% $-205 | -5% $-144 | +0% $-84 | +5% $-24 | +10% $37 |
| Rate | -1.0pp $1 | -0.5pp $-41 | base $-84 | +0.5pp $-128 | +1.0pp $-172 |
UW: 25.0% down · 7.5% · 30yr · 1.5% tax · 5.0% vac · 8.0% maint · 8.0% mgmt
Financing live
Cash to close
- Down payment
- $42,125
- Closing costs
- $5,055
- Reserves months
- —
- Total cash needed
- —
Loan-product check · same deal, 3 products live
Conventional
25% down · 7.5% · 30yr
- Down + closing
- —
- Monthly P&I
- —
- Monthly cashflow
- —
- DSCR
- —
- Eligible?
- —
Personal DTI + credit; lowest rate.
DSCR
20% down · 8.5% · 30yr
- Down + closing
- —
- Monthly P&I
- —
- Monthly cashflow
- —
- DSCR
- —
- Eligible?
- —
No personal income docs; deal must DSCR.
Hard money
10% down · 12.0% · 12mo
- Down + closing
- —
- Monthly P&I
- —
- Monthly cashflow
- —
- DSCR
- —
- Eligible?
- —
Short-term bridge; refi at stabilization.
Rent comps 35 comps
| Address | Beds | Baths | Sqft | Rent | $/sqft | DOM | Units | Dist |
|---|---|---|---|---|---|---|---|---|
| 202 McCauley Blvd San Antonio, TX | 3.0 | 2.0 | 1232 | $1,595 | $1.29 | 26d | 1 | 0.36mi |
| 607 Brunswick Blvd San Antonio, TX | 3.0 | 2.0 | 1350 | $1,750 | $1.30 | 45d | 1 | 0.54mi |
| 611 Brunswick Blvd San Antonio, TX | 3.0 | 2.0 | 1080 | $1,700 | $1.57 | 26d | 1 | 0.54mi |
| 611 Brunswick Blvd San Antonio, TX | 3.0 | 2.0 | 1080 | $1,700 | $1.57 | 16d | 1 | 0.54mi |
| 247 W Dickson Ave San Antonio, TX | 1.0–2.0 | 1.0–2.0 | 758 | $1,358 | $1.79 | 0d | 33 | 0.61mi |
| 326 Stonewall St San Antonio, TX | 3.0 | 1.0 | 1080 | $1,200 | $1.11 | 26d | 1 | 0.67mi |
| 102 Shrine Ave San Antonio, TX | 3.0 | 1.0 | 1262 | $1,200 | $0.95 | 26d | 1 | 0.73mi |
| 102 Shrine Ave San Antonio, TX | 3.0 | 1.0 | 1262 | $1,200 | $0.95 | 23d | 1 | 0.73mi |
| 838 McCauley Blvd San Antonio, TX | 3.0 | 2.0 | 1009 | $1,646 | $1.63 | 16d | 1 | 0.81mi |
| 141 W Dickson Ave San Antonio, TX | 3.0 | 2.0 | 1500 | $1,600 | $1.07 | 45d | 1 | 0.82mi |
| 425 San Blas San Antonio, TX | 2.0 | 1.0 | 1568 | $1,285 | $0.82 | 45d | 1 | 0.89mi |
| 139 Bristol Ave San Antonio, TX | 3.0 | 1.0 | 1428 | $1,500 | $1.05 | 18d | 1 | 0.90mi |
| 304 Terrell Ave San Antonio, TX | 4.0 | 2.0 | 1203 | $1,500 | $1.25 | 26d | 1 | 0.93mi |
| 108 Beatrice Ave Unit 101 San Antonio, TX | 4.0 | 2.0 | 1232 | $1,545 | $1.25 | 46d | 1 | 0.94mi |
| 415 Chalmers Ave San Antonio, TX | 2.0 | 1.0 | 1340 | $1,200 | $0.90 | 26d | 1 | 0.96mi |
| 7218 Briar Pl San Antonio, TX | 3.0 | 2.5 | 1212 | $1,275 | $1.05 | 45d | 1 | 1.00mi |
| 7226 Briar Pl San Antonio, TX | 3.0 | 2.5 | 1212 | $1,400 | $1.16 | 4d | 1 | 1.00mi |
| 1067 Rayburn Dr San Antonio, TX | 4.0 | 2.0 | 1744 | $1,495 | $0.86 | 6d | 1 | 1.06mi |
| 503 W Hart Ave San Antonio, TX | 3.0 | 1.0 | 1232 | $1,750 | $1.42 | 13d | 1 | 1.09mi |
| 239 Nock Ave San Antonio, TX | 3.0 | 1.0 | 1252 | $1,500 | $1.20 | 0d | 1 | 1.12mi |
| 575 Division Ave San Antonio, TX | 3.0 | 1.5 | 1362 | $1,950 | $1.43 | 19d | 1 | 1.15mi |
| 351 Ware Blvd San Antonio, TX | 2.0 | 2.0 | 875 | $1,450 | $1.66 | 45d | 1 | 1.16mi |
| 511 E Sayers Ave San Antonio, TX | 4.0 | 2.0 | 1748 | $1,675 | $0.96 | 26d | 1 | 1.22mi |
| 161 Kaine St San Antonio, TX | 3.0 | 1.0 | 1000 | $1,450 | $1.45 | 19d | 1 | 1.22mi |
| 154 Octavia Pl San Antonio, TX | 4.0 | 2.0 | 1468 | $1,650 | $1.12 | 18d | 1 | 1.25mi |
| 134 Gladstone St San Antonio, TX | 2.0 | 1.0 | 1407 | $1,000 | $0.71 | 13d | 1 | 1.26mi |
| 834 Division Ave Unit 2 San Antonio, TX | 2.0 | 1.0 | 936 | $950 | $1.01 | 6d | 1 | 1.29mi |
| 119 Langford Pl San Antonio, TX | 3.0 | 2.0 | 1680 | $1,600 | $0.95 | 18d | 1 | 1.31mi |
| 328 Elks Dr San Antonio, TX | 4.0 | 1.0 | 1600 | $1,500 | $0.94 | 26d | 1 | 1.32mi |
| 543 Crane Ave San Antonio, TX | 3.0 | 1.0 | 960 | $1,450 | $1.51 | 45d | 1 | 1.41mi |
| 422 Wagner Ave San Antonio, TX | 3.0 | 2.0 | 1220 | $1,750 | $1.43 | 45d | 1 | 1.42mi |
| 1467 W Gerald Ave San Antonio, TX | 3.0 | 2.5 | 1120 | $1,300 | $1.16 | 13d | 1 | 1.46mi |
| 507 Linden Ave San Antonio, TX | 3.0 | 2.5 | 1668 | $1,695 | $1.02 | 6d | 1 | 1.46mi |
| 351 E Amber St San Antonio, TX | 3.0 | 1.0 | 966 | $1,390 | $1.44 | 45d | 1 | 1.47mi |
| 114 Teresa San Antonio, TX | 3.0 | 1.0 | 984 | $1,450 | $1.47 | 26d | 1 | 1.48mi |
Listing history 17 events
-
2026-06-21days on market $168,500 Active 31 DOM
-
2026-06-18days on market $168,500 Active 28 DOM
-
2026-06-17days on market $168,500 Active 27 DOM
-
2026-06-16days on market $168,500 Active 26 DOM
-
2026-06-15days on market $168,500 Active 25 DOM
-
2026-06-13statusdays on market $168,500 Active 23 DOM
-
2026-06-13days on market $168,500 Price Change 22 DOM
-
2026-06-09days on market $168,500 Price Change 19 DOM
-
2026-06-08days on market $168,500 Price Change 18 DOM
-
2026-06-07days on market $168,500 Price Change 17 DOM
-
2026-06-04days on market $168,500 Price Change 14 DOM
-
2026-06-03days on market $168,500 Price Change 13 DOM
-
2026-06-02pricestatusdays on market $168,500 Price Change 12 DOM
-
2026-06-01statusdays on market $172,500 Active 11 DOM
-
2026-05-31days on market $172,500 New 10 DOM
-
2026-05-21$172,500 New
-
2020-04-14soldstatus
ⓘ Source: listings_history table (triggers on properties + properties_extension) + one-shot
backfill from property_details.listing_events for pre-trigger history.
Tax reassessment forecast TX · Resets to sale price
- Current annual tax
- $4,033 · $336/mo
- Projected year-2 tax
- $4,033 · $336/mo
- Expected delta
- $0/yr ($0/mo · 0.0%)
ⓘ Screening estimate from a state-policy table — verify with the county assessor before closing.
Climate risk First Street
- Flood 1/10 Low FEMA zone X (unshaded) · 0% chance over 30 yrs
- Wildfire 1/10 Low
- Heat 8/10 Severe 7 d/yr ≥109°F today · 22 d/yr by 30 yrs out
- Wind 8/10 Severe 80% chance of damaging wind over 30 yrs
- Air quality 2/10 Low 1 unhealthy d/yr today · 2 by 30 yrs out
Nearby sold comps map
Loading sold comps map…
Walkable amenities ~0.75 mi
Loading nearby amenities…
Taxation est. · year 1
- Rental income
- $18,317
- − Mortgage interest
- −$9,439
- − Property taxes
- −$4,033
- − Insurance
- −$842
- − Repairs & maintenance
- −$1,465
- − Management
- −$1,465
- − Depreciation
- −$4,902
- Taxable loss
- −$3,830
- Est. tax savings @ 24.0%
- +$919
- After-tax cash flow
- $-89/yr
For passive investors: Depreciation is non-cash, so a rental often shows a tax loss while cash-flowing — sheltering income. Rental losses are passive: they offset passive income freely, and up to $25,000/yr can offset ordinary (W-2) income if you actively participate and your MAGI is under $100k (phasing out to $0 by $150k); unused losses carry forward. On sale, claimed depreciation is recaptured at up to 25%, and gains may owe capital-gains tax (a 1031 exchange can defer both). Figures are a year-1 estimate at your 24.0% rate — not tax advice; consult a CPA.
Schools (NCES district)
- District
- Harlandale ISD
- NCES district ID
- 4822470
- Math proficiency
- 20% ▼ -22.00%
- Reading proficiency
- 27% ▼ -9.00%
- Median HH income
- $33,850
- Composite
- 19.25/100
- National rank
- #8806
- State rank
- #748 of 826 in TX
Livability — San Antonio
- Score
- 80/100
- State rank
- #31
- US rank
- #1616
Category grades
Schools grade is shown separately in the Schools card above.
Census & demographics
- Census place
- San Antonio, TX
- County
- Bexar County · 1,990,555 people
- City population
- 1,806,925
- Metro
- San Antonio-New Braunfels, TX
- Population (ZIP)
- 42,178
- Household income
- $63,811
- Rent vs Own
- Severe rent burden
- 1180.0
Population outlook (Bexar County) Hauer SSP2
- Today (2025)
- 2,336,851 people
- By 2030
- 2,560,728 · +9.6%
- By 2040
- 3,020,569 · +29.3%
- By 2050
- 3,493,522 · +49.5%
- By 2075
- 4,668,459 · +99.8%
- By 2100
- 5,533,242 · +136.8%
Race, ethnicity, and origin ACS 2023
- Neighborhood character
- Predominantly Hispanic (89%)
- Race & ethnicity
- Hispanic / Latino 89% Two or more races 28% White 9% Native American 2%
- Hispanic origin (detail)
- Mexican 74%
- Common ancestry
- Lithuanian 1% Romanian 1%
- Foreign-born
- 16% · Canada
- Languages at home
- 45% English-only · Spanish 54%
Political lean MEDSL · Bexar
- 2024 margin
- Lean D (+9.8) · D 54.3% · R 44.6% · Other 1.1%
- 2008→2024 swing
- +4.2pp toward D · 2008: 5.6pp · 2024: 9.8pp
- All cycles
- 2024: D+9.8 2020: D+18.2 2016: D+13.5 2012: D+4.6 2008: D+5.6
Not yet ingested
- Civics
- —
Market trends
- HPI YoY
- ▲ 2.03%
- Current HPI
- 251.1635
- Rent YoY
- ▼ -7.21%
- Metro
- San Antonio-New Braunfels, TX
- State GDP YoY
- ▲ 3.95%
- F500 in state
- 110
Industry mix (Fortune 500 HQ in TX)
| Industry | F500 HQs | Revenue |
|---|---|---|
| Energy | 16 | $1,198B |
|
||
| Technology | 5 | $198B |
|
||
| Engineering / Construction | 4 | $72B |
|
||
| Energy Services | 3 | $60B |
|
||
| Utilities | 3 | $41B |
|
||
| Healthcare | 2 | $330B |
|
||
Price history
2 events — show timeline
- 2026-05-21 Listed $172,500 LERA
- 2020-04-14 Sold (Public Records) — Public Records
Property tax history
+8.2%/yrLatest (2025): $4,033 · -0.5% YoY. Source: county tax records.
Cash-flow waterfall
monthlySold comps — $/sqft
last 12 mo · ≤1 miLoading sold comps…