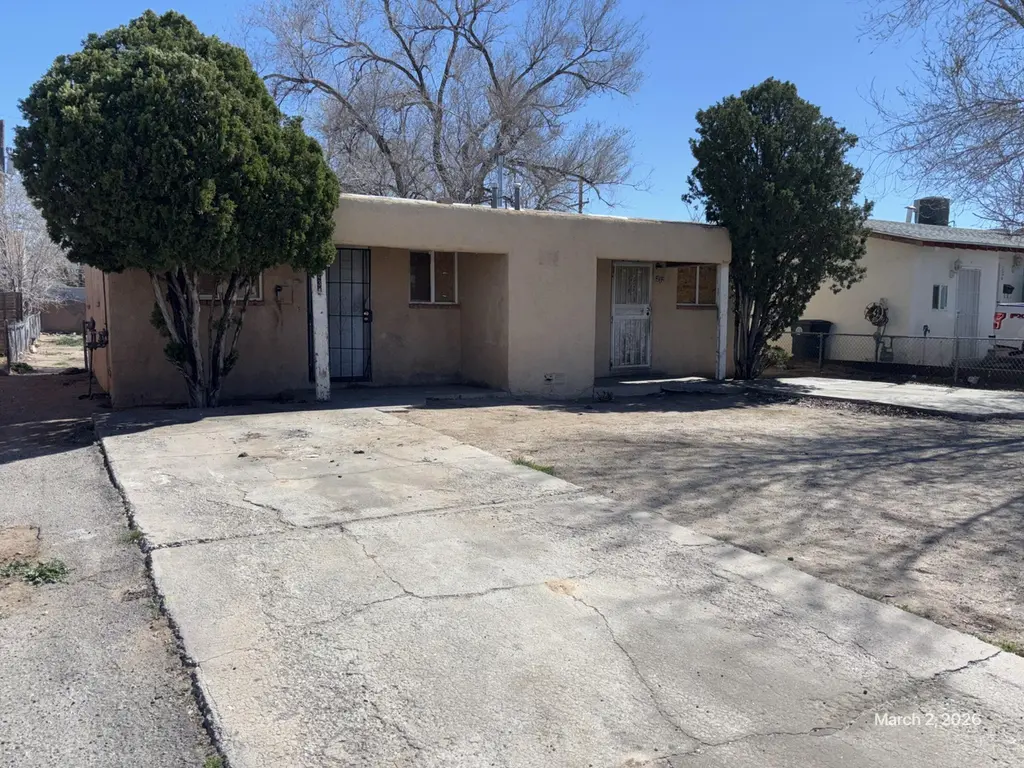
234 Texas St NE · Albuquerque, NM
Flood risk 1/10 · Minimal
- FEMA flood zone
- X (unshaded)
- Chance of flooding over 30 yrs
- 0.0%
- Est. flood insurance / yr
- $507 – $1,088
Fire risk 1/10 · Minimal
- Est. fire insurance / yr
- $706 – $1,312
Heat risk 4/10 · Minor
- Hot days now (above 94°F)
- 6 days/yr
- Hot days in 30 yrs
- 15 days/yr
Wind risk 1/10 · Minimal
- Chance of severe wind over 30 yrs
- —
Air-quality risk 2/10 · Minimal
- Unhealthy air days now
- 1 days/yr
- Unhealthy air days in 30 yrs
- 3 days/yr
Risk factors via First Street. Map © Google.
Why this score? — see what drove the D+ grade
The composite is a weighted blend of 9 inputs, each scored 0–100. Each bar is that input's sub-score; the figure is the points it added to the 100-point composite (weight × sub-score).
- Cash flow +17.5/30.0
- ARV discount +7.5/15.0
- DSCR +5.4/10.0
- Schools +5.3/10.0
- 1% rule +4.3/10.0
- Livability +3.6/5.0
- Rent growth +3.1/5.0
- Condition / age +2.5/5.0
- Appreciation +0.0/10.0
$109,900
🖨 Deal sheet 📄 Offer letter ✓ Due diligence
Listing remarks MLS
This duplex sits on a large lot. Each unit includes one bedroom, one bath and individually metered. Perfect property for a contractor/investor who's looking for property to rehab. Surrounding properties are in good condition.
Key facts
- 6,752 sq ft lot
- Built 1946
- Listed 101 days
Neighborhood map
What this means for you Summary
Snapshot
- This is a 2-bed/2.0-bath other listed at $110k.
Deal economics
- At list price, monthly cash flow is $84 ($1k/yr) — positive.
- The deal already cash-flows at list — no discount required.
- To meet the 1% rule (rent ≥ 1% of price), the offer needs to be $102k (7.3% below list).
- Recommended offer: $100k (9.0% below list) — sets the bar for market timing.
- Cap rate 7.2% vs local median 3.7% in Albuquerque — top-decile yield for the area; either an underpriced asset or a hidden risk that comps aren't pricing in. Stress-test before assuming the spread holds.
Location & tenants
- Location reads 72/100 on livability (#13 in NM) — a middle-class / working-renter tenant base. Strengths: amenities A+, commute A+, cost of living A+; Watch: schools D-, crime F.
- Albuquerque Public Schools (urban): math 51% / reading 75% proficiency, ranked #3 of 29 in NM (top 10%) — acceptable for families but not a draw, mixed tenant base, ~2y average lease; 60% free/reduced lunch — lower-income household profile, screen leases tightly.
- Market conditions: Rents rising (+2.5%/yr); 164 active listings in the ZIP; 40 comparable units currently listed for rent nearby; rentals lingering (median 44d on market — plan ~5-8 weeks vacancy on turnover, expect pricing pressure); 55% of comp listings sitting > 30 days — soft ceiling on asking rent; lower-income renter base — watch delinquency; 1,316 units permitted in Bernalillo County in 2024 (546 in 5+ unit buildings).
Forward outlook
- Local home prices are declining (-3.0%/yr); year-one equity from $760 of loan paydown is wiped out by about $3k of value loss. Plan a longer hold.
Negotiation context
- It's been on market 101 days — a 9% lower offer ($100k) is reasonable based on typical stale-listing flexibility.
Risks & watch-outs
- Watch-outs: built in 1946 — expect roof / HVAC / electrical / plumbing capex.
Questions for the listing agent
- It's been on market 101 days. Have you received any prior offers? Is the seller open to a 9% concession, seller financing, or rate buy-down credit?
- Built in 1946 — when were the roof, HVAC, electrical panel, plumbing, and water heater last replaced?
- Why hasn't it sold? Are there any deal-killer items the seller is aware of (foundation, flood, title, zoning, code violations)?
- Is there a deadline driving the sale (1031 exchange, divorce, estate, relocation)? That informs how much negotiation room exists.
- Schools are D-rated, which usually means shorter tenancies and higher turnover. Who's the typical renter profile here, and what's been the actual vacancy rate?
- Crime grade is F in this area — have there been break-ins, vandalism, or insurance claims at this property in the last 3 years? What carrier currently insures it and at what premium?
- The area grade is low — what's the realistic commute time and amenity access for the typical tenant pool here? Any planned neighborhood developments (good or bad) we should know about?
- What's the average days-on-market for RENTAL listings here right now (not sales)? A rising rental-DOM trend means longer vacancies and softer asking-rent achievability than the comps imply.
- What's the recent tenant-quality profile in this submarket — average credit score on applications, eviction rate, late-payment / NSF rate, and stable-employment percentage? A property-management company in the area should have these aggregated.
- How much new for-sale + rental construction is in the pipeline within 1–3 miles? Heavy new supply typically softens prices + rents 12–24 months out; constrained supply supports both.
Investment metrics
- 1% rule
- 0.93% ✗
- Cap rate
- 7.20%
- Cash-on-cash
- 3.26%
- DSCR
- 1.14
- GRM
- 9.0
CMA / ARV
- ARV (median comp)
- $245,000
- List price
- $109,900
- Delta
- -55.14%
- Verdict
- UNDERPRICED
- Comps
- 2 within 1.0 mi
Projected returns pro-forma
-3.0% appreciation · 2.54% rent growth · sell at horizon
- IRR
- -11.7%
- Equity multiple
- 0.58×
- Total profit
- $-12,967
- Equity at exit
- $16,386
- IRR
- -3.2%
- Equity multiple
- 0.79×
- Total profit
- $-6,383
- Equity at exit
- $9,502
Cash invested: $30,772 (down + closing). Projections, not guarantees.
Landlord ↔ Tenant lean methodology
- Overall (STATE)
- 55 Moderately Landlord-Leaning
- State New Mexico
- 55 Moderately Landlord-Leaning · D+3
- County
- — inherits STATE
- City
- — inherits STATE
ZIP-level market 87108
- Rents YoY
- 2.5%
- Active inventory
- 164
- Price-to-rent
- 9.0×
Monthly cashflow live
- Estimated rent
- $1,019 high interval (Pro) →
- Mortgage (P&I)
- −$576
- Tax from tax record
- −$99 /mo · $1,188/yr
- Insurance
- −$46
- HOA
- −$0
- Vacancy / Maint / Mgmt
- −$214
- Net cashflow
- $84
Break-even live
UW: 25.0% down · 7.5% · 30yr · 1.5% tax · 5.0% vac · 8.0% maint · 8.0% mgmt
Financing live
Cash to close
- Down payment
- $27,475
- Closing costs
- $3,297
- Reserves months
- —
- Total cash needed
- —
Loan-product check · same deal, 3 products live
Conventional
25% down · 7.5% · 30yr
- Down + closing
- —
- Monthly P&I
- —
- Monthly cashflow
- —
- DSCR
- —
- Eligible?
- —
Personal DTI + credit; lowest rate.
DSCR
20% down · 8.5% · 30yr
- Down + closing
- —
- Monthly P&I
- —
- Monthly cashflow
- —
- DSCR
- —
- Eligible?
- —
No personal income docs; deal must DSCR.
Hard money
10% down · 12.0% · 12mo
- Down + closing
- —
- Monthly P&I
- —
- Monthly cashflow
- —
- DSCR
- —
- Eligible?
- —
Short-term bridge; refi at stabilization.
Rent comps 40 comps
| Address | Beds | Baths | Sqft | Rent | $/sqft | DOM | Units | Dist |
|---|---|---|---|---|---|---|---|---|
| 209 Texas St NE Unit 209B Albuquerque, NM | 2.0 | 1.0 | 700 | $950 | $1.36 | 43d | 1 | 0.08mi |
| 209 Texas St NE Albuquerque, NM | 2.0 | 1.0 | 720 | $1,200 | $1.67 | 43d | 1 | 0.08mi |
| 328 Utah St NE Apt A Albuquerque, NM | 2.0 | 1.0 | 700 | $900 | $1.29 | 3d | 1 | 0.13mi |
| 8200 Copper Ave NE Unit A Albuquerque, NM | 2.0 | 1.0 | 735 | $1,149 | $1.56 | 3d | 1 | 0.13mi |
| 328 Rhode Island St NE Unit 1 Albuquerque, NM | 3.0 | 1.0 | 950 | $1,230 | $1.29 | 3d | 1 | 0.14mi |
| 328 Rhode Island St NE Unit 5 Albuquerque, NM | 3.0 | 1.0 | 950 | $1,230 | $1.29 | 43d | 1 | 0.14mi |
| 316 Pennsylvania St NE Unit 320 Pennsylvania -1 Albuquerque, NM | 2.0 | 1.0 | 900 | $900 | $1.00 | 3d | 1 | 0.17mi |
| 324 Vermont St NE Unit 2 Albuquerque, NM | 2.0 | 1.0 | 700 | $995 | $1.42 | 43d | 1 | 0.17mi |
| 217 Pennsylvania St NE Unit 217-E Albuquerque, NM | 2.0 | 1.0 | 800 | $950 | $1.19 | 23d | 1 | 0.20mi |
| 217 Pennsylvania St NE Unit 217-A Albuquerque, NM | 2.0 | 1.0 | 800 | $950 | $1.19 | 43d | 1 | 0.20mi |
| 217 Pennsylvania St NE Unit 217-C Albuquerque, NM | 3.0 | 2.0 | 1278 | $1,400 | $1.10 | 43d | 1 | 0.20mi |
| 340 Pennsylvania St NE Unit C Albuquerque, NM | 2.0 | 1.0 | 700 | $900 | $1.29 | 43d | 1 | 0.20mi |
| 425 Tennessee St NE Albuquerque, NM | 2.0 | 1.0 | 730 | $825 | $1.13 | 43d | 1 | 0.22mi |
| 308 Virginia St NE Unit D Albuquerque, NM | 2.0 | 1.0 | 700 | $850 | $1.21 | 23d | 1 | 0.22mi |
| 428 Rhode Island St NE Unit A Albuquerque, NM | 2.0 | 1.0 | 750 | $1,331 | $1.77 | 43d | 1 | 0.24mi |
| 8000 Grand Ave NE Unit C Albuquerque, NM | 2.0 | 1.0 | 900 | $950 | $1.06 | 3d | 1 | 0.27mi |
| 312 Grove St NE Apt B Albuquerque, NM | 2.0 | 1.0 | 900 | $850 | $0.94 | 23d | 1 | 0.32mi |
| 134 Rhode Island St SE Albuquerque, NM | 2.0 | 1.0 | 765 | $900 | $1.18 | 43d | 1 | 0.33mi |
| 134 Rhode Island St SE Apt A Albuquerque, NM | 2.0 | 1.0 | 765 | $900 | $1.18 | 23d | 1 | 0.33mi |
| 319 General Marshall St NE Apt 2 Albuquerque, NM | 1.0 | 1.0 | 700 | $900 | $1.29 | 43d | 1 | 0.37mi |
| 507 Wisconsin St NE Apt 2B Albuquerque, NM | 2.0 | 1.0 | 1000 | $750 | $0.75 | 23d | 1 | 0.37mi |
| 317 General Marshall St NE #2 Albuquerque, NM | 1.0 | 1.0 | 1093 | $900 | $0.82 | 43d | 1 | 0.37mi |
| 513 Wisconsin St NE Apt 1A Albuquerque, NM | 2.0 | 1.0 | 1085 | $1,577 | $1.45 | 43d | 1 | 0.38mi |
| 332 General Marshall St NE Apt 2 Albuquerque, NM | 1.0 | 1.0 | 780 | $900 | $1.15 | 43d | 1 | 0.41mi |
| 213 San Pablo St NE #4 Albuquerque, NM | 2.0 | 1.0 | 700 | $959 | $1.37 | 23d | 1 | 0.42mi |
| 8313 Marquette Ave NE Unit D Albuquerque, NM | 2.0 | 1.0 | 855 | $1,050 | $1.23 | 19d | 1 | 0.43mi |
| 8401 Marquette Ave NE Unit B Albuquerque, NM | 2.0 | 1.0 | 850 | $850 | $1.00 | 23d | 1 | 0.44mi |
| 8401 Marquette Ave NE Unit C Albuquerque, NM | 2.0 | 1.0 | 850 | $900 | $1.06 | 43d | 1 | 0.44mi |
| 310 Charleston St SE Albuquerque, NM | 1.0 | 1.0 | 700 | $879 | $1.26 | 43d | 1 | 0.47mi |
| 312 Charleston St SE Unit 3 Albuquerque, NM | 2.0 | 1.0 | 800 | $920 | $1.15 | 44d | 1 | 0.48mi |
| 143 General Arnold St NE Apt D Albuquerque, NM | 1.0 | 1.0 | 765 | $800 | $1.05 | 23d | 1 | 0.49mi |
| 143 General Arnold St NE Apt A Albuquerque, NM | 1.0 | 1.0 | 765 | $775 | $1.01 | 43d | 1 | 0.49mi |
| 117 General Arnold St NE Unit A Albuquerque, NM | 2.0 | 1.0 | 850 | $895 | $1.05 | 23d | 1 | 0.52mi |
| 117 General Arnold St NE Apt C Albuquerque, NM | 2.0 | 1.0 | 825 | $1,075 | $1.30 | 43d | 1 | 0.52mi |
| 148 General Arnold St NE Apt 4 Albuquerque, NM | 1.0 | 1.0 | 700 | $850 | $1.21 | 43d | 1 | 0.53mi |
| 148 General Arnold St NE Apt 5 Albuquerque, NM | 2.0 | 1.0 | 1000 | $800 | $0.80 | 14d | 1 | 0.53mi |
| 105 General Arnold St NE Apt B Albuquerque, NM | 2.0 | 1.0 | 850 | $950 | $1.12 | 43d | 1 | 0.53mi |
| 132 General Arnold St NE Apt D Albuquerque, NM | 2.0 | 1.0 | 1000 | $1,000 | $1.00 | 14d | 1 | 0.54mi |
| 408 Pennsylvania St SE Unit B Albuquerque, NM | 1.0 | 1.0 | 827 | $850 | $1.03 | 43d | 1 | 0.55mi |
| 420 Rhode Island St SE Albuquerque, NM | 2.0 | 1.0 | 916 | $1,150 | $1.26 | 3d | 1 | 0.57mi |
Listing history 20 events
-
2026-06-18days on market $109,900 Active 101 DOM
-
2026-06-17days on market $109,900 Active 100 DOM
-
2026-06-16days on market $109,900 Active 99 DOM
-
2026-06-15days on market $109,900 Active 98 DOM
-
2026-06-13days on market $109,900 Active 96 DOM
-
2026-06-10days on market $109,900 Active 93 DOM
-
2026-06-09days on market $109,900 Active 92 DOM
-
2026-06-08days on market $109,900 Active 91 DOM
-
2026-06-07days on market $109,900 Active 90 DOM
-
2026-06-05pricedays on market $109,900 Active 87 DOM
-
2026-06-03days on market $119,900 Active 86 DOM
-
2026-06-02days on market $119,900 Active 85 DOM
-
2026-06-01days on market $119,900 Active 84 DOM
-
2026-05-31days on market $119,900 Active 83 DOM
-
2026-05-02price $119,900 225-char remark
Show marketing remark (225 chars)
This duplex sits on a large lot. Each unit includes one bedroom, one bath and individually metered. Perfect property for a contractor/investor who's looking for property to rehab. Surrounding properties are in good condition.
-
2026-04-01price $129,000 225-char remark
Show marketing remark (225 chars)
This duplex sits on a large lot. Each unit includes one bedroom, one bath and individually metered. Perfect property for a contractor/investor who's looking for property to rehab. Surrounding properties are in good condition.
-
2026-03-06$140,000 Active 225-char remark
Show marketing remark (225 chars)
This duplex sits on a large lot. Each unit includes one bedroom, one bath and individually metered. Perfect property for a contractor/investor who's looking for property to rehab. Surrounding properties are in good condition.
-
2023-05-24price $180,000
-
2018-06-13soldstatus
-
2006-04-03soldstatus
ⓘ Source: listings_history table (triggers on properties + properties_extension) + one-shot
backfill from property_details.listing_events for pre-trigger history.
Tax reassessment forecast NM · Resets to sale price
- Current annual tax
- $1,188 · $99/mo
- Projected year-2 tax
- $1,188 · $99/mo
- Expected delta
- $0/yr ($0/mo · 0.0%)
ⓘ Screening estimate from a state-policy table — verify with the county assessor before closing.
Climate risk First Street
- Flood 1/10 Low FEMA zone X (unshaded) · 0% chance over 30 yrs
- Wildfire 1/10 Low
- Heat 4/10 Moderate 6 d/yr ≥94°F today · 15 d/yr by 30 yrs out
- Wind 1/10 Low
- Air quality 2/10 Low 1 unhealthy d/yr today · 3 by 30 yrs out
Nearby sold comps map
Loading sold comps map…
Walkable amenities ~0.75 mi
Loading nearby amenities…
Taxation est. · year 1
- Rental income
- $12,223
- − Mortgage interest
- −$6,156
- − Property taxes
- −$1,188
- − Insurance
- −$550
- − Repairs & maintenance
- −$978
- − Management
- −$978
- − Depreciation
- −$3,197
- Taxable loss
- −$824
- Est. tax savings @ 24.0%
- +$198
- After-tax cash flow
- $1,200/yr
For passive investors: Depreciation is non-cash, so a rental often shows a tax loss while cash-flowing — sheltering income. Rental losses are passive: they offset passive income freely, and up to $25,000/yr can offset ordinary (W-2) income if you actively participate and your MAGI is under $100k (phasing out to $0 by $150k); unused losses carry forward. On sale, claimed depreciation is recaptured at up to 25%, and gains may owe capital-gains tax (a 1031 exchange can defer both). Figures are a year-1 estimate at your 24.0% rate — not tax advice; consult a CPA.
Schools (NCES district)
- District
- Albuquerque Public Schools
- NCES district ID
- 3500060
- Math proficiency
- 51% ▲ 30.00%
- Reading proficiency
- 75% ▲ 45.00%
- Median HH income
- $48,151
- Composite
- 53.29/100
- National rank
- #1487
- State rank
- #3 of 29 in NM
Livability — Albuquerque
- Score
- 72/100
- State rank
- #13
- US rank
- #6219
Category grades
Schools grade is shown separately in the Schools card above.
Census & demographics
- Census place
- Albuquerque, NM
- County
- Bernalillo County · 647,165 people
- City population
- 647,165
- Metro
- Albuquerque, NM
- Population (ZIP)
- 36,331
- Household income
- $42,724
- Rent vs Own
- Severe rent burden
- 3480.0
Population outlook (Bernalillo County) Hauer SSP2
- Today (2025)
- 704,528 people
- By 2030
- 711,723 · +1.0%
- By 2040
- 714,522 · +1.4%
- By 2050
- 709,274 · +0.7%
- By 2075
- 680,015 · -3.5%
- By 2100
- 619,879 · -12.0%
Race, ethnicity, and origin ACS 2023
- Neighborhood character
- Diverse neighborhood (Simpson 0.64)
- Race & ethnicity
- Hispanic / Latino 49% White 34% Two or more races 21% Native American 6% Black 5% Asian 3%
- Hispanic origin (detail)
- Mexican 31% Cuban 3%
- Common ancestry
- Lithuanian 2% Slovak 1% Romanian 1%
- Foreign-born
- 18% · Canada, Vietnam
- Languages at home
- 67% English-only · Spanish 26% Other Indo-European 2% Tagalog/Filipino 1%
Political lean MEDSL · Bernalillo
- 2024 margin
- Strong D (+21.0) · D 59.2% · R 38.2% · Other 2.6%
- 2008→2024 swing
- -0.3pp no change · 2008: 21.4pp · 2024: 21.0pp
- All cycles
- 2024: D+21.0 2020: D+24.4 2016: D+17.8 2012: D+16.2 2008: D+21.4
Not yet ingested
- Civics
- —
Market trends
- HPI YoY
- ▼ -228.14%
- Current HPI
- 238.53
- Rent YoY
- ▲ 2.54%
- Metro
- Albuquerque, NM
- State GDP YoY
- —
- F500 in state
- 0
Price history
-33.4% since first listed6 events — show timeline
- 2026-05-02 Price Changed $119,900 Southwest MLS
- 2026-04-01 Price Changed $129,000 Southwest MLS
- 2026-03-06 Listed $140,000 Southwest MLS
- 2023-05-24 Price Changed $180,000 Southwest MLS
- 2018-06-13 Sold (Public Records) — Public Records
- 2006-04-03 Sold (Public Records) — Public Records
Property tax history
+2.3%/yrLatest (2025): $1,188 · +3.2% YoY. Source: county tax records.
Cash-flow waterfall
monthlySold comps — $/sqft
last 12 mo · ≤1 miLoading sold comps…