16 Golden Acre Rd · Jasper, AR
Flood risk No data
- FEMA flood zone
- —
- Chance of flooding over 30 yrs
- —
- Est. flood insurance / yr
- —
Fire risk No data
- Est. fire insurance / yr
- —
Heat risk No data
- Hot days now (above threshold)
- —
- Hot days in 30 yrs
- —
Wind risk No data
- Chance of severe wind over 30 yrs
- —
Air-quality risk No data
- Unhealthy air days now
- —
- Unhealthy air days in 30 yrs
- —
Risk factors via First Street. Map © Google.
Why this score? — see what drove the C grade
The composite is a weighted blend of 9 inputs, each scored 0–100. Each bar is that input's sub-score; the figure is the points it added to the 100-point composite (weight × sub-score).
- Cash flow +22.1/30.0
- ARV discount +7.5/15.0
- DSCR +7.1/10.0
- 1% rule +5.8/10.0
- Schools +3.7/10.0
- Appreciation +3.5/10.0
- Livability +3.1/5.0
- Condition / age +2.8/5.0
- Rent growth +2.5/5.0
$173,000
🖨 Deal sheet (PDF) 📄 Offer letter ✓ Due diligence
Listing remarks MLS
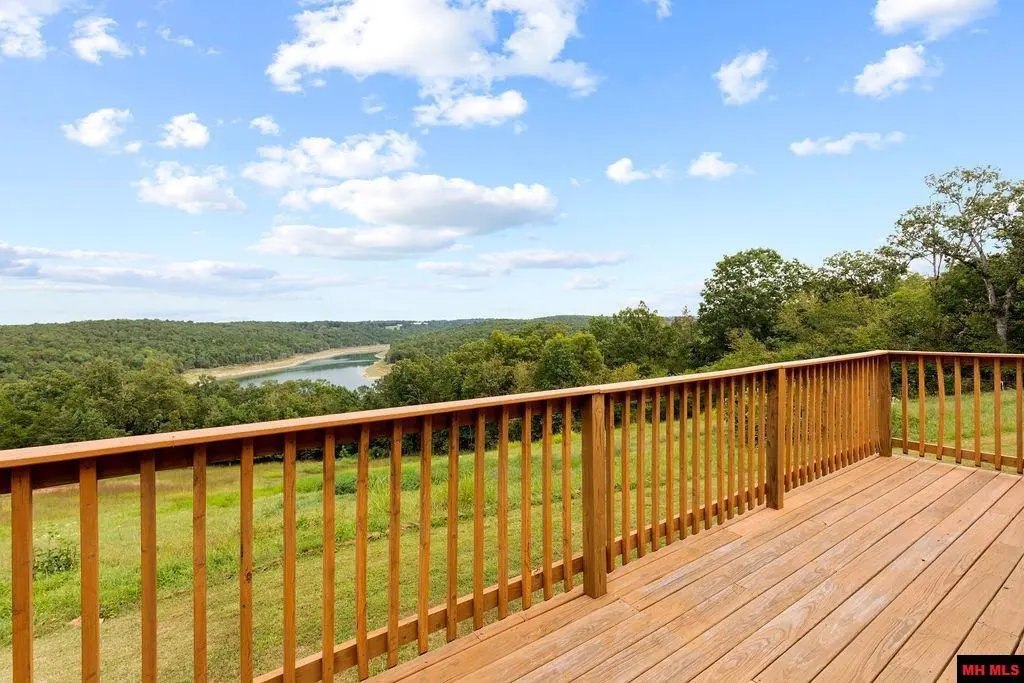
Here's a fully furnished 2 bedroom, 1 bath Bull Shoals Lake cabin with year round views. Large private deck. Use of a pool and common areas. Public boat ramp less than a half mile down the road. This property would be ideal for a cabin or short term rental unit.
Key facts
- Public boat ramp
- Large private deck
- 1,742 sq ft lot
Tags
Neighborhood map
What this means for you Summary
Snapshot
- This is a 2-bed/1.0-bath single-family listed at $173k. Condition is rated average.
Deal economics
- At list price, monthly cash flow is $280 ($3k/yr) — positive.
- The deal already cash-flows at list — no discount required.
- Meets the 1% rule at list price ($2k rent vs $173k).
- Recommended offer: $152k (12.0% below list) — sets the bar for market timing.
- Cap rate 8.2% vs local median 3.5% in Jasper — top-decile yield for the area; either an underpriced asset or a hidden risk that comps aren't pricing in. Stress-test before assuming the spread holds.
Location & tenants
- Location reads 62/100 on livability (#217 in AR) — a middle-class / working-renter tenant base. Strengths: cost of living A+, health & safety A+; Watch: schools D, crime F, amenities F.
- Mountain Home School District (town): math 45% / reading 45% proficiency, ranked #40 of 238 in AR (top 17%) — families likely to look elsewhere, expect single-tenant / working-renter base with shorter leases.
- Market conditions: 76 active listings in the ZIP; 47 units permitted in Baxter County in 2024 (0 in 5+ unit buildings).
Forward outlook
- Local home prices are declining (-2.9%/yr); year-one equity from $1k of loan paydown is wiped out by about $5k of value loss. Plan a longer hold.
- Baxter County population projected to shrink 9% by 2050 — rents likely to lag national; underwrite the cash flow, not the appreciation.
Negotiation context
- It's been on market 276 days — a 12% lower offer ($152k) is reasonable based on typical stale-listing flexibility.
Questions for the listing agent
- It's been on market 276 days. Have you received any prior offers? Is the seller open to a 12% concession, seller financing, or rate buy-down credit?
- Why hasn't it sold? Are there any deal-killer items the seller is aware of (foundation, flood, title, zoning, code violations)?
- Is there a deadline driving the sale (1031 exchange, divorce, estate, relocation)? That informs how much negotiation room exists.
- Schools are D-rated, which usually means shorter tenancies and higher turnover. Who's the typical renter profile here, and what's been the actual vacancy rate?
- Crime grade is F in this area — have there been break-ins, vandalism, or insurance claims at this property in the last 3 years? What carrier currently insures it and at what premium?
- What's the average days-on-market for RENTAL listings here right now (not sales)? A rising rental-DOM trend means longer vacancies and softer asking-rent achievability than the comps imply.
- What's the recent tenant-quality profile in this submarket — average credit score on applications, eviction rate, late-payment / NSF rate, and stable-employment percentage? A property-management company in the area should have these aggregated.
- How much new for-sale + rental construction is in the pipeline within 1–3 miles? Heavy new supply typically softens prices + rents 12–24 months out; constrained supply supports both.
Investment metrics
- 1% rule
- 1.08% ✓
- Cap rate
- 8.23%
- Cash-on-cash
- 6.93%
- DSCR
- 1.31
- GRM
- 7.7
CMA / ARV
- ARV (median comp)
- $80,716
- List price
- $173,000
- Delta
- 114.33%
- Verdict
- OVERPRICED
- Comps
- 1 within 2.0 mi
Projected returns pro-forma
-2.91% appreciation · 3.0% rent growth · sell at horizon
- IRR
- -5.3%
- Equity multiple
- 0.80×
- Total profit
- $-9,545
- Equity at exit
- $26,468
- IRR
- 4.3%
- Equity multiple
- 1.32×
- Total profit
- $15,296
- Equity at exit
- $16,117
Cash invested: $48,440 (down + closing). Projections, not guarantees.
Landlord ↔ Tenant lean methodology
- Overall (STATE)
- 92 Strongly Landlord-Friendly
- State Arkansas
- 92 Strongly Landlord-Friendly · R+14
- County
- — inherits STATE
- City
- — inherits STATE
ZIP-level market 72641
- Home prices YoY
- -1.5%
- Active inventory
- 76
- Price-to-rent
- 7.7×
Monthly cashflow live
- Estimated rent
- $1,868 medium interval (Pro) →
- Mortgage (P&I)
- −$907
- Tax est. 1.5%
- −$216 /mo · $2,595/yr
- Insurance
- −$72
- HOA
- −$0
- Vacancy / Maint / Mgmt
- −$392
- Net cashflow
- $280
Break-even live
Sensitivity live
| Price | -10% $399 | -5% $340 | +0% $280 | +5% $220 | +10% $160 |
|---|---|---|---|---|---|
| Rent | -10% $132 | -5% $206 | +0% $280 | +5% $354 | +10% $427 |
| Rate | -1.0pp $367 | -0.5pp $324 | base $280 | +0.5pp $235 | +1.0pp $189 |
UW: 25.0% down · 7.5% · 30yr · 1.5% tax · 5.0% vac · 8.0% maint · 8.0% mgmt
Financing live
Cash to close
- Down payment
- $43,250
- Closing costs
- $5,190
- Reserves months
- —
- Total cash needed
- —
Loan-product check · same deal, 3 products live
Conventional
25% down · 7.5% · 30yr
- Down + closing
- —
- Monthly P&I
- —
- Monthly cashflow
- —
- DSCR
- —
- Eligible?
- —
Personal DTI + credit; lowest rate.
DSCR
20% down · 8.5% · 30yr
- Down + closing
- —
- Monthly P&I
- —
- Monthly cashflow
- —
- DSCR
- —
- Eligible?
- —
No personal income docs; deal must DSCR.
Hard money
10% down · 12.0% · 12mo
- Down + closing
- —
- Monthly P&I
- —
- Monthly cashflow
- —
- DSCR
- —
- Eligible?
- —
Short-term bridge; refi at stabilization.
Listing history 19 events
-
2026-06-21days on market $173,000 Active 276 DOM
-
2026-06-19days on market $173,000 Active 274 DOM
-
2026-06-18days on market $173,000 Active 273 DOM
-
2026-06-17days on market $173,000 Active 272 DOM
-
2026-06-16days on market $173,000 Active 271 DOM
-
2026-06-15days on market $173,000 Active 270 DOM
-
2026-06-14days on market $173,000 Active 268 DOM
-
2026-06-12days on market $173,000 Active 267 DOM
-
2026-06-09days on market $173,000 Active 264 DOM
-
2026-06-08days on market $173,000 Active 263 DOM
-
2026-06-07days on market $173,000 Active 262 DOM
-
2026-06-05days on market $173,000 Active 259 DOM
-
2026-06-02days on market $173,000 Active 257 DOM
-
2026-06-01days on market $173,000 Active 256 DOM
-
2026-05-31days on market $173,000 Active 255 DOM
-
2026-05-30days on market $173,000 Active 254 DOM
-
2025-11-05price $173,000 262-char remark
Show marketing remark (262 chars)
Here's a fully furnished 2 bedroom, 1 bath Bull Shoals Lake cabin with year round views. Large private deck. Use of a pool and common areas. Public boat ramp less than a half mile down the road. This property would be ideal for a cabin or short term rental unit.
-
2025-10-29price $189,000 262-char remark
Show marketing remark (262 chars)
Here's a fully furnished 2 bedroom, 1 bath Bull Shoals Lake cabin with year round views. Large private deck. Use of a pool and common areas. Public boat ramp less than a half mile down the road. This property would be ideal for a cabin or short term rental unit.
-
2025-09-18$199,000 Active 262-char remark
Show marketing remark (262 chars)
Here's a fully furnished 2 bedroom, 1 bath Bull Shoals Lake cabin with year round views. Large private deck. Use of a pool and common areas. Public boat ramp less than a half mile down the road. This property would be ideal for a cabin or short term rental unit.
ⓘ Source: listings_history table (triggers on properties + properties_extension) + one-shot
backfill from property_details.listing_events for pre-trigger history.
Nearby sold comps map
Loading sold comps map…
Walkable amenities ~0.75 mi
Loading nearby amenities…
Taxation est. · year 1
- Rental income
- $22,412
- − Mortgage interest
- −$9,691
- − Property taxes
- −$2,595
- − Insurance
- −$865
- − Repairs & maintenance
- −$1,793
- − Management
- −$1,793
- − Depreciation
- −$5,033
- Taxable income
- $643
- Est. tax owed @ 24.0%
- −$154
- After-tax cash flow
- $3,204/yr
For passive investors: Depreciation is non-cash, so a rental often shows a tax loss while cash-flowing — sheltering income. Rental losses are passive: they offset passive income freely, and up to $25,000/yr can offset ordinary (W-2) income if you actively participate and your MAGI is under $100k (phasing out to $0 by $150k); unused losses carry forward. On sale, claimed depreciation is recaptured at up to 25%, and gains may owe capital-gains tax (a 1031 exchange can defer both). Figures are a year-1 estimate at your 24.0% rate — not tax advice; consult a CPA.
Condition & rehab AI · 11 photos
A fully furnished 2-bedroom cabin with average condition, offering a good investment opportunity for a cosmetic renovation.
Repairs flagged
- Minor kitchen cabinets — slight wear
- Minor bathroom fixtures — basic and dated
- Minor interior paint — light wear
Value-add opportunities
- Both paint interior walls — enhances curb appeal and interior aesthetics
- Both replace basic appliances — improves functionality and appeal
- Both repair and upgrade small deck — enhances outdoor living space and curb appeal
Renovation cost estimate screening
| Repair item | Severity | Est. cost |
|---|---|---|
| kitchen cabinets · slight wear | Minor | $500–3,000 |
| bathroom fixtures · basic and dated | Minor | $500–3,000 |
| interior paint · light wear | Minor | $500–3,000 |
| Total estimated repair cost · 3 items | $1,500–9,000 |
Value-add ROI direction
- Both paint interior walls — enhances curb appeal and interior aesthetics ↑
- Both replace basic appliances — improves functionality and appeal ↑
- Both repair and upgrade small deck — enhances outdoor living space and curb appeal ↑
ⓘ Cost ranges are severity-bucket heuristics (US national rule-of-thumb). Get contractor quotes + a written scope before underwriting a rehab budget.
Schools (NCES district)
- District
- Mountain Home School District
- NCES district ID
- 0500043
- Math proficiency
- 45% ▼ -8.00%
- Reading proficiency
- 45% ▼ -4.00%
- Median HH income
- $36,966
- Composite
- 37.4/100
- National rank
- #4424
- State rank
- #40 of 238 in AR
Livability — Jasper
- Score
- 62/100
- State rank
- #217
- US rank
- #16736
Category grades
Schools grade is shown separately in the Schools card above.
Census & demographics
- Population (ZIP)
- 2,063
Population outlook (Baxter County) Hauer SSP2
- Today (2025)
- 39,886 people
- By 2030
- 39,226 · -1.7%
- By 2040
- 37,810 · -5.2%
- By 2050
- 36,287 · -9.0%
- By 2075
- 32,965 · -17.4%
- By 2100
- 28,002 · -29.8%
Race, ethnicity, and origin ACS 2023
- Neighborhood character
- Predominantly White (93%)
- Race & ethnicity
- White 93% Hispanic / Latino 6%
- Hispanic origin (detail)
- Mexican 5%
- Common ancestry
- Slovak 2% Lithuanian 2% Serbian 1%
- Foreign-born
- 2%
- Languages at home
- 98% English-only · Other Indo-European 1%
Political lean MEDSL · Baxter
- 2024 margin
- Solid R (+56.9) · D 20.7% · R 77.6% · Other 1.7%
- 2008→2024 swing
- -25.3pp toward R · 2008: -31.6pp · 2024: -56.9pp
- All cycles
- 2024: R+56.9 2020: R+53.3 2016: R+53.6 2012: R+44.0 2008: R+31.6
Not yet ingested
- Civics
- —
Market trends
- HPI YoY
- ▼ -2.91%
- Current HPI
- 195.4325
- Rent YoY
- —
- Metro
- —
- State GDP YoY
- ▲ 3.80%
- F500 in state
- 10
Industry mix (Fortune 500 HQ in AR)
| Industry | F500 HQs | Revenue |
|---|---|---|
| Retail | 1 | $681B |
|
||
| Food / Agriculture | 1 | $53B |
|
||
| Retail / Energy | 1 | $22B |
|
||
| Transportation / Logistics | 1 | $12B |
|
||
| Energy | 1 | $4B |
|
||
Price history
-13.1% since first listed3 events — show timeline
- 2025-11-05 Price Changed $173,000 MHMLS
- 2025-10-29 Price Changed $189,000 MHMLS
- 2025-09-18 Listed $199,000 MHMLS
Cash-flow waterfall
monthlySold comps — $/sqft
last 12 mo · ≤1 miLoading sold comps…