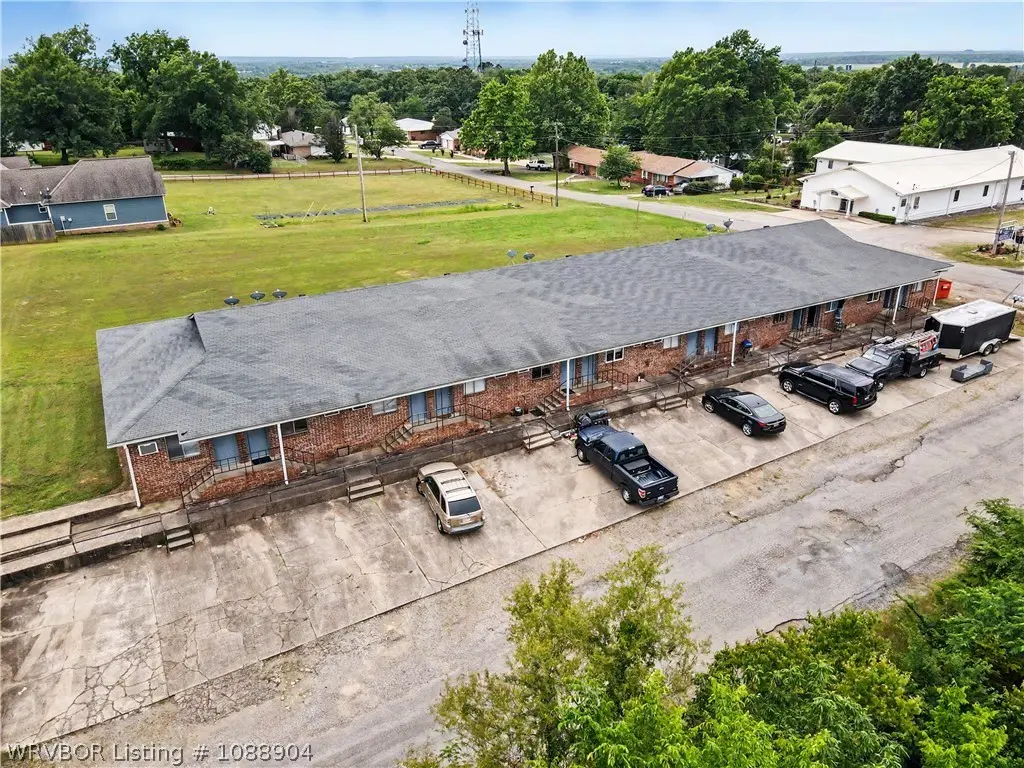
317 Young St · Arkoma, OK
Flood risk 1/10 · Minimal
- FEMA flood zone
- X (unshaded)
- Chance of flooding over 30 yrs
- 0.0%
- Est. flood insurance / yr
- $507 – $1,088
Fire risk 4/10 · Minor
- Est. fire insurance / yr
- $2,463 – $4,575
Heat risk 6/10 · Moderate
- Hot days now (above 111°F)
- 7 days/yr
- Hot days in 30 yrs
- 19 days/yr
Wind risk 2/10 · Minimal
- Chance of severe wind over 30 yrs
- 3.0%
Air-quality risk 2/10 · Minimal
- Unhealthy air days now
- 0 days/yr
- Unhealthy air days in 30 yrs
- 1 days/yr
Risk factors via First Street. Map © Google.
Why this score? — see what drove the F grade
The composite is a weighted blend of 9 inputs, each scored 0–100. Each bar is that input's sub-score; the figure is the points it added to the 100-point composite (weight × sub-score).
- ARV discount +7.5/15.0
- Appreciation +5.0/10.0
- Livability +2.8/5.0
- Schools +2.7/10.0
- Rent growth +2.5/5.0
- Condition / age +2.5/5.0
- Cash flow +0.0/30.0
- 1% rule +0.0/10.0
- DSCR +0.0/10.0
$600,000
🖨 Deal sheet (PDF) 📄 Offer letter ✓ Due diligence
Listing remarks
Excellent opportunity to acquire a 12-unit multifamily property just minutes from Fort Smith with strong rental demand and value-add potential. Property features primarily 1-bedroom/1-bath units with multiple updated interiors. Some units have recent improvements including flooring, paint, and fixtures. Owner currently pays water, helping keep operations simple for tenants. Located near the Arkansas/Oklahoma state line with convenient access to shopping, employment, and major highways, this property offers investors the chance to expand cash flow while still remaining in an affordable price point. Potential upside through rent increases, additional improvements, and operational efficiencies
Key facts
- Multifamily property
- Convenient access
- Updated interiors
Tags
Property features AI
Exterior
- Parking: 12 covered parking spaces; 1 total parking space noted; Concrete parking area; Carport
- Home design: One-story apartment; Slab foundation; Brick construction
- Construction: Brick exterior; Slab foundation; Shingle roof
- Exterior features: Cleared lot; Shingle roof
Interior
- Flooring: Laminate
- Heating & cooling: Baseboard heating; Window air conditioning units
- Interior features: Electric water heater; Laminate flooring
- Laundry & utility: No laundry hookups inside
Neighborhood map
What this means for you Summary
Snapshot
- This is a ?-bed/12.0-bath townhouse listed at $600k.
Deal economics
- At list price, monthly cash flow is $-4k ($-45k/yr) — negative.
- Rent doesn't cover operating costs at any purchase price — skip.
- Recommended offer: $582k (3.0% below list) — sets the bar for market timing.
Location & tenants
- Location reads 56/100 on livability (#508 in OK) — a working-class tenant base; expect higher turnover. Strengths: cost of living A+, housing A; Watch: schools F, crime F, amenities F.
- Arkoma (suburban): math 25% / reading 35% proficiency, ranked #287 of 513 in OK (top 56%) — families likely to look elsewhere, expect single-tenant / working-renter base with shorter leases; 70% free/reduced lunch — lower-income household profile, screen leases tightly.
- Market conditions: 6 active listings in the ZIP; 73 units permitted in Le Flore County in 2024 (0 in 5+ unit buildings).
Forward outlook
- In year one you build about $22k of equity ($4k loan paydown + $18k appreciation (3.0% local appreciation)).
- Le Flore County population projected at -13% by 2050 — secular population decline; favor cash flow + early exit over multi-decade hold.
- By year 2, paydown + projected appreciation supports a ~$36k cash-out refi (75% LTV) — recoverable capital for the next deal without selling this one.
Negotiation context
- It's been on market 43 days — a 3% lower offer ($582k) is reasonable based on typical stale-listing flexibility.
- Current owner paid $475k; 26% above their basis — modest negotiation headroom, anchor on the comps not their cost.
Risks & watch-outs
- Climate carrying-cost: extreme-heat days projected 7→19/yr by 2055 (HVAC capex compounding) — expect insurance premiums to compound above CPI over the hold.
Questions for the listing agent
- What do current leases actually rent for vs. the listed asking? Can we see a recent rent roll and the last 12 months of T-12 income?
- It's been on market 43 days. Have you received any prior offers? Is the seller open to a 3% concession, seller financing, or rate buy-down credit?
- Built in 1971 — when were the roof, HVAC, electrical panel, plumbing, and water heater last replaced?
- Is there a deadline driving the sale (1031 exchange, divorce, estate, relocation)? That informs how much negotiation room exists.
- Schools are F-rated, which usually means shorter tenancies and higher turnover. Who's the typical renter profile here, and what's been the actual vacancy rate?
- Crime grade is F in this area — have there been break-ins, vandalism, or insurance claims at this property in the last 3 years? What carrier currently insures it and at what premium?
- The area grade is low — what's the realistic commute time and amenity access for the typical tenant pool here? Any planned neighborhood developments (good or bad) we should know about?
- What's the average days-on-market for RENTAL listings here right now (not sales)? A rising rental-DOM trend means longer vacancies and softer asking-rent achievability than the comps imply.
- What's the recent tenant-quality profile in this submarket — average credit score on applications, eviction rate, late-payment / NSF rate, and stable-employment percentage? A property-management company in the area should have these aggregated.
- How much new for-sale + rental construction is in the pipeline within 1–3 miles? Heavy new supply typically softens prices + rents 12–24 months out; constrained supply supports both.
Investment metrics
- 1% rule
- 0.00% ✗
- Cap rate
- -1.15%
- Cash-on-cash
- -26.58%
- DSCR
- -0.18
- GRM
- 0.0
CMA / ARV
No comps found within radius.
Projected returns pro-forma
3.0% appreciation · 3.0% rent growth · sell at horizon
- IRR
- -16.8%
- Equity multiple
- 0.02×
- Total profit
- $-164,989
- Equity at exit
- $269,786
- IRR
- -9.4%
- Equity multiple
- -0.52×
- Total profit
- $-255,454
- Equity at exit
- $415,772
Cash invested: $168,000 (down + closing). Projections, not guarantees.
Landlord ↔ Tenant lean methodology
- Overall (STATE)
- 83 Strongly Landlord-Friendly
- State Oklahoma
- 83 Strongly Landlord-Friendly · R+20
- County
- — inherits STATE
- City
- — inherits STATE
ZIP-level market 74901
- Active inventory
- 6
Monthly cashflow live
- Estimated rent
- $0 none
- Mortgage (P&I)
- −$3,146
- Tax from tax record
- −$325 /mo · $3,897/yr
- Insurance
- −$250
- HOA
- −$0
- Vacancy / Maint / Mgmt
- −$0
- Net cashflow
- $-3,721
Break-even live
Sensitivity live
| Price | -10% $-3,382 | -5% $-3,551 | +0% $-3,721 | +5% $-3,891 | +10% $-4,061 |
|---|---|---|---|---|---|
| Rent | -10% $-3,721 | -5% $-3,721 | +0% $-3,721 | +5% $-3,721 | +10% $-3,721 |
| Rate | -1.0pp $-3,419 | -0.5pp $-3,569 | base $-3,721 | +0.5pp $-3,877 | +1.0pp $-4,035 |
UW: 25.0% down · 7.5% · 30yr · 1.5% tax · 5.0% vac · 8.0% maint · 8.0% mgmt
Financing live
Cash to close
- Down payment
- $150,000
- Closing costs
- $18,000
- Reserves months
- —
- Total cash needed
- —
Loan-product check · same deal, 3 products live
Conventional
25% down · 7.5% · 30yr
- Down + closing
- —
- Monthly P&I
- —
- Monthly cashflow
- —
- DSCR
- —
- Eligible?
- —
Personal DTI + credit; lowest rate.
DSCR
20% down · 8.5% · 30yr
- Down + closing
- —
- Monthly P&I
- —
- Monthly cashflow
- —
- DSCR
- —
- Eligible?
- —
No personal income docs; deal must DSCR.
Hard money
10% down · 12.0% · 12mo
- Down + closing
- —
- Monthly P&I
- —
- Monthly cashflow
- —
- DSCR
- —
- Eligible?
- —
Short-term bridge; refi at stabilization.
Listing history 18 events
-
2026-06-19days on market $600,000 Active 43 DOM
-
2026-06-18days on market $600,000 Active 42 DOM
-
2026-06-17days on market $600,000 Active 41 DOM
-
2026-06-16days on market $600,000 Active 40 DOM
-
2026-06-15days on market $600,000 Active 39 DOM
-
2026-06-14days on market $600,000 Active 37 DOM
-
2026-06-13days on market $600,000 Active 36 DOM
-
2026-06-10days on market $600,000 Active 34 DOM
-
2026-06-09days on market $600,000 Active 33 DOM
-
2026-06-08days on market $600,000 Active 32 DOM
-
2026-06-07days on market $600,000 Active 31 DOM
-
2026-06-02days on market $600,000 Active 26 DOM
-
2026-06-01days on market $600,000 Active 25 DOM
-
2026-05-31days on market $600,000 Active 24 DOM
-
2026-05-30days on market $600,000 Active 23 DOM
-
2026-05-07$600,000 Active
-
2024-05-10soldstatus $475,000
-
2017-10-16soldstatus $120,000
ⓘ Source: listings_history table (triggers on properties + properties_extension) + one-shot
backfill from property_details.listing_events for pre-trigger history.
Tax reassessment forecast OK · Resets to sale price
- Current annual tax
- $3,897 · $325/mo
- Projected year-2 tax
- $5,400 · $450/mo
- Expected delta
- +$1,503/yr (+$125/mo · 38.6%)
ⓘ Screening estimate from a state-policy table — verify with the county assessor before closing.
Climate risk First Street
- Flood 1/10 Low FEMA zone X (unshaded) · 0% chance over 30 yrs
- Wildfire 4/10 Moderate
- Heat 6/10 Major 7 d/yr ≥111°F today · 19 d/yr by 30 yrs out
- Wind 2/10 Low 3% chance of damaging wind over 30 yrs
- Air quality 2/10 Low 0 unhealthy d/yr today · 1 by 30 yrs out
Nearby sold comps map
Loading sold comps map…
Walkable amenities ~0.75 mi
Loading nearby amenities…
Taxation est. · year 1
- Rental income
- $0
- − Mortgage interest
- −$33,609
- − Property taxes
- −$3,897
- − Insurance
- −$3,000
- − Repairs & maintenance
- −$0
- − Management
- −$0
- − Depreciation
- −$17,455
- Taxable loss
- −$57,961
- Est. tax savings @ 24.0%
- +$13,911
- After-tax cash flow
- $-30,744/yr
For passive investors: Depreciation is non-cash, so a rental often shows a tax loss while cash-flowing — sheltering income. Rental losses are passive: they offset passive income freely, and up to $25,000/yr can offset ordinary (W-2) income if you actively participate and your MAGI is under $100k (phasing out to $0 by $150k); unused losses carry forward. On sale, claimed depreciation is recaptured at up to 25%, and gains may owe capital-gains tax (a 1031 exchange can defer both). Figures are a year-1 estimate at your 24.0% rate — not tax advice; consult a CPA.
Schools (NCES district)
- District
- Arkoma
- NCES district ID
- 4003210
- Math proficiency
- 25% ▼ -5.00%
- Reading proficiency
- 35% ▲ 5.00%
- Median HH income
- $27,858
- Composite
- 26.9/100
- National rank
- #12525
- State rank
- #287 of 513 in OK
Livability — Arkoma
- Score
- 56/100
- State rank
- #508
- US rank
- #22597
Category grades
Schools grade is shown separately in the Schools card above.
Census & demographics
- Census place
- Arkoma, OK
- Population (ZIP)
- 2,001
Population outlook (Le Flore County) Hauer SSP2
- Today (2025)
- 48,504 people
- By 2030
- 47,474 · -2.1%
- By 2040
- 44,914 · -7.4%
- By 2050
- 42,239 · -12.9%
- By 2075
- 35,071 · -27.7%
- By 2100
- 25,949 · -46.5%
Race, ethnicity, and origin ACS 2023
- Neighborhood character
- Predominantly White (80%)
- Race & ethnicity
- White 80% Two or more races 11% Native American 7% Hispanic / Latino 4%
- Common ancestry
- Lithuanian 6% Italian 3% Serbian 2%
- Foreign-born
- 1% · Canada
- Languages at home
- 98% English-only · Spanish 1%
Political lean MEDSL · Le Flore
- 2024 margin
- Solid R (+64.8) · D 17.0% · R 81.8% · Other 1.3%
- 2008→2024 swing
- -26.1pp toward R · 2008: -38.6pp · 2024: -64.8pp
- All cycles
- 2024: R+64.8 2020: R+63.4 2016: R+58.7 2012: R+41.1 2008: R+38.6
Not yet ingested
- Civics
- —
Market trends
- HPI YoY
- —
- Current HPI
- —
- Rent YoY
- —
- Metro
- —
- State GDP YoY
- ▲ 1.55%
- F500 in state
- 6
Industry mix (Fortune 500 HQ in OK)
| Industry | F500 HQs | Revenue |
|---|---|---|
| Energy | 3 | $48B |
|
||
Price history
+400.0% since first listed3 events — show timeline
- 2026-05-07 Listed $600,000 WRVBOR
- 2024-05-10 Sold (Public Records) $475,000 Public Records
- 2017-10-16 Sold (Public Records) $120,000 Public Records
Property tax history
+19.4%/yrLatest (2025): $3,897 · +275.4% YoY. Source: county tax records.
Cash-flow waterfall
monthlySold comps — $/sqft
last 12 mo · ≤1 miLoading sold comps…