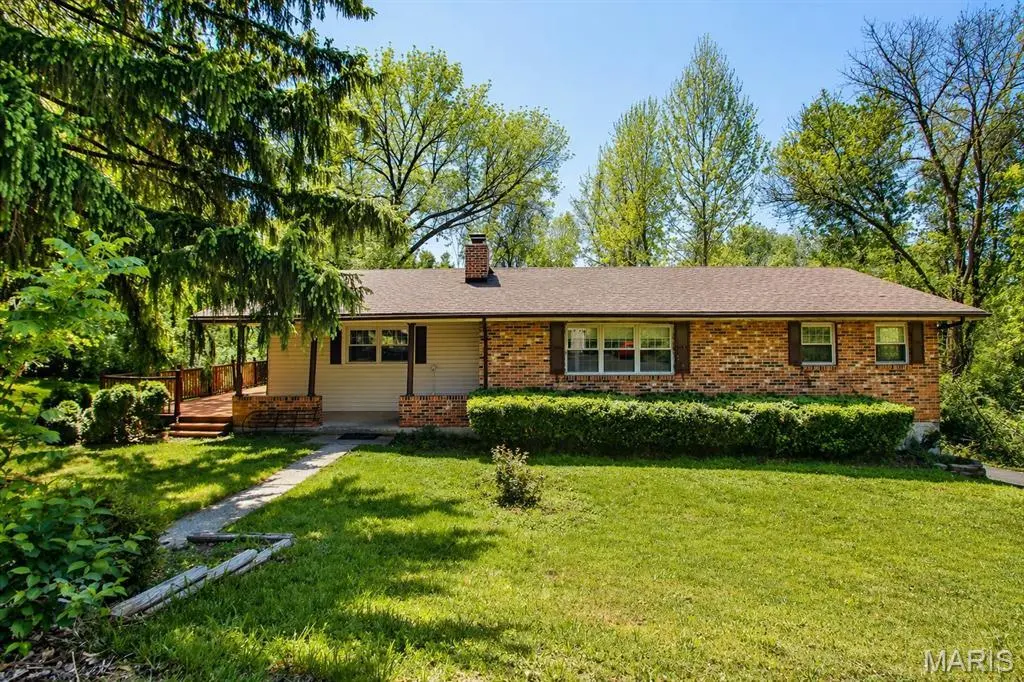
14125 Old Jamestown Rd · Black Jack, MO
Flood risk 1/10 · Minimal
- FEMA flood zone
- X (unshaded)
- Chance of flooding over 30 yrs
- 0.0%
- Est. flood insurance / yr
- $473 – $860
Fire risk 1/10 · Minimal
- Est. fire insurance / yr
- $1,054 – $1,958
Heat risk 4/10 · Minor
- Hot days now (above 106°F)
- 7 days/yr
- Hot days in 30 yrs
- 20 days/yr
Wind risk 2/10 · Minimal
- Chance of severe wind over 30 yrs
- 1.0%
Air-quality risk 3/10 · Minor
- Unhealthy air days now
- 3 days/yr
- Unhealthy air days in 30 yrs
- 5 days/yr
Risk factors via First Street. Map © Google.
Why this score? — see what drove the D- grade
The composite is a weighted blend of 9 inputs, each scored 0–100. Each bar is that input's sub-score; the figure is the points it added to the 100-point composite (weight × sub-score).
- Appreciation +10.0/10.0
- Cash flow +8.2/30.0
- ARV discount +4.4/15.0
- Rent growth +4.4/5.0
- Livability +3.5/5.0
- Condition / age +2.5/5.0
- 1% rule +2.3/10.0
- DSCR +2.2/10.0
- Schools +1.7/10.0
$293,000
🖨 Deal sheet (PDF) 📄 Offer letter ✓ Due diligence
Listing remarks MLS
This one checks all the boxes—comforts of the city with the privacy of nearly 1.5 acres! This private ranch home has been beautifully maintained which shows throughout. Step inside to a clean, updated main level with plenty of space! Two fireplaces add that extra cozy feel you’ll appreciate year-round. The partially finished walkout basement provides you even more room to spread out—perfect for entertaining, a rec area, with an additional living space that could be used for an office or guest room —with easy access to the garage. Major updates include new flooring, fresh paint, a newer roof and HVAC system (both approx. 4.5 years old), giving you added peace of mind. If you’ve been looking for space, updates, and a well-cared-for home in a convenient location—this is it —schedule your showing today.
Key facts
- 1.42 acre lot
- Garage
- Built 1975
Neighborhood map
What this means for you Summary
Snapshot
- This is a 3-bed/2.0-bath single-family listed at $293k.
Deal economics
- At list price, monthly cash flow is $-276 ($-3k/yr) — negative.
- To cash-flow at today's rent, offer at most $244k (16.6% below list).
- To meet the 1% rule (rent ≥ 1% of price), the offer needs to be $212k (27.5% below list).
- Recommended offer: $212k (27.5% below list) — sets the bar for 1% rule.
Location & tenants
- Location reads 70/100 on livability (#132 in MO) — a middle-class / working-renter tenant base. Strengths: cost of living A+, housing A+; Watch: health & safety C-, crime D+, amenities F.
- Hazelwood (suburban): math 11% / reading 26% proficiency, ranked #306 of 324 in MO (top 94%) — low school quality limits family demand, transient renter base, plan for 1-2y turnover.
- Zoned schools: Jamestown Elem. (math 2% / reading 37%, grade F, #935 of 1,115 statewide, top 84%, 333 students, 66% FRL); Central Middle (math 12% / reading 25%, grade F, #348 of 391 statewide, top 89%, 707 students, 68% FRL); Hazelwood Central High (math 12% / reading 33%, grade F, #455 of 521 statewide, top 88%, 1,628 students, 52% FRL).
- Market conditions: Rents rising fast (+7.5%/yr); 221 active listings in the ZIP; 7 comparable units currently listed for rent nearby; rentals at typical pace (median 23d on market — plan ~3-4 weeks tenant-placement turnaround); 43% of comp listings sitting > 30 days — soft ceiling on asking rent; 920 units permitted in St. Louis County in 2024 (250 in 5+ unit buildings).
- This rent runs 38% of the median local income ($67k/yr) — at the standard rent-burdened threshold; future hikes will face affordability resistance.
Forward outlook
- In year one you build about $31k of equity ($2k loan paydown + $29k appreciation (10.0% local appreciation)).
- By year 2, paydown + projected appreciation supports a ~$50k cash-out refi (75% LTV) — recoverable capital for the next deal without selling this one.
Negotiation context
- It's been on market 62 days — a 6% lower offer ($275k) is reasonable based on typical stale-listing flexibility.
- Current owner paid $125k; list at $293k implies a 134% gain — meaningful room to come down on a strong offer.
Questions for the listing agent
- What do current leases actually rent for vs. the listed asking? Can we see a recent rent roll and the last 12 months of T-12 income?
- It's been on market 62 days. Have you received any prior offers? Is the seller open to a 27% concession, seller financing, or rate buy-down credit?
- Built in 1975 — when were the roof, HVAC, electrical panel, plumbing, and water heater last replaced?
- Why hasn't it sold? Are there any deal-killer items the seller is aware of (foundation, flood, title, zoning, code violations)?
- Is there a deadline driving the sale (1031 exchange, divorce, estate, relocation)? That informs how much negotiation room exists.
- Crime grade is D in this area — have there been break-ins, vandalism, or insurance claims at this property in the last 3 years? What carrier currently insures it and at what premium?
- The area grade is low — what's the realistic commute time and amenity access for the typical tenant pool here? Any planned neighborhood developments (good or bad) we should know about?
- What's the average days-on-market for RENTAL listings here right now (not sales)? A rising rental-DOM trend means longer vacancies and softer asking-rent achievability than the comps imply.
- What's the recent tenant-quality profile in this submarket — average credit score on applications, eviction rate, late-payment / NSF rate, and stable-employment percentage? A property-management company in the area should have these aggregated.
- How much new for-sale + rental construction is in the pipeline within 1–3 miles? Heavy new supply typically softens prices + rents 12–24 months out; constrained supply supports both.
Investment metrics
- 1% rule
- 0.73% ✗
- Cap rate
- 5.16%
- Cash-on-cash
- -4.03%
- DSCR
- 0.82
- GRM
- 11.5
CMA / ARV
- ARV (median comp)
- $274,247
- List price
- $293,000
- Delta
- 6.84%
- Verdict
- FAIR
- Comps
- 20 within 1.0 mi
Show comp detail 12 sales within ~0.75 mi
| Address | Dist | Beds/Ba | Sqft | Sold | Price | $/sf | Match |
|---|---|---|---|---|---|---|---|
| 5647 Madlar Ln | 0.30mi | 3/2.0 | 1,482 (-2%) | 5mo | $190,000 | $128 | 78 |
| 13134 Brendan Wood Dr | 0.57mi | 3/2.0 | 1,616 (+6%) | 2mo | $259,900 | $161 | 61 |
| 4518 Behlmann Grove Pl | 0.62mi | 3/2.0 | 1,600 (+6%) | 10mo | $289,900 | $181 | 54 |
| 13360 Old Jamestown Rd | 0.67mi | 3/2.0 | 1,460 (-4%) | 14mo | $285,000 | $195 | 51 |
| 14434 Cape Charles Ct | 0.74mi | 2/2.5 (-1) | 1,533 (+1%) | 8mo | $245,000 | $160 | 50 |
| 5625 Delcastle Dr | 0.51mi | 3/3.0 | 1,694 (+12%) | 6mo | $235,000 | $139 | 48 |
| 156 Carytown Ln | 0.69mi | 2/2.0 (-1) | 1,572 (+4%) | 11mo | $249,900 | $159 | 47 |
| 6300 Silver Fox Dr | 0.75mi | 4/1.5 (+1) | 1,553 (+2%) | 10mo | $139,900 | $90 | 46 |
| 13300 Old Jamestown Rd | 0.72mi | 3/2.0 | 1,411 (-7%) | 12mo | $275,000 | $195 | 45 |
| 6 Glen Allen Ct | 0.60mi | 3/2.5 | 1,674 (+10%) | 10mo | $304,900 | $182 | 45 |
| 13011 Mystic Bend Ln | 0.75mi | 3/2.0 | 1,643 (+8%) | 10mo | $245,000 | $149 | 43 |
| 7 Country Lane Ct | 0.62mi | 4/3.0 (+1) | 1,724 (+14%) | 2mo | $310,000 | $180 | 38 |
Match score weights: distance 35% · size 25% · config 20% · recency 20%. Top-matched comps best support the ARV.
Projected returns pro-forma
10.0% appreciation · 7.51% rent growth · sell at horizon
- IRR
- 22.7%
- Equity multiple
- 2.85×
- Total profit
- $152,085
- Equity at exit
- $263,958
- IRR
- 21.4%
- Equity multiple
- 6.93×
- Total profit
- $486,151
- Equity at exit
- $569,235
Cash invested: $82,040 (down + closing). Projections, not guarantees.
Landlord ↔ Tenant lean methodology
- Overall (STATE)
- 81 Strongly Landlord-Friendly
- State Missouri
- 81 Strongly Landlord-Friendly · R+10
- County
- — inherits STATE
- City
- — inherits STATE
ZIP-level market 63033
- Home prices YoY
- 2.5%
- Rents YoY
- 7.5%
- Active inventory
- 221
- Price-to-rent
- 11.5×
Monthly cashflow live
- Estimated rent
- $2,125 high interval (Pro) →
- Mortgage (P&I)
- −$1,537
- Tax from tax record
- −$296 /mo · $3,548/yr
- Insurance
- −$122
- HOA
- −$0
- Vacancy / Maint / Mgmt
- −$446
- Net cashflow
- $-276
Break-even live
Sensitivity live
| Price | -10% $-110 | -5% $-193 | +0% $-276 | +5% $-359 | +10% $-442 |
|---|---|---|---|---|---|
| Rent | -10% $-444 | -5% $-360 | +0% $-276 | +5% $-192 | +10% $-108 |
| Rate | -1.0pp $-128 | -0.5pp $-201 | base $-276 | +0.5pp $-352 | +1.0pp $-429 |
UW: 25.0% down · 7.5% · 30yr · 1.5% tax · 5.0% vac · 8.0% maint · 8.0% mgmt
Financing live
Cash to close
- Down payment
- $73,250
- Closing costs
- $8,790
- Reserves months
- —
- Total cash needed
- —
Loan-product check · same deal, 3 products live
Conventional
25% down · 7.5% · 30yr
- Down + closing
- —
- Monthly P&I
- —
- Monthly cashflow
- —
- DSCR
- —
- Eligible?
- —
Personal DTI + credit; lowest rate.
DSCR
20% down · 8.5% · 30yr
- Down + closing
- —
- Monthly P&I
- —
- Monthly cashflow
- —
- DSCR
- —
- Eligible?
- —
No personal income docs; deal must DSCR.
Hard money
10% down · 12.0% · 12mo
- Down + closing
- —
- Monthly P&I
- —
- Monthly cashflow
- —
- DSCR
- —
- Eligible?
- —
Short-term bridge; refi at stabilization.
Rent comps 7 comps
| Address | Beds | Baths | Sqft | Rent | $/sqft | DOM | Units | Dist |
|---|---|---|---|---|---|---|---|---|
| 5454 Misty Crossing Ct Florissant, MO | 3.0 | 3.0 | 1518 | $2,196 | $1.45 | 9d | 1 | 0.47mi |
| 6431 Brown Fox Dr Florissant, MO | 3.0 | 2.0 | 1105 | $1,905 | $1.72 | 23d | 1 | 0.91mi |
| 5320 Springtrail Dr Black Jack, MO | 4.0 | 2.5 | 1712 | $2,390 | $1.40 | 23d | 1 | 1.11mi |
| 12810 Verwood Dr Florissant, MO | 3.0 | 2.0 | 1408 | $2,026 | $1.44 | 45d | 1 | 1.11mi |
| 5364 Trailview Dr Black Jack, MO | 4.0 | 3.0 | 1992 | $2,330 | $1.17 | 23d | 1 | 1.32mi |
| 12887 Fox Haven Dr Florissant, MO | 3.0 | 2.0 | 1135 | $1,750 | $1.54 | 45d | 1 | 1.41mi |
| 3930 Belcroft Dr Florissant, MO | 3.0 | 3.0 | 1408 | $1,935 | $1.37 | 45d | 1 | 1.49mi |
Listing history 22 events
-
2026-06-21days on market $293,000 Active 62 DOM
-
2026-06-18days on market $293,000 Active 59 DOM
-
2026-06-17days on market $293,000 Active 58 DOM
-
2026-06-16days on market $293,000 Active 57 DOM
-
2026-06-15days on market $293,000 Active 56 DOM
-
2026-06-13days on market $293,000 Active 54 DOM
-
2026-06-13days on market $293,000 Active 53 DOM
-
2026-06-09days on market $293,000 Active 50 DOM
-
2026-06-08days on market $293,000 Active 49 DOM
-
2026-06-07pricedays on market $293,000 Active 48 DOM
-
2026-06-05days on market $297,000 Active 45 DOM
-
2026-06-03days on market $297,000 Active 44 DOM
-
2026-06-02days on market $297,000 Active 43 DOM
-
2026-06-01days on market $297,000 Active 42 DOM
-
2026-05-31pricedays on market $297,000 Active 41 DOM
-
2026-05-09price $299,000 855-char remark
Show marketing remark (855 chars)
This one checks all the boxes—comforts of the city with the privacy of nearly 1.5 acres! This private ranch home has been beautifully maintained which shows throughout. Step inside to a clean, updated main level with plenty of space! Two fireplaces add that extra cozy feel you’ll appreciate year-round. The partially finished walkout basement provides you even more room to spread out—perfect for entertaining, a rec area, with an additional living space that could be used for an office or guest room —with easy access to the garage. Major updates include new flooring, fresh paint, a newer roof and HVAC system (both approx. 4.5 years old), giving you added peace of mind. If you’ve been looking for space, updates, and a well-cared-for home in a convenient location—this is it —schedule your showing today.
-
2026-04-30price $299,950 855-char remark
Show marketing remark (855 chars)
This one checks all the boxes—comforts of the city with the privacy of nearly 1.5 acres! This private ranch home has been beautifully maintained which shows throughout. Step inside to a clean, updated main level with plenty of space! Two fireplaces add that extra cozy feel you’ll appreciate year-round. The partially finished walkout basement provides you even more room to spread out—perfect for entertaining, a rec area, with an additional living space that could be used for an office or guest room —with easy access to the garage. Major updates include new flooring, fresh paint, a newer roof and HVAC system (both approx. 4.5 years old), giving you added peace of mind. If you’ve been looking for space, updates, and a well-cared-for home in a convenient location—this is it —schedule your showing today.
-
2026-04-24price $308,950 855-char remark
Show marketing remark (855 chars)
This one checks all the boxes—comforts of the city with the privacy of nearly 1.5 acres! This private ranch home has been beautifully maintained which shows throughout. Step inside to a clean, updated main level with plenty of space! Two fireplaces add that extra cozy feel you’ll appreciate year-round. The partially finished walkout basement provides you even more room to spread out—perfect for entertaining, a rec area, with an additional living space that could be used for an office or guest room —with easy access to the garage. Major updates include new flooring, fresh paint, a newer roof and HVAC system (both approx. 4.5 years old), giving you added peace of mind. If you’ve been looking for space, updates, and a well-cared-for home in a convenient location—this is it —schedule your showing today.
-
2026-04-21$309,000 Active 855-char remark
Show marketing remark (855 chars)
This one checks all the boxes—comforts of the city with the privacy of nearly 1.5 acres! This private ranch home has been beautifully maintained which shows throughout. Step inside to a clean, updated main level with plenty of space! Two fireplaces add that extra cozy feel you’ll appreciate year-round. The partially finished walkout basement provides you even more room to spread out—perfect for entertaining, a rec area, with an additional living space that could be used for an office or guest room —with easy access to the garage. Major updates include new flooring, fresh paint, a newer roof and HVAC system (both approx. 4.5 years old), giving you added peace of mind. If you’ve been looking for space, updates, and a well-cared-for home in a convenient location—this is it —schedule your showing today.
-
2026-04-03historical $309,000 855-char remark
Show marketing remark (855 chars)
This one checks all the boxes—comforts of the city with the privacy of nearly 1.5 acres! This private ranch home has been beautifully maintained which shows throughout. Step inside to a clean, updated main level with plenty of space! Two fireplaces add that extra cozy feel you’ll appreciate year-round. The partially finished walkout basement provides you even more room to spread out—perfect for entertaining, a rec area, with an additional living space that could be used for an office or guest room —with easy access to the garage. Major updates include new flooring, fresh paint, a newer roof and HVAC system (both approx. 4.5 years old), giving you added peace of mind. If you’ve been looking for space, updates, and a well-cared-for home in a convenient location—this is it —schedule your showing today.
-
2009-10-16soldstatus $125,000
-
1998-04-03soldstatus
ⓘ Source: listings_history table (triggers on properties + properties_extension) + one-shot
backfill from property_details.listing_events for pre-trigger history.
Tax reassessment forecast MO · Resets to sale price
- Current annual tax
- $3,548 · $296/mo
- Projected year-2 tax
- $3,548 · $296/mo
- Expected delta
- $0/yr ($0/mo · 0.0%)
ⓘ Screening estimate from a state-policy table — verify with the county assessor before closing.
Climate risk First Street
- Flood 1/10 Low FEMA zone X (unshaded) · 0% chance over 30 yrs
- Wildfire 1/10 Low
- Heat 4/10 Moderate 7 d/yr ≥106°F today · 20 d/yr by 30 yrs out
- Wind 2/10 Low 100% chance of damaging wind over 30 yrs
- Air quality 3/10 Moderate 3 unhealthy d/yr today · 5 by 30 yrs out
Nearby sold comps map
Loading sold comps map…
Walkable amenities ~0.75 mi
Loading nearby amenities…
Taxation est. · year 1
- Rental income
- $25,498
- − Mortgage interest
- −$16,413
- − Property taxes
- −$3,548
- − Insurance
- −$1,465
- − Repairs & maintenance
- −$2,040
- − Management
- −$2,040
- − Depreciation
- −$8,524
- Taxable loss
- −$8,531
- Est. tax savings @ 24.0%
- +$2,048
- After-tax cash flow
- $-1,261/yr
For passive investors: Depreciation is non-cash, so a rental often shows a tax loss while cash-flowing — sheltering income. Rental losses are passive: they offset passive income freely, and up to $25,000/yr can offset ordinary (W-2) income if you actively participate and your MAGI is under $100k (phasing out to $0 by $150k); unused losses carry forward. On sale, claimed depreciation is recaptured at up to 25%, and gains may owe capital-gains tax (a 1031 exchange can defer both). Figures are a year-1 estimate at your 24.0% rate — not tax advice; consult a CPA.
Schools (NCES district)
- District
- Hazelwood
- NCES district ID
- 2913830
- Math proficiency
- 11% ▼ -13.00%
- Reading proficiency
- 26% ▼ -6.00%
- Median HH income
- $51,621
- Composite
- 16.77/100
- National rank
- #9156
- State rank
- #306 of 324 in MO
Livability — Black Jack
- Score
- 70/100
- State rank
- #132
- US rank
- #7706
Category grades
Schools grade is shown separately in the Schools card above.
Census & demographics
- Census place
- Black Jack, MO
- County
- Saint Louis County · 888,823 people
- City population
- 69,104
- Metro
- St. Louis, MO-IL
- Population (ZIP)
- 43,056
- Household income
- $66,776
- Rent vs Own
- Severe rent burden
- 1429.0
Population outlook (St. Louis County) Hauer SSP2
- Today (2025)
- 1,025,227 people
- By 2030
- 1,028,023 · +0.3%
- By 2040
- 1,020,940 · -0.4%
- By 2050
- 1,007,280 · -1.8%
- By 2075
- 987,277 · -3.7%
- By 2100
- 921,984 · -10.1%
Race, ethnicity, and origin ACS 2023
- Neighborhood character
- Predominantly Black (71%)
- Race & ethnicity
- Black 71% White 23% Two or more races 4% Hispanic / Latino 1%
- Common ancestry
- Romanian 1% Lithuanian 1% Italian 1%
- Foreign-born
- 3% · Canada, Vietnam
- Languages at home
- 95% English-only · Spanish 1% French/Haitian/Cajun 1%
Political lean MEDSL · St. Louis
- 2024 margin
- Strong D (+23.4) · D 60.8% · R 37.4% · Other 1.7%
- 2008→2024 swing
- +3.5pp toward D · 2008: 19.9pp · 2024: 23.4pp
- All cycles
- 2024: D+23.4 2020: D+24.0 2016: D+16.2 2012: D+13.7 2008: D+19.9
Not yet ingested
- Civics
- —
Market trends
- HPI YoY
- ▲ 13.78%
- Current HPI
- 570.6
- Rent YoY
- ▲ 7.51%
- Metro
- St. Louis, MO-IL
- State GDP YoY
- ▲ 1.84%
- F500 in state
- 20
Industry mix (Fortune 500 HQ in MO)
| Industry | F500 HQs | Revenue |
|---|---|---|
| Healthcare | 1 | $163B |
|
||
| Insurance | 1 | $21B |
|
||
| Industrial Technology | 1 | $17B |
|
||
| Retail | 1 | $16B |
|
||
| Industrial Distribution | 1 | $10B |
|
||
| Utilities | 1 | $9B |
|
||
Price history
+139.2% since first listed7 events — show timeline
- 2026-05-09 Price Changed $299,000 MARIS as Distributed by MLS Grid
- 2026-04-30 Price Changed $299,950 MARIS as Distributed by MLS Grid
- 2026-04-24 Price Changed $308,950 MARIS as Distributed by MLS Grid
- 2026-04-21 Listed $309,000 MARIS as Distributed by MLS Grid
- 2026-04-03 Coming Soon $309,000 MARIS as Distributed by MLS Grid
- 2009-10-16 Sold (Public Records) $125,000 Public Records
- 1998-04-03 Sold (Public Records) — Public Records
Property tax history
+8.5%/yrLatest (2022): $3,548 · +4.6% YoY. Source: county tax records.
Cash-flow waterfall
monthlySold comps — $/sqft
last 12 mo · ≤1 miLoading sold comps…