107 N 42nd St · Louisville, KY
Flood risk 1/10 · Minimal
- FEMA flood zone
- X (shaded)
- Chance of flooding over 30 yrs
- 0.0%
- Est. flood insurance / yr
- $473 – $860
Fire risk 1/10 · Minimal
- Est. fire insurance / yr
- $839 – $1,559
Heat risk 5/10 · Moderate
- Hot days now (above 104°F)
- 7 days/yr
- Hot days in 30 yrs
- 20 days/yr
Wind risk 2/10 · Minimal
- Chance of severe wind over 30 yrs
- 1.0%
Air-quality risk 2/10 · Minimal
- Unhealthy air days now
- 1 days/yr
- Unhealthy air days in 30 yrs
- 2 days/yr
Risk factors via First Street. Map © Google.
Why this score? — see what drove the D+ grade
The composite is a weighted blend of 9 inputs, each scored 0–100. Each bar is that input's sub-score; the figure is the points it added to the 100-point composite (weight × sub-score).
- ARV discount +14.1/15.0
- Appreciation +10.0/10.0
- Cash flow +9.0/30.0
- Livability +3.2/5.0
- Rent growth +2.6/5.0
- DSCR +2.5/10.0
- Condition / age +2.5/5.0
- Schools +2.3/10.0
- 1% rule +1.5/10.0
$180,000
🖨 Deal sheet (PDF) 📄 Offer letter ✓ Due diligence
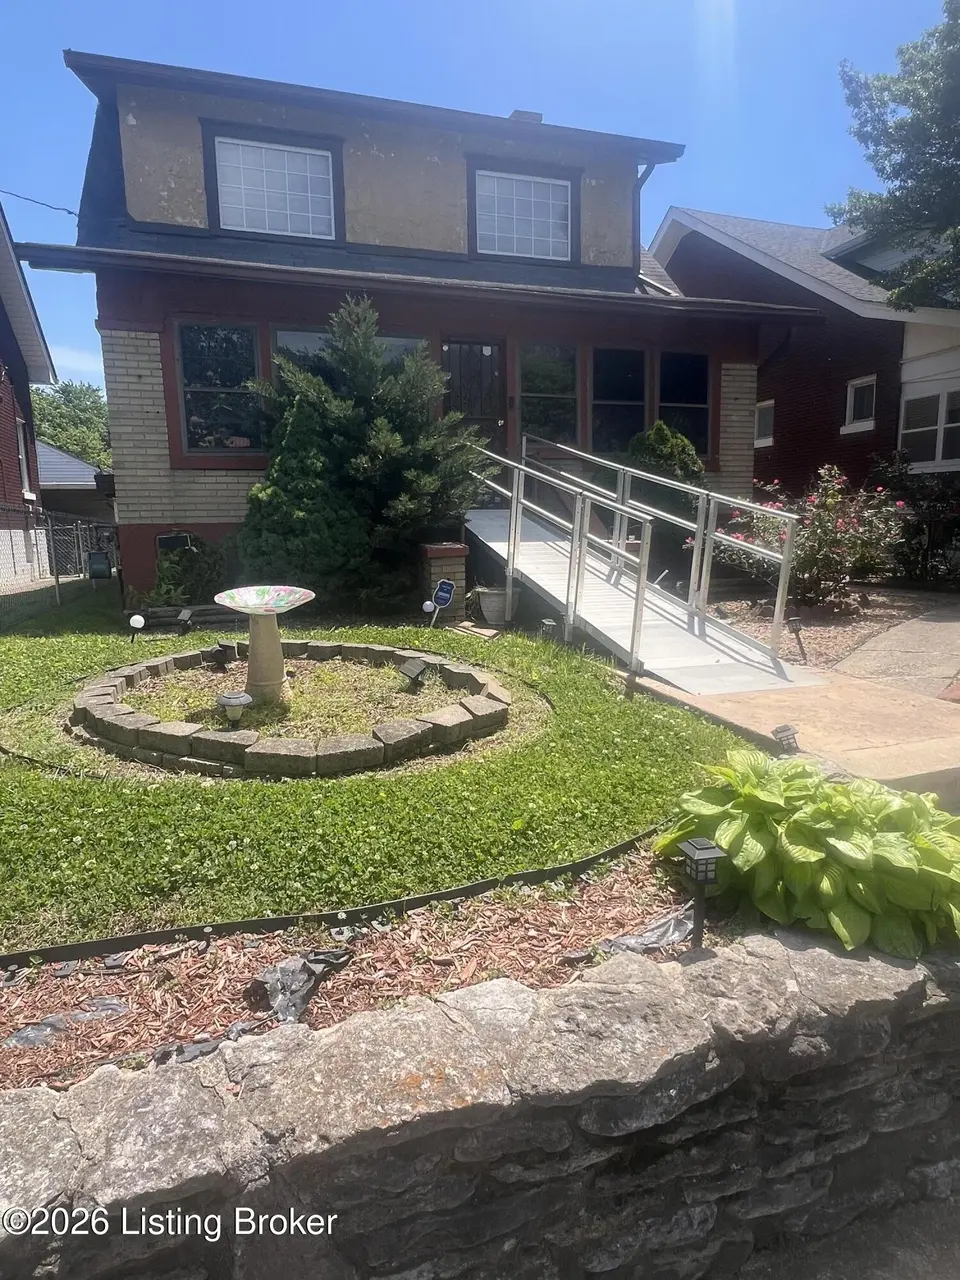
Listing remarks
This original 3 bedroom home was converted into a 2 bedroom with the primary suite on the second floor along with the primary bathroom. As you enter through the cozy closed in front porch you'll be lead into the large living room with the built-in fireplace that flows into a formal dining room area which connects to the eat in kitchen. The kitchen offers, stainless steel appliances, granted counters, newer cabinets this Kitchen was renovated less than two years ago following prior damage. The current owner inherited property and has made accessibility modifications. This property is still in the process of transferring from past owner to current owner. Seller is in the process of preparin
Key facts
- Built-in fireplace
- Formal dining room
- Eat in kitchen
Tags
Property features AI
Finance
- HOA & community: No association fee
Exterior
- Parking: Detached garage (1 car); Rear entry; Driveway parking
- Utilities: Electricity connected
- Home design: Single family residence; Traditional style; Two stories; Built in 1927
- Construction: Shingle roof; Above-grade finished area reported; Below-grade finished area reported
- Exterior features: Privacy fencing
Interior
- Kitchen: Kitchen on the first floor; First-floor dining area
- Bedrooms: Two bedrooms total; Primary bedroom located on the second floor; One first-floor bedroom
- Bathrooms: Two full bathrooms; Primary bathroom located on the second floor; Full bathroom on the first floor
- Heating & cooling: Natural gas heating; Central air conditioning
- Interior features: Partially finished basement; 5 total rooms; 7 total rooms (counting all finished spaces)
- Laundry & utility: First-floor laundry
Neighborhood map
What this means for you Summary
Snapshot
- This is a 2-bed/2.0-bath single-family listed at $180k.
Deal economics
- At list price, monthly cash flow is $-142 ($-2k/yr) — negative.
- To cash-flow at today's rent, offer at most $155k (13.9% below list).
- To meet the 1% rule (rent ≥ 1% of price), the offer needs to be $117k (34.9% below list).
- Recommended offer: $117k (34.9% below list) — sets the bar for 1% rule.
Location & tenants
- Location reads 63/100 on livability (#333 in KY) — a middle-class / working-renter tenant base. Strengths: cost of living A+, housing A+; Watch: employment C-, health & safety D+, crime F.
- Jefferson County (urban): math 19% / reading 35% proficiency, ranked #121 of 165 in KY (top 73%) — low school quality limits family demand, transient renter base, plan for 1-2y turnover.
- Zoned schools: Atkinson Academy (math 8% / reading 12%, grade F, #648 of 676 statewide, top 98%, 327 students, 88% FRL); Kammerer Middle (math 21% / reading 42%, grade F, #125 of 217 statewide, top 63%, 720 students, 52% FRL); Pleasure Ridge Park High (math 16% / reading 20%, grade F, #220 of 254 statewide, top 87%, 1,517 students, 63% FRL).
- Market conditions: Rents flat; 141 active listings in the ZIP; lower-income renter base — watch delinquency; 2,836 units permitted in Jefferson County in 2024 (1,558 in 5+ unit buildings).
- This rent runs 39% of the median local income ($36k/yr) — at the standard rent-burdened threshold; future hikes will face affordability resistance.
Forward outlook
- In year one you build about $19k of equity ($1k loan paydown + $18k appreciation (10.0% local appreciation)).
- Jefferson County population projected at +13% by 2050 — modest demand growth; plan on rents tracking national, not racing it.
- By year 2, paydown + projected appreciation supports a ~$31k cash-out refi (75% LTV) — recoverable capital for the next deal without selling this one.
Negotiation context
- It's been on market 45 days — a 3% lower offer ($175k) is reasonable based on typical stale-listing flexibility.
Risks & watch-outs
- Watch-outs: built in 1927 — expect roof / HVAC / electrical / plumbing capex.
- Climate carrying-cost: extreme-heat days projected 7→20/yr by 2055 (HVAC capex compounding) — expect insurance premiums to compound above CPI over the hold.
Questions for the listing agent
- What do current leases actually rent for vs. the listed asking? Can we see a recent rent roll and the last 12 months of T-12 income?
- It's been on market 45 days. Have you received any prior offers? Is the seller open to a 35% concession, seller financing, or rate buy-down credit?
- Built in 1927 — when were the roof, HVAC, electrical panel, plumbing, and water heater last replaced?
- Is there a deadline driving the sale (1031 exchange, divorce, estate, relocation)? That informs how much negotiation room exists.
- Schools are D-rated, which usually means shorter tenancies and higher turnover. Who's the typical renter profile here, and what's been the actual vacancy rate?
- Crime grade is F in this area — have there been break-ins, vandalism, or insurance claims at this property in the last 3 years? What carrier currently insures it and at what premium?
- The area grade is low — what's the realistic commute time and amenity access for the typical tenant pool here? Any planned neighborhood developments (good or bad) we should know about?
- What's the average days-on-market for RENTAL listings here right now (not sales)? A rising rental-DOM trend means longer vacancies and softer asking-rent achievability than the comps imply.
- What's the recent tenant-quality profile in this submarket — average credit score on applications, eviction rate, late-payment / NSF rate, and stable-employment percentage? A property-management company in the area should have these aggregated.
- How much new for-sale + rental construction is in the pipeline within 1–3 miles? Heavy new supply typically softens prices + rents 12–24 months out; constrained supply supports both.
Investment metrics
- 1% rule
- 0.65% ✗
- Cap rate
- 5.35%
- Cash-on-cash
- -3.37%
- DSCR
- 0.85
- GRM
- 12.8
CMA / ARV
- ARV (on-the-fly)
- $210,975
- Comps found
- 6
Show comp detail 6 sales within ~0.75 mi
| Address | Dist | Beds/Ba | Sqft | Sold | Price | $/sf | Match |
|---|---|---|---|---|---|---|---|
| 111 S 40th St | 0.20mi | 3/2.5 (+1) | 2,458 (-13%) | 8mo | $184,500 | $75 | 56 |
| 309 Southwestern Pkwy | 0.52mi | 3/2.0 (+1) | 3,062 (+9%) | 12mo | $219,000 | $72 | 46 |
| 318 Glendora Ave | 0.41mi | 3/3.0 (+1) | 2,536 (-10%) | 16mo | $220,000 | $87 | 42 |
| 4334 Vermont Ave | 0.67mi | 3/2.5 (+1) | 2,704 (-4%) | 18mo | $208,000 | $77 | 40 |
| 234 S 41st St | 0.28mi | 3/2.0 (+1) | 2,403 (-15%) | 23mo | $169,000 | $70 | 38 |
| 4307 River Park Dr | 0.69mi | 2/1.0 | 3,211 (+14%) | 4mo | $149,900 | $47 | 37 |
Match score weights: distance 35% · size 25% · config 20% · recency 20%. Top-matched comps best support the ARV.
Projected returns pro-forma
10.0% appreciation · 0.51% rent growth · sell at horizon
- IRR
- 21.2%
- Equity multiple
- 2.71×
- Total profit
- $86,064
- Equity at exit
- $162,158
- IRR
- 18.8%
- Equity multiple
- 6.06×
- Total profit
- $255,107
- Equity at exit
- $349,700
Cash invested: $50,400 (down + closing). Projections, not guarantees.
Landlord ↔ Tenant lean methodology
- Overall (STATE)
- 83 Strongly Landlord-Friendly
- State Kentucky
- 83 Strongly Landlord-Friendly · R+16
- County
- — inherits STATE
- City
- — inherits STATE
ZIP-level market 40212
- Home prices YoY
- 11.0%
- Rents YoY
- 0.5%
- Active inventory
- 141
- Price-to-rent
- 12.8×
Monthly cashflow live
- Estimated rent
- $1,172 medium interval (Pro) →
- Mortgage (P&I)
- −$944
- Tax from tax record
- −$49 /mo · $583/yr
- Insurance
- −$75
- HOA
- −$0
- Vacancy / Maint / Mgmt
- −$246
- Net cashflow
- $-142
Break-even live
Sensitivity live
| Price | -10% $-40 | -5% $-91 | +0% $-142 | +5% $-192 | +10% $-243 |
|---|---|---|---|---|---|
| Rent | -10% $-234 | -5% $-188 | +0% $-142 | +5% $-95 | +10% $-49 |
| Rate | -1.0pp $-51 | -0.5pp $-96 | base $-142 | +0.5pp $-188 | +1.0pp $-236 |
UW: 25.0% down · 7.5% · 30yr · 1.5% tax · 5.0% vac · 8.0% maint · 8.0% mgmt
Financing live
Cash to close
- Down payment
- $45,000
- Closing costs
- $5,400
- Reserves months
- —
- Total cash needed
- —
Loan-product check · same deal, 3 products live
Conventional
25% down · 7.5% · 30yr
- Down + closing
- —
- Monthly P&I
- —
- Monthly cashflow
- —
- DSCR
- —
- Eligible?
- —
Personal DTI + credit; lowest rate.
DSCR
20% down · 8.5% · 30yr
- Down + closing
- —
- Monthly P&I
- —
- Monthly cashflow
- —
- DSCR
- —
- Eligible?
- —
No personal income docs; deal must DSCR.
Hard money
10% down · 12.0% · 12mo
- Down + closing
- —
- Monthly P&I
- —
- Monthly cashflow
- —
- DSCR
- —
- Eligible?
- —
Short-term bridge; refi at stabilization.
Listing history 15 events
-
2026-06-21days on market $180,000 Active 45 DOM
-
2026-06-18days on market $180,000 Active 42 DOM
-
2026-06-17days on market $180,000 Active 41 DOM
-
2026-06-16days on market $180,000 Active 40 DOM
-
2026-06-15days on market $180,000 Active 39 DOM
-
2026-06-13days on market $180,000 Active 37 DOM
-
2026-06-10days on market $180,000 Active 34 DOM
-
2026-06-09days on market $180,000 Active 33 DOM
-
2026-06-08days on market $180,000 Active 32 DOM
-
2026-06-07days on market $180,000 Active 31 DOM
-
2026-06-03days on market $180,000 Active 27 DOM
-
2026-06-02days on market $180,000 Active 26 DOM
-
2026-06-01days on market $180,000 Active 25 DOM
-
2026-05-31days on market $180,000 Active 24 DOM
-
2026-05-08$180,000 Active
ⓘ Source: listings_history table (triggers on properties + properties_extension) + one-shot
backfill from property_details.listing_events for pre-trigger history.
Tax reassessment forecast KY · Resets to sale price
- Current annual tax
- $583 · $49/mo
- Projected year-2 tax
- $1,548 · $129/mo
- Expected delta
- +$965/yr (+$80/mo · 165.5%)
ⓘ Screening estimate from a state-policy table — verify with the county assessor before closing.
Climate risk First Street
- Flood 1/10 Low FEMA zone X (shaded) · 0% chance over 30 yrs
- Wildfire 1/10 Low
- Heat 5/10 Major 7 d/yr ≥104°F today · 20 d/yr by 30 yrs out
- Wind 2/10 Low 100% chance of damaging wind over 30 yrs
- Air quality 2/10 Low 1 unhealthy d/yr today · 2 by 30 yrs out
Nearby sold comps map
Loading sold comps map…
Walkable amenities ~0.75 mi
Loading nearby amenities…
Taxation est. · year 1
- Rental income
- $14,066
- − Mortgage interest
- −$10,083
- − Property taxes
- −$583
- − Insurance
- −$900
- − Repairs & maintenance
- −$1,125
- − Management
- −$1,125
- − Depreciation
- −$5,236
- Taxable loss
- −$4,987
- Est. tax savings @ 24.0%
- +$1,197
- After-tax cash flow
- $-501/yr
For passive investors: Depreciation is non-cash, so a rental often shows a tax loss while cash-flowing — sheltering income. Rental losses are passive: they offset passive income freely, and up to $25,000/yr can offset ordinary (W-2) income if you actively participate and your MAGI is under $100k (phasing out to $0 by $150k); unused losses carry forward. On sale, claimed depreciation is recaptured at up to 25%, and gains may owe capital-gains tax (a 1031 exchange can defer both). Figures are a year-1 estimate at your 24.0% rate — not tax advice; consult a CPA.
Schools (NCES district)
- District
- Jefferson County
- NCES district ID
- 2102990
- Math proficiency
- 19% ▼ -17.00%
- Reading proficiency
- 35% ▼ -11.00%
- Median HH income
- $47,885
- Composite
- 23.45/100
- National rank
- #7884
- State rank
- #121 of 165 in KY
Livability — Louisville
- Score
- 63/100
- State rank
- #333
- US rank
- #15887
Category grades
Schools grade is shown separately in the Schools card above.
Census & demographics
- Census place
- Louisville, KY
- County
- Jefferson County · 790,184 people
- City population
- 769,292
- Metro
- Louisville/Jefferson County, KY-IN
- Population (ZIP)
- 14,661
- Household income
- $35,753
- Rent vs Own
- Severe rent burden
- 1148.0
Population outlook (Jefferson County) Hauer SSP2
- Today (2025)
- 823,112 people
- By 2030
- 849,343 · +3.2%
- By 2040
- 895,696 · +8.8%
- By 2050
- 933,630 · +13.4%
- By 2075
- 1,028,262 · +24.9%
- By 2100
- 1,072,675 · +30.3%
Race, ethnicity, and origin ACS 2023
- Neighborhood character
- Majority Black (60%)
- Race & ethnicity
- Black 60% White 37% Two or more races 2% Hispanic / Latino 1%
- Common ancestry
- Slovak 1% Lithuanian 1% Iranian 1%
- Foreign-born
- 1% · Canada
- Languages at home
- 98% English-only · Spanish 1%
Political lean MEDSL · Jefferson
- 2024 margin
- D (+16.6) · D 57.4% · R 40.9% · Other 1.7%
- 2008→2024 swing
- +4.5pp toward D · 2008: 12.0pp · 2024: 16.6pp
- All cycles
- 2024: D+16.6 2020: D+20.1 2016: D+13.3 2012: D+11.1 2008: D+12.0
Not yet ingested
- Civics
- —
Market trends
- HPI YoY
- ▲ 29.02%
- Current HPI
- 293.2624
- Rent YoY
- ▲ 0.51%
- Metro
- Louisville/Jefferson County, KY-IN
- State GDP YoY
- ▲ 1.81%
- F500 in state
- 4
Industry mix (Fortune 500 HQ in KY)
| Industry | F500 HQs | Revenue |
|---|---|---|
| Healthcare | 1 | $118B |
|
||
| Food / Beverage | 1 | $7B |
|
||
Price history
1 event — show timeline
- 2026-05-08 Listed $180,000 Metro Search MLS
Property tax history
+4.4%/yrLatest (2025): $583 · -7.4% YoY. Source: county tax records.
Cash-flow waterfall
monthlySold comps — $/sqft
last 12 mo · ≤1 miLoading sold comps…