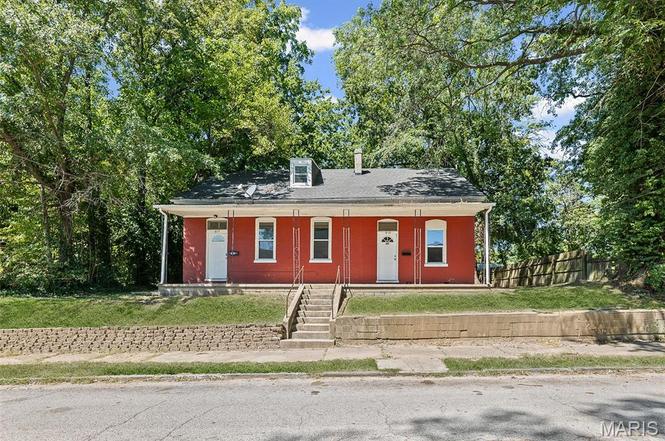
619 E Mckinley St · Belleville, IL
Flood risk 1/10 · Minimal
- FEMA flood zone
- X
- Chance of flooding over 30 yrs
- 0.0%
- Est. flood insurance / yr
- $507 – $1,088
Fire risk 1/10 · Minimal
- Est. fire insurance / yr
- $804 – $1,492
Heat risk 5/10 · Moderate
- Hot days now (above 107°F)
- 7 days/yr
- Hot days in 30 yrs
- 21 days/yr
Wind risk 2/10 · Minimal
- Chance of severe wind over 30 yrs
- 1.0%
Air-quality risk 4/10 · Minor
- Unhealthy air days now
- 3 days/yr
- Unhealthy air days in 30 yrs
- 6 days/yr
Risk factors via First Street. Map © Google.
Why this score? — see what drove the D grade
The composite is a weighted blend of 9 inputs, each scored 0–100. Each bar is that input's sub-score; the figure is the points it added to the 100-point composite (weight × sub-score).
- Cash flow +12.3/30.0
- ARV discount +9.5/15.0
- 1% rule +5.4/10.0
- Rent growth +5.0/5.0
- Livability +3.9/5.0
- DSCR +3.6/10.0
- Condition / age +2.5/5.0
- Schools +2.2/10.0
- Appreciation +0.0/10.0
$129,900
🖨 Deal sheet 📄 Offer letter ✓ Due diligence
Listing remarks MLS
Investors take note! Two story duplex with renters that are current and on time. Nothing to do here but collect the rent. Roof is about 5 years old, New windows, New gutters, New flooring, HVAC units around 8 years old. Large eat in Kitchen with refrigerator and range/oven. Full bath, and bedrooms. For those just getting into investments or those that are looking to increase their portfolio this is definitely one you need to consider. Since both units are occuplied we require a minimum of 24 hours notice to show.
Key facts
- 8,712 sq ft lot
- Built 1900
- Listed 234 days
Neighborhood map
What this means for you Summary
Snapshot
- This is a ?-bed/4.0-bath single-family listed at $130k.
Deal economics
- At list price, monthly cash flow is $-24 ($-290/yr) — negative.
- To cash-flow at today's rent, offer at most $126k (3.3% below list).
- Meets the 1% rule at list price ($1k rent vs $130k).
- Recommended offer: $114k (12.0% below list) — sets the bar for market timing.
Location & tenants
- Location reads 78/100 on livability (#142 in IL, #2,604 nationally) — a middle-class / working-renter tenant base. Strengths: commute A+, cost of living A+, housing A+; Watch: crime F, amenities D-.
- Belleville Twp Hsd 201 (suburban): math 21% / reading 28% proficiency, ranked #308 of 620 in IL (top 50%) — low school quality limits family demand, transient renter base, plan for 1-2y turnover.
- Zoned schools: Belleville High School-West (math 19% / reading 26%, grade F, #317 of 693 statewide, top 46%, 2,234 students, 0% FRL).
- Market conditions: Rents rising fast (+14.5%/yr); 148 active listings in the ZIP; 8 comparable units currently listed for rent nearby; rentals leasing fast (median 12d on market — plan ~1-2 weeks tenant-placement turnaround); 783 units permitted in St. Clair County in 2024 (378 in 5+ unit buildings).
Forward outlook
- Local home prices are declining (-3.0%/yr); year-one equity from $898 of loan paydown is wiped out by about $4k of value loss. Plan a longer hold.
- St. Clair County population projected at -23% by 2050 — secular population decline; favor cash flow + early exit over multi-decade hold.
Negotiation context
- It's been on market 234 days — a 12% lower offer ($114k) is reasonable based on typical stale-listing flexibility.
- 4 sale attempts since 4y ago; this cycle's ask has dropped $50k (28%) from the opening price — seller is motivated, your offer sets the floor, not the list.
- Current owner paid $69k; list at $130k implies a 88% gain — meaningful room to come down on a strong offer.
Risks & watch-outs
- Watch-outs: property tax is 3.3% of price; built in 1900 — expect roof / HVAC / electrical / plumbing capex.
- Climate carrying-cost: extreme-heat days projected 7→21/yr by 2055 (HVAC capex compounding) — expect insurance premiums to compound above CPI over the hold.
Questions for the listing agent
- What do current leases actually rent for vs. the listed asking? Can we see a recent rent roll and the last 12 months of T-12 income?
- It's been on market 234 days. Have you received any prior offers? Is the seller open to a 12% concession, seller financing, or rate buy-down credit?
- Built in 1900 — when were the roof, HVAC, electrical panel, plumbing, and water heater last replaced?
- Property tax is high relative to price — has the assessment been appealed recently, and will the sale trigger a re-assessment?
- Why hasn't it sold? Are there any deal-killer items the seller is aware of (foundation, flood, title, zoning, code violations)?
- Is there a deadline driving the sale (1031 exchange, divorce, estate, relocation)? That informs how much negotiation room exists.
- Crime grade is F in this area — have there been break-ins, vandalism, or insurance claims at this property in the last 3 years? What carrier currently insures it and at what premium?
- The area grade is low — what's the realistic commute time and amenity access for the typical tenant pool here? Any planned neighborhood developments (good or bad) we should know about?
- What's the average days-on-market for RENTAL listings here right now (not sales)? A rising rental-DOM trend means longer vacancies and softer asking-rent achievability than the comps imply.
- What's the recent tenant-quality profile in this submarket — average credit score on applications, eviction rate, late-payment / NSF rate, and stable-employment percentage? A property-management company in the area should have these aggregated.
- How much new for-sale + rental construction is in the pipeline within 1–3 miles? Heavy new supply typically softens prices + rents 12–24 months out; constrained supply supports both.
Investment metrics
- 1% rule
- 1.04% ✓
- Cap rate
- 6.07%
- Cash-on-cash
- -0.80%
- DSCR
- 0.96
- GRM
- 8.0
CMA / ARV
- ARV (on-the-fly)
- $136,080
- Comps found
- 12
Show comp detail 12 sales within ~0.75 mi
| Address | Dist | Beds/Ba | Sqft | Sold | Price | $/sf | Match |
|---|---|---|---|---|---|---|---|
| 608 E Adams St | 0.06mi | 3/1.0 | 1,380 (+10%) | 1mo | $139,000 | $101 | 68 |
| 614 S Church St | 0.23mi | 2/2.0 | 1,383 (+10%) | 2mo | $150,000 | $108 | 63 |
| 733 S Belt E | 0.19mi | 2/1.0 | 1,157 (-8%) | 10mo | $159,900 | $138 | 57 |
| 704 Wabash Ave | 0.52mi | 3/2.0 | 1,196 (-5%) | 4mo | $125,000 | $105 | 56 |
| 430 S Douglas Ave | 0.60mi | 2/1.0 | 1,294 (+3%) | 0mo | $152,000 | $117 | 55 |
| 413 Park Ave | 0.27mi | 3/2.0 | 1,401 (+11%) | 11mo | $94,500 | $67 | 52 |
| 310 S Church St | 0.32mi | 4/2.0 | 1,426 (+13%) | 5mo | $129,000 | $90 | 51 |
| 18 Scarlet Dr | 0.58mi | 4/1.0 | 1,232 (-2%) | 11mo | $155,000 | $126 | 48 |
| 224 N Jackson St | 0.71mi | 2/1.0 | 1,236 (-2%) | 7mo | $150,000 | $121 | 46 |
| 1212 Mascoutah Ave | 0.62mi | 2/2.0 | 1,409 (+12%) | 0mo | $195,000 | $138 | 43 |
| 224 Brackett St | 0.46mi | 2/1.0 | 1,387 (+10%) | 9mo | $60,000 | $43 | 42 |
| 18 N Missouri Ave | 0.73mi | 3/1.0 | 1,184 (-6%) | 10mo | $45,000 | $38 | 36 |
Match score weights: distance 35% · size 25% · config 20% · recency 20%. Top-matched comps best support the ARV.
Projected returns pro-forma
-3.0% appreciation · 8.0% rent growth · sell at horizon
- IRR
- -11.0%
- Equity multiple
- 0.58×
- Total profit
- $-15,328
- Equity at exit
- $19,369
- IRR
- 5.2%
- Equity multiple
- 1.49×
- Total profit
- $17,653
- Equity at exit
- $11,231
Cash invested: $36,372 (down + closing). Projections, not guarantees.
Landlord ↔ Tenant lean methodology
- Overall (STATE)
- 43 Moderately Tenant-Leaning
- State Illinois
- 43 Moderately Tenant-Leaning · D+7
- County
- — inherits STATE
- City
- — inherits STATE
ZIP-level market 62220
- Home prices YoY
- -26.4%
- Rents YoY
- 14.5%
- Active inventory
- 148
- Price-to-rent
- 8.0×
Monthly cashflow live
- Estimated rent
- $1,348 high interval (Pro) →
- Mortgage (P&I)
- −$681
- Tax from tax record
- −$354 /mo · $4,246/yr
- Insurance
- −$54
- HOA
- −$0
- Vacancy / Maint / Mgmt
- −$283
- Net cashflow
- $-24
Break-even live
UW: 25.0% down · 7.5% · 30yr · 1.5% tax · 5.0% vac · 8.0% maint · 8.0% mgmt
Financing live
Cash to close
- Down payment
- $32,475
- Closing costs
- $3,897
- Reserves months
- —
- Total cash needed
- —
Loan-product check · same deal, 3 products live
Conventional
25% down · 7.5% · 30yr
- Down + closing
- —
- Monthly P&I
- —
- Monthly cashflow
- —
- DSCR
- —
- Eligible?
- —
Personal DTI + credit; lowest rate.
DSCR
20% down · 8.5% · 30yr
- Down + closing
- —
- Monthly P&I
- —
- Monthly cashflow
- —
- DSCR
- —
- Eligible?
- —
No personal income docs; deal must DSCR.
Hard money
10% down · 12.0% · 12mo
- Down + closing
- —
- Monthly P&I
- —
- Monthly cashflow
- —
- DSCR
- —
- Eligible?
- —
Short-term bridge; refi at stabilization.
Rent comps 8 comps
| Address | Beds | Baths | Sqft | Rent | $/sqft | DOM | Units | Dist |
|---|---|---|---|---|---|---|---|---|
| 618 W Monroe St Belleville, IL | 3.0 | 1.0 | 1500 | $1,050 | $0.70 | 23d | 1 | 1.02mi |
| 537 Vicksburg Dr Unit h Belleville, IL | 2.0 | 1.0 | 950 | $1,190 | $1.25 | 16d | 1 | 1.19mi |
| 1107 Bristow St Belleville, IL | 3.0 | 1.0 | 1238 | $1,500 | $1.21 | 12d | 1 | 1.27mi |
| 1953 Richmond Springs Ln Belleville, IL | 3.0 | 3.0 | 1480 | $2,500 | $1.69 | 1d | 1 | 1.28mi |
| 310 N 10th St Belleville, IL | 2.0 | 1.0 | 1270 | $1,300 | $1.02 | 2d | 1 | 1.32mi |
| 1009 Belle Valley Dr Belleville, IL | 2.0 | 1.5 | 990 | $1,100 | $1.11 | 1d | 1 | 1.36mi |
| 109 S 13th St Belleville, IL | 3.0 | 1.5 | 1800 | $1,325 | $0.74 | 17d | 1 | 1.43mi |
| 2056 Huntmaster Dr Belleville, IL | 2.0 | 2.0 | 1200 | $1,525 | $1.27 | 1d | 1 | 1.47mi |
Listing history 28 events
-
2026-06-18days on market $129,900 Active 234 DOM
-
2026-06-17days on market $129,900 Active 233 DOM
-
2026-06-16days on market $129,900 Active 232 DOM
-
2026-06-15days on market $129,900 Active 231 DOM
-
2026-06-13days on market $129,900 Active 229 DOM
-
2026-06-09days on market $129,900 Active 225 DOM
-
2026-06-08days on market $129,900 Active 224 DOM
-
2026-06-07days on market $129,900 Active 223 DOM
-
2026-06-03days on market $129,900 Active 219 DOM
-
2026-06-02days on market $129,900 Active 218 DOM
-
2026-06-01days on market $129,900 Active 217 DOM
-
2026-05-31days on market $129,900 Active 216 DOM
-
2026-04-17status Pending
-
2026-04-02status Active
-
2026-04-02price $129,900
-
2026-03-24status Pending
-
2026-01-06price $149,900
-
2025-11-07price $159,900
-
2025-11-05status Active
-
2025-10-24status Pending
-
2025-09-26price $169,900
-
2025-08-28$179,900 Active
-
2022-11-10status Pending 521-char remark
Show marketing remark (521 chars)
Investors take note! Two story duplex with renters that are current and on time. Nothing to do here but collect the rent. Roof is about 5 years old, New windows, New gutters, New flooring, HVAC units around 8 years old. Large eat in Kitchen with refrigerator and range/oven. Full bath, and bedrooms. For those just getting into investments or those that are looking to increase their portfolio this is definitely one you need to consider. Since both units are occuplied we require a minimum of 24 hours notice to show.
-
2022-11-10soldstatus Closed 521-char remark
Show marketing remark (521 chars)
Investors take note! Two story duplex with renters that are current and on time. Nothing to do here but collect the rent. Roof is about 5 years old, New windows, New gutters, New flooring, HVAC units around 8 years old. Large eat in Kitchen with refrigerator and range/oven. Full bath, and bedrooms. For those just getting into investments or those that are looking to increase their portfolio this is definitely one you need to consider. Since both units are occuplied we require a minimum of 24 hours notice to show.
-
2022-09-25historical Active Under Contract 521-char remark
Show marketing remark (521 chars)
Investors take note! Two story duplex with renters that are current and on time. Nothing to do here but collect the rent. Roof is about 5 years old, New windows, New gutters, New flooring, HVAC units around 8 years old. Large eat in Kitchen with refrigerator and range/oven. Full bath, and bedrooms. For those just getting into investments or those that are looking to increase their portfolio this is definitely one you need to consider. Since both units are occuplied we require a minimum of 24 hours notice to show.
-
2022-09-22$159,000 Active 521-char remark
Show marketing remark (521 chars)
Investors take note! Two story duplex with renters that are current and on time. Nothing to do here but collect the rent. Roof is about 5 years old, New windows, New gutters, New flooring, HVAC units around 8 years old. Large eat in Kitchen with refrigerator and range/oven. Full bath, and bedrooms. For those just getting into investments or those that are looking to increase their portfolio this is definitely one you need to consider. Since both units are occuplied we require a minimum of 24 hours notice to show.
-
2007-12-03soldstatus $69,000
-
2005-06-23soldstatus $59,500
ⓘ Source: listings_history table (triggers on properties + properties_extension) + one-shot
backfill from property_details.listing_events for pre-trigger history.
Tax reassessment forecast IL · Partial reset (capped growth)
- Current annual tax
- $4,246 · $354/mo
- Projected year-2 tax
- $4,246 · $354/mo
- Expected delta
- $0/yr ($0/mo · 0.0%)
ⓘ Screening estimate from a state-policy table — verify with the county assessor before closing.
Climate risk First Street
- Flood 1/10 Low FEMA zone X · 0% chance over 30 yrs
- Wildfire 1/10 Low
- Heat 5/10 Major 7 d/yr ≥107°F today · 21 d/yr by 30 yrs out
- Wind 2/10 Low 100% chance of damaging wind over 30 yrs
- Air quality 4/10 Moderate 3 unhealthy d/yr today · 6 by 30 yrs out
Nearby sold comps map
Loading sold comps map…
Walkable amenities ~0.75 mi
Loading nearby amenities…
Taxation est. · year 1
- Rental income
- $16,176
- − Mortgage interest
- −$7,276
- − Property taxes
- −$4,246
- − Insurance
- −$650
- − Repairs & maintenance
- −$1,294
- − Management
- −$1,294
- − Depreciation
- −$3,779
- Taxable loss
- −$2,362
- Est. tax savings @ 24.0%
- +$567
- After-tax cash flow
- $277/yr
For passive investors: Depreciation is non-cash, so a rental often shows a tax loss while cash-flowing — sheltering income. Rental losses are passive: they offset passive income freely, and up to $25,000/yr can offset ordinary (W-2) income if you actively participate and your MAGI is under $100k (phasing out to $0 by $150k); unused losses carry forward. On sale, claimed depreciation is recaptured at up to 25%, and gains may owe capital-gains tax (a 1031 exchange can defer both). Figures are a year-1 estimate at your 24.0% rate — not tax advice; consult a CPA.
Schools (NCES district)
- District
- Belleville Twp Hsd 201
- NCES district ID
- 1705640
- Math proficiency
- 21% ▼ -8.00%
- Reading proficiency
- 28% ▼ -3.00%
- Median HH income
- $58,064
- Composite
- 22.39/100
- National rank
- #8115
- State rank
- #308 of 620 in IL
Livability — Belleville
- Score
- 78/100
- State rank
- #142
- US rank
- #2604
Category grades
Schools grade is shown separately in the Schools card above.
Census & demographics
- Census place
- Belleville, IL
- County
- Saint Clair County · 169,691 people
- City population
- 47,407
- Metro
- St. Louis, MO-IL
- Population (ZIP)
- 19,152
- Household income
- $65,952
- Rent vs Own
- Severe rent burden
- 923.0
Population outlook (St. Clair County) Hauer SSP2
- Today (2025)
- 250,366 people
- By 2030
- 240,511 · -3.9%
- By 2040
- 217,391 · -13.2%
- By 2050
- 192,699 · -23.0%
- By 2075
- 140,637 · -43.8%
- By 2100
- 100,499 · -59.9%
Race, ethnicity, and origin ACS 2023
- Neighborhood character
- Predominantly White (67%)
- Race & ethnicity
- White 67% Black 22% Two or more races 6% Hispanic / Latino 3% Asian 1%
- Common ancestry
- Lithuanian 2% Slovak 2% Romanian 2%
- Foreign-born
- 4% · Canada
- Languages at home
- 95% English-only · Arabic 2% Spanish 1% Other Indo-European 1%
Political lean MEDSL · St. Clair
- 2024 margin
- Lean D (+7.9) · D 53.0% · R 45.1% · Other 1.8%
- 2008→2024 swing
- -14.6pp toward R · 2008: 22.4pp · 2024: 7.9pp
- All cycles
- 2024: D+7.9 2020: D+8.7 2016: D+5.6 2012: D+14.5 2008: D+22.4
Not yet ingested
- Civics
- —
Market trends
- HPI YoY
- ▼ -52.27%
- Current HPI
- 145.9237
- Rent YoY
- ▲ 14.47%
- Metro
- St. Louis, MO-IL
- State GDP YoY
- ▲ 1.59%
- F500 in state
- 60
Industry mix (Fortune 500 HQ in IL)
| Industry | F500 HQs | Revenue |
|---|---|---|
| Insurance | 4 | $201B |
|
||
| Consumer Goods | 4 | $87B |
|
||
| Industrial Machinery | 3 | $64B |
|
||
| Healthcare | 2 | $55B |
|
||
| Retail / Pharmacy | 1 | $148B |
|
||
| Agriculture / Food | 1 | $86B |
|
||
Price history
+118.3% since first listed16 events — show timeline
- 2026-04-17 Pending — MARIS as Distributed by MLS Grid
- 2026-04-02 Relisted — MARIS as Distributed by MLS Grid
- 2026-04-02 Price Changed $129,900 MARIS as Distributed by MLS Grid
- 2026-03-24 Pending — MARIS as Distributed by MLS Grid
- 2026-01-06 Price Changed $149,900 MARIS as Distributed by MLS Grid
- 2025-11-07 Price Changed $159,900 MARIS as Distributed by MLS Grid
- 2025-11-05 Relisted — MARIS as Distributed by MLS Grid
- 2025-10-24 Pending — MARIS as Distributed by MLS Grid
- 2025-09-26 Price Changed $169,900 MARIS as Distributed by MLS Grid
- 2025-08-28 Listed $179,900 MARIS as Distributed by MLS Grid
- 2022-11-10 Pending — MARIS as Distributed by MLS Grid
- 2022-11-10 Sold (MLS) — MARIS as Distributed by MLS Grid
- 2022-09-25 Contingent — MARIS as Distributed by MLS Grid
- 2022-09-22 Listed $159,000 MARIS as Distributed by MLS Grid
- 2007-12-03 Sold (Public Records) $69,000 Public Records
- 2005-06-23 Sold (Public Records) $59,500 Public Records
Property tax history
+4.4%/yrLatest (2024): $4,246 · +0.6% YoY. Source: county tax records.
Cash-flow waterfall
monthlySold comps — $/sqft
last 12 mo · ≤1 miLoading sold comps…