 🏗️ New Construction
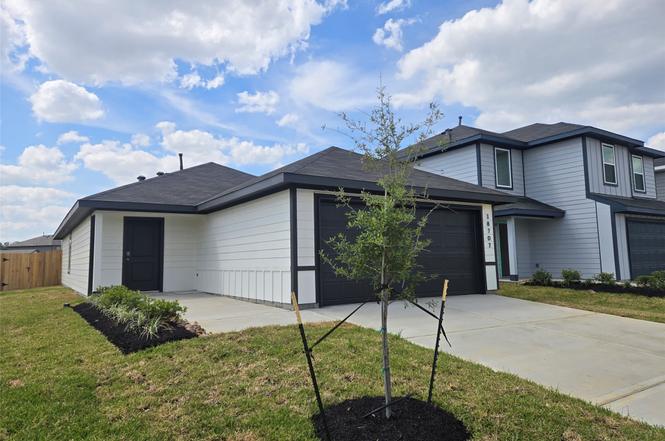
18707 Sunset Horizon Dr · Todd Mission, TX
Flood risk No data
- FEMA flood zone
- —
- Chance of flooding over 30 yrs
- —
- Est. flood insurance / yr
- —
Fire risk No data
- Est. fire insurance / yr
- —
Heat risk No data
- Hot days now (above threshold)
- —
- Hot days in 30 yrs
- —
Wind risk No data
- Chance of severe wind over 30 yrs
- —
Air-quality risk No data
- Unhealthy air days now
- —
- Unhealthy air days in 30 yrs
- —
Risk factors via First Street. Map © Google.
Why this score? — see what drove the D- grade
The composite is a weighted blend of 9 inputs, each scored 0–100. Each bar is that input's sub-score; the figure is the points it added to the 100-point composite (weight × sub-score).
- Cash flow +11.9/30.0
- ARV discount +7.5/15.0
- Condition / age +5.0/5.0
- 1% rule +3.6/10.0
- DSCR +3.5/10.0
- Livability +3.4/5.0
- Schools +2.9/10.0
- Rent growth +2.1/5.0
- Appreciation +0.0/10.0
$233,990
🖨 Deal sheet 📄 Offer letter ✓ Due diligence
Listing remarks
LOVELY BRAND NEW 3 BEDROOM ONE STORY D. R. HORTON BUILT HOME IN SUNSET VALLEY! CORNER HOMESITE! AMAZING COMMUNITY IN EXCELLENT LOCATION! Welcoming one story with gourmet kitchen! Includes quartz counter tops, quality cabinets, stainless steel appliances and an open concept floorplan with the kitchen flowing seamlessly into the dining room and living room! The main bedroom has an attractive ensuite bathroom that features a quartz vanity countertop! Enjoy additional storage with a spacious walk-in closet located off of the primary bathroom. Spacious secondary bedrooms! Features HOME IS CONNECTED program! Using one central hub that talks to all the devices in your home, you can control the l
Key facts
- Gourmet kitchen
- Quality cabinets
- Quartz counter tops
Tags
Property features AI
Other
- Other: Builder-provided energy-efficient features including radiant attic barrier, efficient appliances, HVAC, insulation, lighting, thermostat, water heater, and windows; Ventilation included for improved indoor air quality; Total living area approximately 1,280; Total rooms: 5; Family room on the first floor (approximately 15x15); Breakfast nook on the first floor (approximately 15x10)
Finance
- HOA & community: Community managed by Inframark; Annual association fee
Exterior
- Parking: Attached garage; 2 garage spaces; Driveway parking
- Security: Prewired for security; Smoke detectors
- Utilities: Public water; Public sewer
- Home design: Residential property; New construction (under construction); East-facing
- Construction: Built by D.R. Horton (2026); Cement siding; Composition roof; Slab foundation
- Exterior features: Fenced private backyard; Porch; Private yard; Corner lot in a subdivision with side yard
Interior
- Kitchen: Dishwasher; Disposal; Gas oven; Gas range; Microwave; ENERGY STAR qualified appliances; Instant hot water; Tankless water heater
- Bedrooms: Primary bedroom on the first floor (approximately 14x12); Two additional first-floor bedrooms (each approximately 10x10); Total of 3 bedrooms on the first floor
- Flooring: Carpet; Plank flooring; Vinyl
- Bathrooms: 2 full bathrooms
- Heating & cooling: Central heating (gas); Central air conditioning (electric)
- Interior features: Open kitchen/family room layout; Pantry; Quartz countertops; Tub/shower; Combined kitchen and dining area; Combined living and dining area; Programmable thermostat; Low-emissivity windows
- Laundry & utility: Electric dryer hookup
Neighborhood map
What this means for you Summary
Snapshot
- This is a 3-bed/2.0-bath single-family listed at $234k. Condition is rated excellent.
Deal economics
- At list price, monthly cash flow is $-62 ($-740/yr) — negative.
- To cash-flow at today's rent, offer at most $228k (2.6% below list).
- To meet the 1% rule (rent ≥ 1% of price), the offer needs to be $204k (13.0% below list).
- Recommended offer: $204k (13.0% below list) — sets the bar for 1% rule.
- Cap rate 6.0% vs local median 2.9% in Todd Mission — top-decile yield for the area; either an underpriced asset or a hidden risk that comps aren't pricing in. Stress-test before assuming the spread holds.
Location & tenants
- Location reads 67/100 on livability (#549 in TX) — a middle-class / working-renter tenant base. Strengths: employment A+, cost of living A+, housing A+; Watch: amenities F, commute F, health & safety F.
- Waller ISD (rural): math 30% / reading 35% proficiency, ranked #532 of 826 in TX (top 64%) — families likely to look elsewhere, expect single-tenant / working-renter base with shorter leases.
- Zoned schools: Waller H S (math 25% / reading 40%, grade F, #1,029 of 1,632 statewide, top 64%, 2,639 students, 62% FRL) — zoned schools at 62% FRL track the district average.
- Market conditions: Rents soft (-1.6%/yr); 1782 active listings in the ZIP; high-income renter base; 483 units permitted in Waller County in 2024 (89 in 5+ unit buildings).
Forward outlook
- Local home prices are declining (-3.0%/yr); year-one equity from $2k of loan paydown is wiped out by about $7k of value loss. Plan a longer hold.
- Waller County population projected at +62% by 2050 — long-run rental-demand tailwind backs the buy-and-hold thesis.
Negotiation context
- It's been on market 76 days — a 6% lower offer ($220k) is reasonable based on typical stale-listing flexibility.
Questions for the listing agent
- What do current leases actually rent for vs. the listed asking? Can we see a recent rent roll and the last 12 months of T-12 income?
- It's been on market 76 days. Have you received any prior offers? Is the seller open to a 13% concession, seller financing, or rate buy-down credit?
- What does the HOA fee cover, when was the last increase, and are there any pending special assessments or reserve-fund shortfalls?
- Why hasn't it sold? Are there any deal-killer items the seller is aware of (foundation, flood, title, zoning, code violations)?
- Is there a deadline driving the sale (1031 exchange, divorce, estate, relocation)? That informs how much negotiation room exists.
- Schools are F-rated, which usually means shorter tenancies and higher turnover. Who's the typical renter profile here, and what's been the actual vacancy rate?
- The area grade is low — what's the realistic commute time and amenity access for the typical tenant pool here? Any planned neighborhood developments (good or bad) we should know about?
- What's the average days-on-market for RENTAL listings here right now (not sales)? A rising rental-DOM trend means longer vacancies and softer asking-rent achievability than the comps imply.
- What's the recent tenant-quality profile in this submarket — average credit score on applications, eviction rate, late-payment / NSF rate, and stable-employment percentage? A property-management company in the area should have these aggregated.
- How much new for-sale + rental construction is in the pipeline within 1–3 miles? Heavy new supply typically softens prices + rents 12–24 months out; constrained supply supports both.
Investment metrics
- 1% rule
- 0.86% ✗
- Cap rate
- 5.98%
- Cash-on-cash
- -1.12%
- DSCR
- 0.95
- GRM
- 9.7
CMA / ARV
- ARV (on-the-fly)
- $236,800
- Comps found
- 12
Show comp detail 12 sales within ~0.75 mi
| Address | Dist | Beds/Ba | Sqft | Sold | Price | $/sf | Match |
|---|---|---|---|---|---|---|---|
| 18919 Sunset Horizon | 0.00mi | 3/2.0 | 1,280 (0%) | 4mo | $239,990 | $187 | 97 |
| 18818 Sunset Horizon Dr | 0.00mi | 3/2.0 | 1,280 (0%) | 5mo | $239,990 | $187 | 96 |
| 18806 Sunset Horizon | 0.00mi | 3/2.0 | 1,280 (0%) | 5mo | $236,990 | $185 | 96 |
| 18610 Sunset Horizon Dr | 0.00mi | 3/2.0 | 1,280 (0%) | 8mo | $238,990 | $187 | 93 |
| 18814 Sunset Horizon Dr | 0.00mi | 3/2.0 | 1,434 (+12%) | 2mo | $250,990 | $175 | 78 |
| 18522 Sunset Horizon Dr | 0.00mi | 3/2.0 | 1,156 (-10%) | 9mo | $229,990 | $199 | 77 |
| 18606 Sunset Horizon Dr | 0.00mi | 3/2.0 | 1,434 (+12%) | 7mo | $248,990 | $174 | 74 |
| 18510 Sunset Horizon Dr | 0.00mi | 3/2.0 | 1,434 (+12%) | 8mo | $239,990 | $167 | 74 |
| 18807 Sunset Horizon Dr | 0.00mi | 3/2.5 | 1,470 (+15%) | 3mo | $252,990 | $172 | 71 |
| 18907 Sunset Horizon Dr | 0.00mi | 3/2.5 | 1,470 (+15%) | 3mo | $252,990 | $172 | 71 |
| 18614 Sunset Horizon Dr | 0.00mi | 3/2.5 | 1,470 (+15%) | 6mo | $252,990 | $172 | 68 |
| 114 Oak Hills Ct | 0.71mi | 3/2.0 | 1,092 (-15%) | 6mo | $219,900 | $201 | 37 |
Match score weights: distance 35% · size 25% · config 20% · recency 20%. Top-matched comps best support the ARV.
Projected returns pro-forma
-3.0% appreciation · 0.0% rent growth · sell at horizon
- IRR
- -21.6%
- Equity multiple
- 0.27×
- Total profit
- $-48,212
- Equity at exit
- $35,308
- IRR
- -25.0%
- Equity multiple
- -0.05×
- Total profit
- $-69,881
- Equity at exit
- $20,474
Cash invested: $66,304 (down + closing). Projections, not guarantees.
Landlord ↔ Tenant lean methodology
- Overall (STATE)
- 87 Strongly Landlord-Friendly
- State Texas
- 87 Strongly Landlord-Friendly · R+5
- County
- — inherits STATE
- City
- — inherits STATE
ZIP-level market 77447
- Home prices YoY
- -31.1%
- Rents YoY
- -1.6%
- Active inventory
- 1782
- Price-to-rent
- 9.6×
Monthly cashflow live
- Estimated rent
- $2,035 medium interval (Pro) →
- Mortgage (P&I)
- −$1,242
- Tax est. 1.5%
- −$296 /mo · $3,552/yr
- Insurance
- −$99
- HOA
- −$33
- Vacancy / Maint / Mgmt
- −$427
- Net cashflow
- $-62
Break-even live
UW: 25.0% down · 7.5% · 30yr · 1.5% tax · 5.0% vac · 8.0% maint · 8.0% mgmt
Financing live
Cash to close
- Down payment
- $59,200
- Closing costs
- $7,104
- Reserves months
- —
- Total cash needed
- —
Loan-product check · same deal, 3 products live
Conventional
25% down · 7.5% · 30yr
- Down + closing
- —
- Monthly P&I
- —
- Monthly cashflow
- —
- DSCR
- —
- Eligible?
- —
Personal DTI + credit; lowest rate.
DSCR
20% down · 8.5% · 30yr
- Down + closing
- —
- Monthly P&I
- —
- Monthly cashflow
- —
- DSCR
- —
- Eligible?
- —
No personal income docs; deal must DSCR.
Hard money
10% down · 12.0% · 12mo
- Down + closing
- —
- Monthly P&I
- —
- Monthly cashflow
- —
- DSCR
- —
- Eligible?
- —
Short-term bridge; refi at stabilization.
HOA detail
- Monthly dues
- $33 · $396/yr
Listing history 17 events
-
2026-06-18price $233,990 Active 76 DOM
-
2026-06-18days on market $243,990 Active 76 DOM
-
2026-06-17pricestatus $243,990 Active 75 DOM
-
2026-06-17days on market $246,340 Active Under Contract 75 DOM
-
2026-06-16days on market $246,340 Active Under Contract 74 DOM
-
2026-06-15days on market $246,340 Active Under Contract 73 DOM
-
2026-06-13days on market $246,340 Active Under Contract 71 DOM
-
2026-06-09days on market $246,340 Active Under Contract 67 DOM
-
2026-06-08days on market $246,340 Active Under Contract 66 DOM
-
2026-06-07days on market $246,340 Active Under Contract 65 DOM
-
2026-06-04days on market $246,340 Active Under Contract 62 DOM
-
2026-06-03days on market $246,340 Active Under Contract 61 DOM
-
2026-06-02days on market $246,340 Active Under Contract 60 DOM
-
2026-06-01days on market $246,340 Active Under Contract 59 DOM
-
2026-05-31days on market $246,340 Active Under Contract 58 DOM
-
2026-04-08historical Active Under Contract
-
2026-04-03$246,340 Active
ⓘ Source: listings_history table (triggers on properties + properties_extension) + one-shot
backfill from property_details.listing_events for pre-trigger history.
Nearby sold comps map
Loading sold comps map…
Walkable amenities ~0.75 mi
Loading nearby amenities…
Taxation est. · year 1
- Rental income
- $24,423
- − Mortgage interest
- −$13,264
- − Property taxes
- −$3,552
- − Insurance
- −$1,184
- − Repairs & maintenance
- −$1,954
- − Management
- −$1,954
- − HOA
- −$396
- − Depreciation
- −$6,889
- Taxable loss
- −$4,770
- Est. tax savings @ 24.0%
- +$1,145
- After-tax cash flow
- $405/yr
For passive investors: Depreciation is non-cash, so a rental often shows a tax loss while cash-flowing — sheltering income. Rental losses are passive: they offset passive income freely, and up to $25,000/yr can offset ordinary (W-2) income if you actively participate and your MAGI is under $100k (phasing out to $0 by $150k); unused losses carry forward. On sale, claimed depreciation is recaptured at up to 25%, and gains may owe capital-gains tax (a 1031 exchange can defer both). Figures are a year-1 estimate at your 24.0% rate — not tax advice; consult a CPA.
Condition & rehab AI · 6 photos
This brand-new, move-in-ready home in Sunset Valley offers a modern and well-maintained interior with a spacious floor plan and high-end finishes. The exterior is also in excellent condition, making it an ideal investment property.
Value-add opportunities
- Both Paint interior walls — Fresh paint can enhance curb appeal and interior aesthetics.
- Both Install smart home devices — Smart home devices can improve convenience and add value for both buyers and renters.
- Both Add decorative elements to kitchen island — A decorative element can make the kitchen island more functional and visually appealing.
- Both Upgrade flooring in bathrooms — Upgrading to a more durable and attractive flooring option can enhance the overall value of the home.
Renovation cost estimate screening
Value-add ROI direction
- Both Paint interior walls — Fresh paint can enhance curb appeal and interior aesthetics. ↑
- Both Install smart home devices — Smart home devices can improve convenience and add value for both buyers and renters. ↑
- Both Add decorative elements to kitchen island — A decorative element can make the kitchen island more functional and visually appealing. ↑
- Both Upgrade flooring in bathrooms — Upgrading to a more durable and attractive flooring option can enhance the overall value of the home. ↑
ⓘ Cost ranges are severity-bucket heuristics (US national rule-of-thumb). Get contractor quotes + a written scope before underwriting a rehab budget.
Schools (NCES district)
- District
- Waller ISD
- NCES district ID
- 4844430
- Math proficiency
- 30% ▼ -23.00%
- Reading proficiency
- 35% ▼ -11.00%
- Median HH income
- $58,911
- Composite
- 29.12/100
- National rank
- #6593
- State rank
- #532 of 826 in TX
Livability — Todd Mission
- Score
- 67/100
- State rank
- #549
- US rank
- #10627
Category grades
Schools grade is shown separately in the Schools card above.
Census & demographics
- County
- Harris County · 4,702,590 people
- Metro
- Houston-The Woodlands-Sugar Land, TX
- Population (ZIP)
- 25,231
- Household income
- $116,925
- Rent vs Own
- Severe rent burden
- 265.0
Population outlook (Waller County) Hauer SSP2
- Today (2025)
- 60,772 people
- By 2030
- 67,616 · +11.3%
- By 2040
- 82,283 · +35.4%
- By 2050
- 98,276 · +61.7%
- By 2075
- 142,860 · +135.1%
- By 2100
- 175,596 · +188.9%
Race, ethnicity, and origin ACS 2023
- Neighborhood character
- Diverse neighborhood (Simpson 0.63)
- Race & ethnicity
- White 44% Hispanic / Latino 41% Two or more races 16% Black 9% Asian 1%
- Hispanic origin (detail)
- Mexican 27%
- Common ancestry
- Lithuanian 3% Slovak 1% Romanian 1%
- Foreign-born
- 15% · Canada, Jamaica, Dominican Republic
- Languages at home
- 69% English-only · Spanish 28% Other Indo-European 1% Vietnamese 1%
Political lean MEDSL · Waller
- 2024 margin
- Strong R (+25.0) · D 37.0% · R 62.0% · Other 1.0%
- 2008→2024 swing
- -17.9pp toward R · 2008: -7.2pp · 2024: -25.0pp
- All cycles
- 2024: R+25.0 2020: R+26.7 2016: R+28.6 2012: R+17.6 2008: R+7.2
Not yet ingested
- Civics
- —
Market trends
- HPI YoY
- ▼ -112.73%
- Current HPI
- 249.6969
- Rent YoY
- ▼ -1.58%
- Metro
- Houston-The Woodlands-Sugar Land, TX
- State GDP YoY
- ▲ 3.95%
- F500 in state
- 110
Industry mix (Fortune 500 HQ in TX)
| Industry | F500 HQs | Revenue |
|---|---|---|
| Energy | 16 | $1,198B |
|
||
| Technology | 5 | $198B |
|
||
| Engineering / Construction | 4 | $72B |
|
||
| Energy Services | 3 | $60B |
|
||
| Utilities | 3 | $41B |
|
||
| Healthcare | 2 | $330B |
|
||
Price history
2 events — show timeline
- 2026-04-08 Contingent — HARMLS
- 2026-04-03 Listed $246,340 HARMLS
Cash-flow waterfall
monthlySold comps — $/sqft
last 12 mo · ≤1 miLoading sold comps…