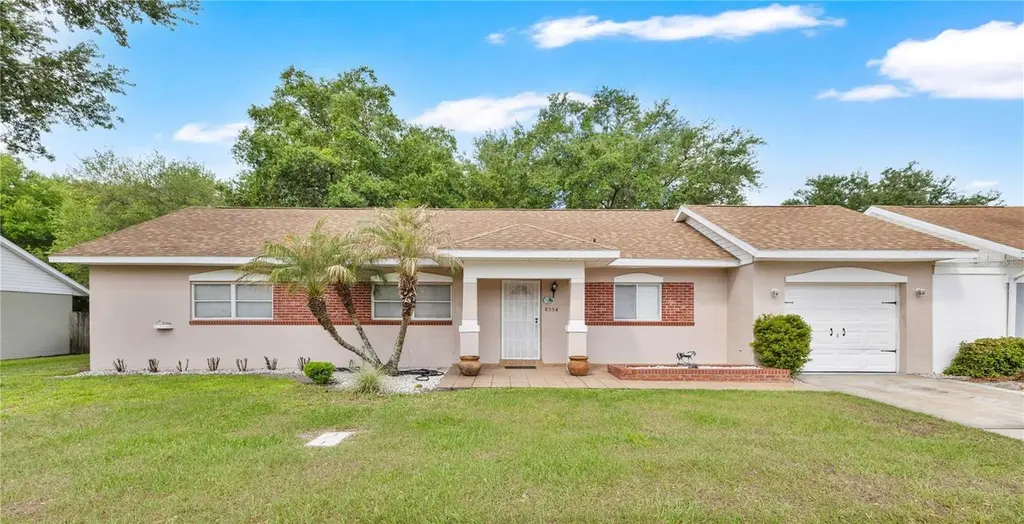
8554 Wichita Pl · Orlando, FL
Flood risk 1/10 · Minimal
- FEMA flood zone
- X (unshaded)
- Chance of flooding over 30 yrs
- 0.0%
- Est. flood insurance / yr
- $507 – $1,088
Fire risk 2/10 · Minimal
- Est. fire insurance / yr
- $947 – $1,759
Heat risk 9/10 · Severe
- Hot days now (above 108°F)
- 7 days/yr
- Hot days in 30 yrs
- 23 days/yr
Wind risk 9/10 · Severe
- Chance of severe wind over 30 yrs
- 99.0%
Air-quality risk 2/10 · Minimal
- Unhealthy air days now
- 0 days/yr
- Unhealthy air days in 30 yrs
- 1 days/yr
Risk factors via First Street. Map © Google.
Why this score? — see what drove the D+ grade
The composite is a weighted blend of 9 inputs, each scored 0–100. Each bar is that input's sub-score; the figure is the points it added to the 100-point composite (weight × sub-score).
- ARV discount +14.8/15.0
- Cash flow +10.7/30.0
- Appreciation +4.9/10.0
- Livability +4.3/5.0
- Schools +4.1/10.0
- DSCR +3.1/10.0
- Condition / age +2.5/5.0
- 1% rule +2.4/10.0
- Rent growth +2.4/5.0
$335,000
🖨 Deal sheet 📄 Offer letter ✓ Due diligence
Listing remarks
Exceptional Central Florida home in a premier location, minutes from Orlando International Airport. This gracious 3 bedrooms, 2 bathrooms home offers expansive living spaces, great size bedrooms, and a private yard — perfect for discerning buyers who value space, style, and effortless travel. Ideal for executives, frequent flyers, or families seeking room to grow without sacrificing convenience. Schedule your private showing today — opportunities like this don’t last.
Key facts
- Private yard
- 8,098 sq ft lot
- Garage
Tags
Property features AI
Finance
- Other: Property is homesteaded; Zoned PD; Lot about 0.19 acres
- HOA & community: Southport Homeowners Association (monthly fee $120); Association fees required; Pet policy: breed restrictions
Exterior
- Parking: Attached 1-car garage
- Utilities: Public water; Public sewer; Electricity available
- Home design: Single family residence; One story; Faces south; Residential property
- Construction: Block and concrete construction; Shingle roof; Slab foundation; Built with approximately 1,631 sq ft living area
- Exterior features: Other exterior features; Asphalt-paved road access
Interior
- Kitchen: Dishwasher; Microwave; Range; Refrigerator
- Bedrooms: 3 bedrooms
- Flooring: Tile
- Bathrooms: 2 full bathrooms
- Heating & cooling: Central heating; Central air conditioning
- Interior features: Ceiling fans
- Laundry & utility: Laundry in garage
Neighborhood map
What this means for you Summary
Snapshot
- This is a 3-bed/2.0-bath single-family listed at $335k.
Deal economics
- At list price, monthly cash flow is $-158 ($-2k/yr) — negative.
- To cash-flow at today's rent, offer at most $307k (8.3% below list).
- To meet the 1% rule (rent ≥ 1% of price), the offer needs to be $247k (26.3% below list).
- Recommended offer: $247k (26.3% below list) — sets the bar for 1% rule.
- Cap rate 5.7% vs local median 3.0% in Orlando — top-decile yield for the area; either an underpriced asset or a hidden risk that comps aren't pricing in. Stress-test before assuming the spread holds.
Location & tenants
- Location reads 86/100 on livability (#12 in FL, #360 nationally) — a professional / high-income tenant draw. Strengths: amenities A+, commute A+, housing A+.
- Orange (suburban): math 46% / reading 51% proficiency, ranked #43 of 73 in FL (top 59%) — families likely to look elsewhere, expect single-tenant / working-renter base with shorter leases.
- Zoned schools: Sally Ride Elementary (math 52% / reading 47%, grade D, #1,088 of 2,144 statewide, top 53%, 406 students, 71% FRL); Oak Ridge High (math 17% / reading 27%, grade F, #544 of 667 statewide, top 82%, 2,477 students, 66% FRL).
- Zoned-school proficiency averages 36% at this address vs 48% district-wide (-13 pts) — the specific schools serving this property underperform the Orange average; the district grade overstates school quality for this exact location.
- Market conditions: Rents soft (-0.6%/yr); 422 active listings in the ZIP; 22 comparable units currently listed for rent nearby; rentals at typical pace (median 21d on market — plan ~3-4 weeks tenant-placement turnaround); high-income renter base; 8,053 units permitted in Orange County in 2024 (3,133 in 5+ unit buildings).
Forward outlook
- In year one you build about $2k of equity ($2k loan paydown + $-694 appreciation (-0.2% local appreciation)).
- Orange County population projected at +52% by 2050 — long-run rental-demand tailwind backs the buy-and-hold thesis.
Negotiation context
- It's been on market 76 days — a 6% lower offer ($315k) is reasonable based on typical stale-listing flexibility.
- Current owner paid $142k; list at $335k implies a 136% gain — meaningful room to come down on a strong offer.
Risks & watch-outs
- Climate carrying-cost: severe wind risk, 99% chance of damaging wind over 30y; extreme-heat days projected 7→23/yr by 2055 (HVAC capex compounding) — expect insurance premiums to compound above CPI over the hold.
Questions for the listing agent
- What do current leases actually rent for vs. the listed asking? Can we see a recent rent roll and the last 12 months of T-12 income?
- It's been on market 76 days. Have you received any prior offers? Is the seller open to a 26% concession, seller financing, or rate buy-down credit?
- Built in 1961 — when were the roof, HVAC, electrical panel, plumbing, and water heater last replaced?
- What does the HOA fee cover, when was the last increase, and are there any pending special assessments or reserve-fund shortfalls?
- Why hasn't it sold? Are there any deal-killer items the seller is aware of (foundation, flood, title, zoning, code violations)?
- Is there a deadline driving the sale (1031 exchange, divorce, estate, relocation)? That informs how much negotiation room exists.
- Schools are B-rated — typically a magnet for longer-tenancy family renters. What's the average tenant stay here, and is there a school-zone premium baked into asking?
- The area grade is low — what's the realistic commute time and amenity access for the typical tenant pool here? Any planned neighborhood developments (good or bad) we should know about?
- What's the average days-on-market for RENTAL listings here right now (not sales)? A rising rental-DOM trend means longer vacancies and softer asking-rent achievability than the comps imply.
- What's the recent tenant-quality profile in this submarket — average credit score on applications, eviction rate, late-payment / NSF rate, and stable-employment percentage? A property-management company in the area should have these aggregated.
- How much new for-sale + rental construction is in the pipeline within 1–3 miles? Heavy new supply typically softens prices + rents 12–24 months out; constrained supply supports both.
Investment metrics
- 1% rule
- 0.74% ✗
- Cap rate
- 5.73%
- Cash-on-cash
- -2.02%
- DSCR
- 0.91
- GRM
- 11.3
CMA / ARV
- ARV (on-the-fly)
- $399,595
- Comps found
- 1
Show comp detail 1 sale within ~0.75 mi
| Address | Dist | Beds/Ba | Sqft | Sold | Price | $/sf | Match |
|---|---|---|---|---|---|---|---|
| 8495 Barnstable Pl | 0.11mi | 3/2.0 | 1,431 (-12%) | 16mo | $350,000 | $245 | 61 |
Match score weights: distance 35% · size 25% · config 20% · recency 20%. Top-matched comps best support the ARV.
Projected returns pro-forma
-0.21% appreciation · 0.0% rent growth · sell at horizon
- IRR
- -7.2%
- Equity multiple
- 0.68×
- Total profit
- $-30,447
- Equity at exit
- $93,817
- IRR
- -3.0%
- Equity multiple
- 0.71×
- Total profit
- $-27,498
- Equity at exit
- $110,051
Cash invested: $93,800 (down + closing). Projections, not guarantees.
Landlord ↔ Tenant lean methodology
- Overall (STATE)
- 87 Strongly Landlord-Friendly
- State Florida
- 87 Strongly Landlord-Friendly · R+3
- County
- — inherits STATE
- City
- — inherits STATE
ZIP-level market 32827
- Home prices YoY
- -0.1%
- Rents YoY
- -0.6%
- Active inventory
- 422
- Price-to-rent
- 11.3×
Monthly cashflow live
- Estimated rent
- $2,469 high interval (Pro) →
- Mortgage (P&I)
- −$1,757
- Tax from tax record
- −$92 /mo · $1,109/yr
- Insurance
- −$140
- HOA
- −$120
- Vacancy / Maint / Mgmt
- −$519
- Net cashflow
- $-158
Break-even live
UW: 25.0% down · 7.5% · 30yr · 1.5% tax · 5.0% vac · 8.0% maint · 8.0% mgmt
Financing live
Cash to close
- Down payment
- $83,750
- Closing costs
- $10,050
- Reserves months
- —
- Total cash needed
- —
Loan-product check · same deal, 3 products live
Conventional
25% down · 7.5% · 30yr
- Down + closing
- —
- Monthly P&I
- —
- Monthly cashflow
- —
- DSCR
- —
- Eligible?
- —
Personal DTI + credit; lowest rate.
DSCR
20% down · 8.5% · 30yr
- Down + closing
- —
- Monthly P&I
- —
- Monthly cashflow
- —
- DSCR
- —
- Eligible?
- —
No personal income docs; deal must DSCR.
Hard money
10% down · 12.0% · 12mo
- Down + closing
- —
- Monthly P&I
- —
- Monthly cashflow
- —
- DSCR
- —
- Eligible?
- —
Short-term bridge; refi at stabilization.
Rent comps 22 comps
| Address | Beds | Baths | Sqft | Rent | $/sqft | DOM | Units | Dist |
|---|---|---|---|---|---|---|---|---|
| 3211 San Pedro Ln Orlando, FL | 3.0 | 2.0 | 1571 | $2,400 | $1.53 | 16d | 1 | 0.40mi |
| 3211 San Pedro Ln Orlando, FL | 3.0 | 2.0 | 1571 | $2,295 | $1.46 | 11d | 1 | 0.40mi |
| 2323 McCoy Rd Belle Isle, FL | 2.0–3.0 | 2.0 | 1025 | $1,700 | $1.66 | 2d | 1 | 0.84mi |
| 2121 McCoy Rd Belle Isle, FL | 2.0 | 2.0 | 1055 | $1,725 | $1.63 | 15d | 2 | 0.85mi |
| 1534 Sage Creek Ct Orlando, FL | 4.0 | 2.5 | 1901 | $2,435 | $1.28 | 20d | 1 | 0.98mi |
| 3749 Brighton Park Cir Orlando, FL | 3.0 | 2.5 | 1674 | $2,650 | $1.58 | 24d | 1 | 0.98mi |
| 3733 Brighton Park Cir Orlando, FL | 3.0 | 2.5 | 1610 | $2,500 | $1.55 | 18d | 1 | 0.99mi |
| 9599 Lupine Ave Orlando, FL | 3.0 | 2.0 | 1248 | $2,235 | $1.79 | 2d | 1 | 1.04mi |
| 7824 Holiday Isle Dr #203 Orlando, FL | 3.0 | 2.0 | 1701 | $2,995 | $1.76 | 3d | 1 | 1.09mi |
| 9751 Red Clover Ave Orlando, FL | 3.0 | 2.0 | 1224 | $2,210 | $1.81 | 20d | 1 | 1.23mi |
| 1914 Teaberry Ct Orlando, FL | 4.0 | 2.0 | 1177 | $2,550 | $2.17 | 22d | 1 | 1.23mi |
| 9663 Cypress Park Dr Unit m9663c Orlando, FL | 3.0 | 2.0 | 1056 | $1,750 | $1.66 | 18d | 1 | 1.28mi |
| 1209 Southstation Pl #307 Orlando, FL | 3.0 | 2.5 | 1687 | $2,150 | $1.27 | 3d | 1 | 1.30mi |
| 1209 Southstation Pl Pine Castle, FL | 3.0 | 2.5 | 1687 | $2,300 | $1.36 | 22d | 1 | 1.30mi |
| 1209 Southstation Pl #308 Orlando, FL | 3.0 | 2.5 | 1687 | $2,300 | $1.36 | 20d | 1 | 1.30mi |
| 1213 Southstation Pl #402 Orlando, FL | 3.0 | 2.5 | 1687 | $2,500 | $1.48 | 24d | 1 | 1.31mi |
| 1217 Southstation Pl Pine Castle, FL | 3.0 | 2.5 | 1615 | $2,400 | $1.49 | 24d | 1 | 1.32mi |
| 1220 Southstation Pl Unit 2-311 Pine Castle, FL | 2.0 | 2.0 | 1153 | $1,800 | $1.56 | 24d | 1 | 1.33mi |
| 1201 Southstation Pl #108 Orlando, FL | 3.0 | 2.0 | 1687 | $2,390 | $1.42 | 24d | 1 | 1.37mi |
| 1201 Southstation Pl #108 Orlando, FL | 3.0 | 2.0 | 1687 | $2,390 | $1.42 | 4d | 1 | 1.37mi |
| 1201 Southstation Pl #108 Orlando, FL | 3.0 | 2.5 | 1687 | $2,390 | $1.42 | 18d | 1 | 1.37mi |
| 1210 Southstation Pl #209 Orlando, FL | 3.0 | 2.0 | 1142 | $2,150 | $1.88 | 24d | 1 | 1.38mi |
HOA detail
- Monthly dues
- $120 · $1,440/yr
Listing history 20 events
-
2026-06-18days on market $335,000 Active 76 DOM
-
2026-06-17days on market $335,000 Active 75 DOM
-
2026-06-16days on market $335,000 Active 74 DOM
-
2026-06-15days on market $335,000 Active 73 DOM
-
2026-06-13days on market $335,000 Active 71 DOM
-
2026-06-13days on market $335,000 Active 70 DOM
-
2026-06-09days on market $335,000 Active 67 DOM
-
2026-06-08days on market $335,000 Active 66 DOM
-
2026-06-07days on market $335,000 Active 65 DOM
-
2026-06-04days on market $335,000 Active 62 DOM
-
2026-06-03days on market $335,000 Active 61 DOM
-
2026-06-02days on market $335,000 Active 60 DOM
-
2026-06-02days on market $335,000 Active 59 DOM
-
2026-05-31days on market $335,000 Active 58 DOM
-
2026-05-11price $335,000
-
2026-04-30price $340,000
-
2026-04-21price $350,000
-
2026-04-03$360,000 Active
-
2005-04-05soldstatus $142,000
-
2003-12-08soldstatus $115,000
ⓘ Source: listings_history table (triggers on properties + properties_extension) + one-shot
backfill from property_details.listing_events for pre-trigger history.
Tax reassessment forecast FL · Resets to sale price
- Current annual tax
- $1,109 · $92/mo
- Projected year-2 tax
- $2,780 · $232/mo
- Expected delta
- +$1,671/yr (+$139/mo · 150.7%)
ⓘ Screening estimate from a state-policy table — verify with the county assessor before closing.
Climate risk First Street
- Flood 1/10 Low FEMA zone X (unshaded) · 0% chance over 30 yrs
- Wildfire 2/10 Low
- Heat 9/10 Extreme 7 d/yr ≥108°F today · 23 d/yr by 30 yrs out
- Wind 9/10 Extreme 99% chance of damaging wind over 30 yrs
- Air quality 2/10 Low 0 unhealthy d/yr today · 1 by 30 yrs out
Nearby sold comps map
Loading sold comps map…
Walkable amenities ~0.75 mi
Loading nearby amenities…
Taxation est. · year 1
- Rental income
- $29,630
- − Mortgage interest
- −$18,765
- − Property taxes
- −$1,109
- − Insurance
- −$1,675
- − Repairs & maintenance
- −$2,370
- − Management
- −$2,370
- − HOA
- −$1,440
- − Depreciation
- −$9,745
- Taxable loss
- −$7,846
- Est. tax savings @ 24.0%
- +$1,883
- After-tax cash flow
- $-15/yr
For passive investors: Depreciation is non-cash, so a rental often shows a tax loss while cash-flowing — sheltering income. Rental losses are passive: they offset passive income freely, and up to $25,000/yr can offset ordinary (W-2) income if you actively participate and your MAGI is under $100k (phasing out to $0 by $150k); unused losses carry forward. On sale, claimed depreciation is recaptured at up to 25%, and gains may owe capital-gains tax (a 1031 exchange can defer both). Figures are a year-1 estimate at your 24.0% rate — not tax advice; consult a CPA.
Schools (NCES district)
- District
- Orange
- NCES district ID
- 1201440
- Math proficiency
- 46% ▼ -9.00%
- Reading proficiency
- 51% ▼ -2.00%
- Median HH income
- $49,350
- Composite
- 41.47/100
- National rank
- #3461
- State rank
- #43 of 73 in FL
Livability — Orlando
- Score
- 86/100
- State rank
- #12
- US rank
- #360
Category grades
Schools grade is shown separately in the Schools card above.
Census & demographics
- Census place
- Orlando, FL
- County
- Orange County · 1,471,359 people
- City population
- 964,969
- Metro
- Orlando-Kissimmee-Sanford, FL
- Population (ZIP)
- 19,711
- Household income
- $117,483
- Rent vs Own
- Severe rent burden
- 956.0
Population outlook (Orange County) Hauer SSP2
- Today (2025)
- 1,618,226 people
- By 2030
- 1,787,404 · +10.5%
- By 2040
- 2,125,621 · +31.4%
- By 2050
- 2,454,016 · +51.6%
- By 2075
- 3,173,711 · +96.1%
- By 2100
- 3,607,781 · +122.9%
Race, ethnicity, and origin ACS 2023
- Neighborhood character
- Diverse neighborhood (Simpson 0.69)
- Race & ethnicity
- White 42% Hispanic / Latino 35% Two or more races 19% Black 10% Asian 7%
- Hispanic origin (detail)
- Puerto Rican 16% Cuban 4% Dominican 5%
- Common ancestry
- Estonian 4% Lithuanian 2% Italian 1%
- Foreign-born
- 24% · Canada, Jamaica, Guatemala
- Languages at home
- 55% English-only · Spanish 27% Other Indo-European 10% Arabic 2%
Political lean MEDSL · Orange
- 2024 margin
- D (+13.6) · D 56.1% · R 42.5% · Other 1.3%
- 2008→2024 swing
- -5.0pp toward R · 2008: 18.6pp · 2024: 13.6pp
- All cycles
- 2024: D+13.6 2020: D+23.1 2016: D+24.6 2012: D+18.2 2008: D+18.6
Not yet ingested
- Civics
- —
Market trends
- HPI YoY
- ▼ -0.21%
- Current HPI
- 265.2611
- Rent YoY
- ▼ -0.56%
- Metro
- Orlando-Kissimmee-Sanford, FL
- State GDP YoY
- ▲ 3.28%
- F500 in state
- 36
Industry mix (Fortune 500 HQ in FL)
| Industry | F500 HQs | Revenue |
|---|---|---|
| Industrial Technology | 2 | $29B |
|
||
| Insurance | 2 | $17B |
|
||
| Retail | 1 | $60B |
|
||
| Technology Distribution | 1 | $58B |
|
||
| Homebuilding | 1 | $35B |
|
||
| Technology Manufacturing | 1 | $35B |
|
||
Price history
+191.3% since first listed6 events — show timeline
- 2026-05-11 Price Changed $335,000 Stellar MLS as Distributed by MLS Grid
- 2026-04-30 Price Changed $340,000 Stellar MLS as Distributed by MLS Grid
- 2026-04-21 Price Changed $350,000 Stellar MLS as Distributed by MLS Grid
- 2026-04-03 Listed $360,000 Stellar MLS as Distributed by MLS Grid
- 2005-04-05 Sold (Public Records) $142,000 Public Records
- 2003-12-08 Sold (Public Records) $115,000 Public Records
Property tax history
+2.9%/yrLatest (2025): $1,109 · +8.5% YoY. Source: county tax records.
Cash-flow waterfall
monthlySold comps — $/sqft
last 12 mo · ≤1 miLoading sold comps…