 Triplex
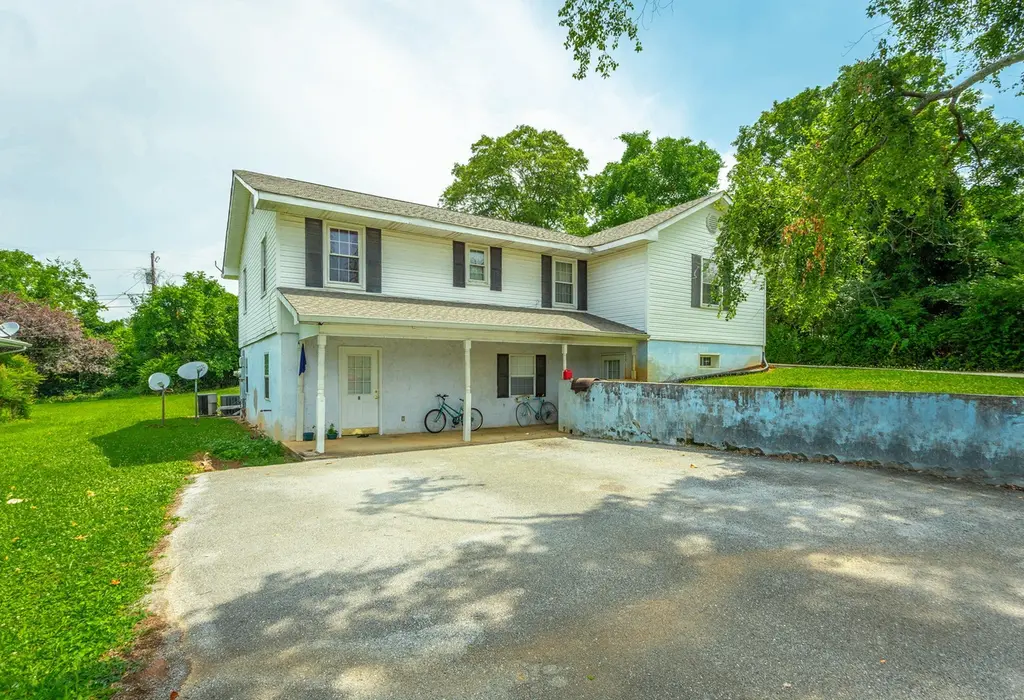
6625 Vaden Dr · Chattanooga, TN
Flood risk 1/10 · Minimal
- FEMA flood zone
- X (unshaded)
- Chance of flooding over 30 yrs
- 0.0%
- Est. flood insurance / yr
- $507 – $1,088
Fire risk 1/10 · Minimal
- Est. fire insurance / yr
- $949 – $1,763
Heat risk 6/10 · Moderate
- Hot days now (above 105°F)
- 7 days/yr
- Hot days in 30 yrs
- 19 days/yr
Wind risk 4/10 · Minor
- Chance of severe wind over 30 yrs
- 10.0%
Air-quality risk 3/10 · Minor
- Unhealthy air days now
- 2 days/yr
- Unhealthy air days in 30 yrs
- 2 days/yr
Risk factors via First Street. Map © Google.
Why this score? — see what drove the C+ grade
The composite is a weighted blend of 9 inputs, each scored 0–100. Each bar is that input's sub-score; the figure is the points it added to the 100-point composite (weight × sub-score).
- Cash flow +27.1/30.0
- DSCR +9.4/10.0
- ARV discount +7.5/15.0
- 1% rule +6.7/10.0
- Livability +3.9/5.0
- Schools +2.7/10.0
- Condition / age +2.5/5.0
- Rent growth +2.2/5.0
- Appreciation +0.0/10.0
$389,000
🖨 Deal sheet 📄 Offer letter ✓ Due diligence
Multi-family units
County records classify this as Multi-Family (2-4 Unit). Listing-text estimate: 3 units. confirmed
Listing remarks MLS
Location, Location, Location. Great Investment property that will pay for itself or owner occupant with income from 2 Apartments in the basement. 100 % OCCUPIED. Top level 1670 sq. ft. 3 bedrooms, 2 full bathrooms, living and dining combination, large eat in kitchen with lots cabinet space, den, Laundry room and hardwood floors in bedrooms, hall way and den. Large deck and storage building in back yard remains with the property. Top unit rented for $1,200.00, Lower level has 2 apartments, each unit with 1 bedroom, 1 full bath, eat in kitchen, living room and laundry hook-ups and rented for $600.00 per unit. GROSS MONTHLY INCOME PER MONTH IS $2,400.00. New roof in 2019, newer vinyl windows, 3 electric meters, 3 separate heat pumps and 1 water meter. Please Do Not Disturb the tenants.
Key facts
- 0.28 acre lot
- Built 1999
- Listed 59 days
Property features AI
Finance
- HOA & community: No community features
Exterior
- Parking: Driveway
- Utilities: Public water; Public sewer (sewer connected)
- Home design: Triplex (residential income); Two stories
- Construction: Shingle roof; Other construction materials
- Exterior features: Deck; Patio; Gentle sloping to level lot
Interior
- Kitchen: Eat-in kitchen
- Bathrooms: 4 full bathrooms
- Heating & cooling: Central electric heating; Central electric cooling
- Interior features: Eat-in kitchen; Open floorplan; Storage; Finished basement
Neighborhood map
What this means for you Summary
Snapshot
- This is a 1×5bd/4.0ba + 2×1bd/1.0ba units multifamily listed at $389k.
Deal economics
- At list price, monthly cash flow is $1k ($13k/yr) — positive. Per door: $367/mo.
- The deal already cash-flows at list — no discount required.
- Meets the 1% rule at list price ($5k rent vs $389k).
- Recommended offer: $377k (3.0% below list) — sets the bar for market timing.
- Cap rate 9.7% vs local median 3.4% in Chattanooga — top-decile yield for the area; either an underpriced asset or a hidden risk that comps aren't pricing in. Stress-test before assuming the spread holds.
Location & tenants
- Location reads 78/100 on livability (#3 in TN, #2,582 nationally) — a middle-class / working-renter tenant base. Strengths: amenities A+, commute A+, cost of living A+; Watch: employment D+, crime F.
- Hamilton County (urban): math 31% / reading 31% proficiency, ranked #42 of 139 in TN (top 30%) — families likely to look elsewhere, expect single-tenant / working-renter base with shorter leases.
- Zoned schools: Bess T Shepherd Elementary (math 16% / reading 15%, grade F, #745 of 952 statewide, top 79%, 496 students, 0% FRL); Tyner Middle Academy (math 12% / reading 11%, grade F, #247 of 333 statewide, top 75%, 392 students, 0% FRL); Tyner Academy (math 8% / reading 5%, grade F, #305 of 332 statewide, top 92%, 559 students, 0% FRL) — zoned schools average 0% FRL vs 52% district-wide (52 pts lower); this property's tenant base skews higher-income than the district average.
- Zoned-school proficiency averages 11% at this address vs 31% district-wide (-20 pts) — the specific schools serving this property underperform the Hamilton County average; the district grade overstates school quality for this exact location.
- Market conditions: Rents soft (-1.0%/yr); 572 active listings in the ZIP; solid renter incomes; 2,133 units permitted in Hamilton County in 2024 (405 in 5+ unit buildings).
- At $4,550/mo this rent would consume 66% of the median local household income ($83k/yr) (locally 1975% of renters already pay >50% of income on rent) — very limited rent-growth headroom before tenants either downsize or default.
Forward outlook
- Local home prices are declining (-3.0%/yr); year-one equity from $3k of loan paydown is wiped out by about $12k of value loss. Plan a longer hold.
- Hamilton County population projected at +23% by 2050 — long-run rental-demand tailwind backs the buy-and-hold thesis.
Negotiation context
- It's been on market 59 days — a 3% lower offer ($377k) is reasonable based on typical stale-listing flexibility.
- 2 sale attempts since 6y ago with the ask held roughly flat each time — persistent listings suggest the price (not the market) is what's stuck; bring a comps-based counter.
- Current owner paid $245k; list at $389k implies a 59% gain — meaningful room to come down on a strong offer.
Risks & watch-outs
- Climate carrying-cost: extreme-heat days projected 7→19/yr by 2055 (HVAC capex compounding) — expect insurance premiums to compound above CPI over the hold.
Questions for the listing agent
- It's been on market 59 days. Have you received any prior offers? Is the seller open to a 3% concession, seller financing, or rate buy-down credit?
- Can we see the unit-by-unit rent roll, current vacancy, and any below-market leases? What's the average tenancy length?
- What capital expenditures (roof, boiler, parking lot, exteriors) have been made in the last 5 years, and what's planned in the next 2?
- Is there a deadline driving the sale (1031 exchange, divorce, estate, relocation)? That informs how much negotiation room exists.
- Schools are F-rated, which usually means shorter tenancies and higher turnover. Who's the typical renter profile here, and what's been the actual vacancy rate?
- Crime grade is F in this area — have there been break-ins, vandalism, or insurance claims at this property in the last 3 years? What carrier currently insures it and at what premium?
- What's the average days-on-market for RENTAL listings here right now (not sales)? A rising rental-DOM trend means longer vacancies and softer asking-rent achievability than the comps imply.
- What's the recent tenant-quality profile in this submarket — average credit score on applications, eviction rate, late-payment / NSF rate, and stable-employment percentage? A property-management company in the area should have these aggregated.
- How much new apartment / multifamily construction is in the pipeline within 1–3 miles? Heavy new supply (>2% of stock underway) typically softens rents 12–24 months out; light construction supports rent growth.
Investment metrics
- 1% rule
- 1.17% ✓
- Cap rate
- 9.69%
- Cash-on-cash
- 12.13%
- DSCR
- 1.54
- GRM
- 7.1
CMA / ARV
No comps found within radius.
Projected returns pro-forma
-3.0% appreciation · 0.0% rent growth · sell at horizon
- IRR
- -1.6%
- Equity multiple
- 0.94×
- Total profit
- $-6,269
- Equity at exit
- $58,001
- IRR
- 4.8%
- Equity multiple
- 1.30×
- Total profit
- $33,132
- Equity at exit
- $33,634
Cash invested: $108,920 (down + closing). Projections, not guarantees.
Landlord ↔ Tenant lean methodology
- Overall (STATE)
- 87 Strongly Landlord-Friendly
- State Tennessee
- 87 Strongly Landlord-Friendly · R+13
- County
- — inherits STATE
- City
- — inherits STATE
ZIP-level market 37421
- Rents YoY
- -1.0%
- Active inventory
- 572
- Price-to-rent
- 15.4×
Monthly cashflow live
- Estimated rent
- $4,550 medium interval (Pro) →
- Mortgage (P&I)
- −$2,040
- Tax from tax record
- −$291 /mo · $3,492/yr
- Insurance
- −$162
- HOA
- −$0
- Vacancy / Maint / Mgmt
- −$956
- Net cashflow
- $1,101
Break-even live
3-unit breakdown (identical units grouped — click to expand)
| Units | Beds | Baths | Est. rent |
|---|---|---|---|
| 1× unit | 5 | 4 | $2,099 |
| 2× units | 1 | 1 | $2,450 |
| #2 | 1 | 1 | $1,225 |
| #3 | 1 | 1 | $1,225 |
| Total (3 units) | $4,550 | ||
UW: 25.0% down · 7.5% · 30yr · 1.5% tax · 5.0% vac · 8.0% maint · 8.0% mgmt
Financing live
Cash to close
- Down payment
- $97,250
- Closing costs
- $11,670
- Reserves months
- —
- Total cash needed
- —
Loan-product check · same deal, 3 products live
Conventional
25% down · 7.5% · 30yr
- Down + closing
- —
- Monthly P&I
- —
- Monthly cashflow
- —
- DSCR
- —
- Eligible?
- —
Personal DTI + credit; lowest rate.
DSCR
20% down · 8.5% · 30yr
- Down + closing
- —
- Monthly P&I
- —
- Monthly cashflow
- —
- DSCR
- —
- Eligible?
- —
No personal income docs; deal must DSCR.
Hard money
10% down · 12.0% · 12mo
- Down + closing
- —
- Monthly P&I
- —
- Monthly cashflow
- —
- DSCR
- —
- Eligible?
- —
Short-term bridge; refi at stabilization.
Listing history 19 events
-
2026-06-18days on market $389,000 Active 59 DOM
-
2026-06-17days on market $389,000 Active 58 DOM
-
2026-06-16days on market $389,000 Active 57 DOM
-
2026-06-15days on market $389,000 Active 56 DOM
-
2026-06-14days on market $389,000 Active 54 DOM
-
2026-06-10days on market $389,000 Active 51 DOM
-
2026-06-09days on market $389,000 Active 50 DOM
-
2026-06-08days on market $389,000 Active 49 DOM
-
2026-06-07statusdays on market $389,000 Active 48 DOM
-
2026-04-10$389,000 Active
-
2020-08-11soldstatus $245,000
-
2020-08-10soldstatus $245,000 Closed 794-char remark
Show marketing remark (793 chars)
Location, Location, Location. Great Investment property that will pay for itself or owner occupant with income from 2 Apartments in the basement. 100 % OCCUPIED. Top level 1670 sq. ft. 3 bedrooms, 2 full bathrooms, living and dining combination, large eat in kitchen with lots cabinet space, den, Laundry room and hardwood floors in bedrooms, hall way and den. Large deck and storage building in back yard remains with the property. Top unit rented for $1,200.00, Lower level has 2 apartments, each unit with 1 bedroom, 1 full bath, eat in kitchen, living room and laundry hook-ups and rented for $600.00 per unit. GROSS MONTHLY INCOME PER MONTH IS $2,400.00. New roof in 2019, newer vinyl windows, 3 electric meters, 3 separate heat pumps and 1 water meter. Please Do Not Disturb the tenants.
-
2020-08-10soldstatus $245,000 793-char remark
Show marketing remark (793 chars)
Location, Location, Location. Great Investment property that will pay for itself or owner occupant with income from 2 Apartments in the basement. 100 % OCCUPIED. Top level 1670 sq. ft. 3 bedrooms, 2 full bathrooms, living and dining combination, large eat in kitchen with lots cabinet space, den, Laundry room and hardwood floors in bedrooms, hall way and den. Large deck and storage building in back yard remains with the property. Top unit rented for $1,200.00, Lower level has 2 apartments, each unit with 1 bedroom, 1 full bath, eat in kitchen, living room and laundry hook-ups and rented for $600.00 per unit. GROSS MONTHLY INCOME PER MONTH IS $2,400.00. New roof in 2019, newer vinyl windows, 3 electric meters, 3 separate heat pumps and 1 water meter. Please Do Not Disturb the tenants.
-
2020-07-14historical Contingent 794-char remark
Show marketing remark (794 chars)
Location, Location, Location. Great Investment property that will pay for itself or owner occupant with income from 2 Apartments in the basement. 100 % OCCUPIED. Top level 1670 sq. ft. 3 bedrooms, 2 full bathrooms, living and dining combination, large eat in kitchen with lots cabinet space, den, Laundry room and hardwood floors in bedrooms, hall way and den. Large deck and storage building in back yard remains with the property. Top unit rented for $1,200.00, Lower level has 2 apartments, each unit with 1 bedroom, 1 full bath, eat in kitchen, living room and laundry hook-ups and rented for $600.00 per unit. GROSS MONTHLY INCOME PER MONTH IS $2,400.00. New roof in 2019, newer vinyl windows, 3 electric meters, 3 separate heat pumps and 1 water meter. Please Do Not Disturb the tenants.
-
2020-07-13$252,500 Active 794-char remark
Show marketing remark (794 chars)
Location, Location, Location. Great Investment property that will pay for itself or owner occupant with income from 2 Apartments in the basement. 100 % OCCUPIED. Top level 1670 sq. ft. 3 bedrooms, 2 full bathrooms, living and dining combination, large eat in kitchen with lots cabinet space, den, Laundry room and hardwood floors in bedrooms, hall way and den. Large deck and storage building in back yard remains with the property. Top unit rented for $1,200.00, Lower level has 2 apartments, each unit with 1 bedroom, 1 full bath, eat in kitchen, living room and laundry hook-ups and rented for $600.00 per unit. GROSS MONTHLY INCOME PER MONTH IS $2,400.00. New roof in 2019, newer vinyl windows, 3 electric meters, 3 separate heat pumps and 1 water meter. Please Do Not Disturb the tenants.
-
2008-05-30soldstatus $172,500
-
2004-06-28soldstatus $156,200
-
2002-04-19soldstatus $133,800
-
2000-02-15soldstatus $87,000
ⓘ Source: listings_history table (triggers on properties + properties_extension) + one-shot
backfill from property_details.listing_events for pre-trigger history.
Tax reassessment forecast TN · Resets to sale price
- Current annual tax
- $3,492 · $291/mo
- Projected year-2 tax
- $3,492 · $291/mo
- Expected delta
- $0/yr ($0/mo · 0.0%)
ⓘ Screening estimate from a state-policy table — verify with the county assessor before closing.
Climate risk First Street
- Flood 1/10 Low FEMA zone X (unshaded) · 0% chance over 30 yrs
- Wildfire 1/10 Low
- Heat 6/10 Major 7 d/yr ≥105°F today · 19 d/yr by 30 yrs out
- Wind 4/10 Moderate 10% chance of damaging wind over 30 yrs
- Air quality 3/10 Moderate 2 unhealthy d/yr today · 2 by 30 yrs out
Nearby sold comps map
Loading sold comps map…
Walkable amenities ~0.75 mi
Loading nearby amenities…
Taxation est. · year 1
- Rental income
- $54,600
- − Mortgage interest
- −$21,790
- − Property taxes
- −$3,492
- − Insurance
- −$1,945
- − Repairs & maintenance
- −$4,368
- − Management
- −$4,368
- − Depreciation
- −$11,316
- Taxable income
- $7,320
- Est. tax owed @ 24.0%
- −$1,757
- After-tax cash flow
- $11,460/yr
For passive investors: Depreciation is non-cash, so a rental often shows a tax loss while cash-flowing — sheltering income. Rental losses are passive: they offset passive income freely, and up to $25,000/yr can offset ordinary (W-2) income if you actively participate and your MAGI is under $100k (phasing out to $0 by $150k); unused losses carry forward. On sale, claimed depreciation is recaptured at up to 25%, and gains may owe capital-gains tax (a 1031 exchange can defer both). Figures are a year-1 estimate at your 24.0% rate — not tax advice; consult a CPA.
Schools (NCES district)
- District
- Hamilton County
- NCES district ID
- 4701590
- Math proficiency
- 31% ▼ -10.00%
- Reading proficiency
- 31% ▼ -3.00%
- Median HH income
- $47,456
- Composite
- 26.8/100
- National rank
- #7122
- State rank
- #42 of 139 in TN
Livability — Chattanooga
- Score
- 78/100
- State rank
- #3
- US rank
- #2582
Category grades
Schools grade is shown separately in the Schools card above.
Census & demographics
- Census place
- Chattanooga, TN
- County
- Hamilton County · 312,777 people
- City population
- 131,999
- Metro
- Chattanooga, TN-GA
- Population (ZIP)
- 52,985
- Household income
- $82,517
- Rent vs Own
- Severe rent burden
- 1975.0
Population outlook (Hamilton County) Hauer SSP2
- Today (2025)
- 393,784 people
- By 2030
- 412,983 · +4.9%
- By 2040
- 449,502 · +14.1%
- By 2050
- 484,341 · +23.0%
- By 2075
- 565,746 · +43.7%
- By 2100
- 618,394 · +57.0%
Race, ethnicity, and origin ACS 2023
- Neighborhood character
- Diverse neighborhood (Simpson 0.56)
- Race & ethnicity
- White 61% Black 23% Hispanic / Latino 8% Two or more races 6% Asian 5%
- Hispanic origin (detail)
- Mexican 5%
- Common ancestry
- Italian 2% Slovak 2% Serbian 2%
- Foreign-born
- 9% · Canada, South Korea, Vietnam
- Languages at home
- 88% English-only · Spanish 6% Other Indo-European 2% Other Asian/Pacific 1%
Political lean MEDSL · Hamilton
- 2024 margin
- R (+13.1) · D 42.7% · R 55.7% · Other 1.6%
- 2008→2024 swing
- -1.2pp toward R · 2008: -11.8pp · 2024: -13.1pp
- All cycles
- 2024: R+13.1 2020: R+9.7 2016: R+16.6 2012: R+14.8 2008: R+11.8
Not yet ingested
- Civics
- —
Market trends
- HPI YoY
- ▼ -316.60%
- Current HPI
- 237.6897
- Rent YoY
- ▼ -1.04%
- Metro
- Chattanooga, TN-GA
- State GDP YoY
- ▲ 2.78%
- F500 in state
- 22
Industry mix (Fortune 500 HQ in TN)
| Industry | F500 HQs | Revenue |
|---|---|---|
| Healthcare | 3 | $91B |
|
||
| Retail | 3 | $72B |
|
||
| Transportation / Logistics | 1 | $88B |
|
||
| Paper / Packaging | 1 | $19B |
|
||
| Insurance | 1 | $13B |
|
||
| Energy | 1 | $12B |
|
||
Price history
+347.1% since first listed10 events — show timeline
- 2026-04-10 Listed $389,000 GCAR
- 2020-08-11 Sold (Public Records) $245,000 Public Records
- 2020-08-10 Sold (MLS) $245,000 REALTRACS as Distributed by MLS Grid
- 2020-08-10 Sold (MLS) $245,000 GCAR
- 2020-07-14 Contingent — GCAR
- 2020-07-13 Listed $252,500 GCAR
- 2008-05-30 Sold (Public Records) $172,500 Public Records
- 2004-06-28 Sold (Public Records) $156,200 Public Records
- 2002-04-19 Sold (Public Records) $133,800 Public Records
- 2000-02-15 Sold (Public Records) $87,000 Public Records
Property tax history
+6.3%/yrLatest (2025): $3,492 · +65.1% YoY. Source: county tax records.
Cash-flow waterfall
monthlySold comps — $/sqft
last 12 mo · ≤1 miLoading sold comps…