 34-Plex
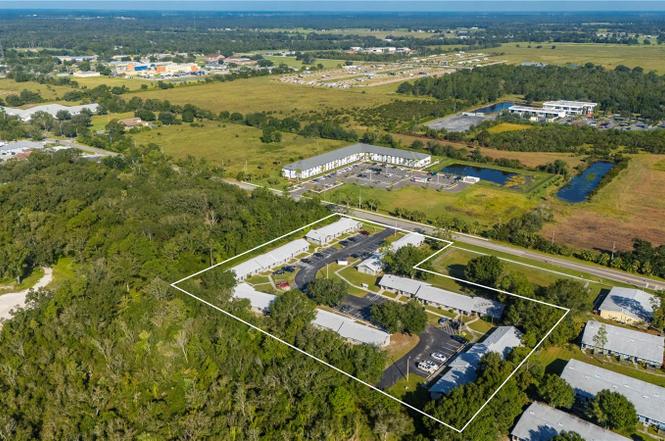
1450 E Gibson St · Arcadia, FL
Flood risk 1/10 · Minimal
- FEMA flood zone
- X (unshaded)
- Chance of flooding over 30 yrs
- 0.0%
- Est. flood insurance / yr
- $507 – $1,088
Fire risk 3/10 · Minor
- Est. fire insurance / yr
- $947 – $1,759
Heat risk 9/10 · Severe
- Hot days now (above 107°F)
- 7 days/yr
- Hot days in 30 yrs
- 26 days/yr
Wind risk 10/10 · Severe
- Chance of severe wind over 30 yrs
- 99.0%
Air-quality risk 2/10 · Minimal
- Unhealthy air days now
- 1 days/yr
- Unhealthy air days in 30 yrs
- 2 days/yr
Risk factors via First Street. Map © Google.
Why this score? — see what drove the C+ grade
The composite is a weighted blend of 9 inputs, each scored 0–100. Each bar is that input's sub-score; the figure is the points it added to the 100-point composite (weight × sub-score).
- Cash flow +27.1/30.0
- DSCR +9.4/10.0
- ARV discount +7.5/15.0
- 1% rule +6.6/10.0
- Livability +3.6/5.0
- Schools +2.6/10.0
- Rent growth +2.5/5.0
- Condition / age +2.5/5.0
- Appreciation +0.0/10.0
$4,500,000
🖨 Deal sheet 📄 Offer letter ✓ Due diligence
Multi-family units
County records classify this as Multi-Family (5+ Unit). Listing-text estimate: 34 units. confirmed
5+ unit building — per-unit beds/baths from public records are typically unavailable; the breakdown below (if shown) is an estimate from the listing text.
Listing remarks
Welcome to Gibson Street Apartments, a 34-unit multifamily community located at 1450 East Gibson Street. This income-producing property features 7 solid block buildings, each built on slab foundations and recently updated with new roofs. Most units have been renovated, and every unit includes a refrigerator, microwave, and stove. All utilities are individually metered, including electric and water, and the property is connected to city water and sewer. A common-area laundry room is located on-site, though it is not currently in active use. This is a well-positioned opportunity for investors seeking stable income with strong value-add by activating the laundry room and upgrading the remainin
Key facts
- Slab foundations
- New roofs
- City water and sewer
Tags
Property features AI
Finance
- Other: Property zoned R-4
- Financial info: Gross income reported: $425,678; Estimated annual market income: $506,400; Annual net income: $321,993; Annual expenses: $108,883; Total monthly expenses: $4,200; Tenants responsible for electricity, sewer and water
- HOA & community: No association
Exterior
- Parking: Parking available (details not provided)
- Security: No specific security features listed
- Utilities: Public water; Private sewer; Public utilities available; Tenants pay electricity, sewer and water
- Home design: Residential income property (multi-family 5+); Attached buildings; Single-story buildings; Seven buildings on site; Approximately 3.35 acres
- Construction: Block construction; Shingle roof; Block and slab foundation; Completed condition
- Exterior features: Sidewalks; Paved road access
Interior
- Kitchen: Microwave; Range; Refrigerator
- Bedrooms: 56 total bedrooms (building-wide)
- Flooring: Laminate; Tile
- Bathrooms: Multiple full bathrooms across units (building-wide)
- Heating & cooling: Central heating; Central air conditioning
- Interior features: Ceiling fans; Open floor plan
- Laundry & utility: Common area laundry; Other shared laundry facilities
Neighborhood map
What this means for you Summary
Snapshot
- This is a 34 × 56-bed/38.0-bath units multifamily listed at $4.50M.
Deal economics
- At list price, monthly cash flow is $13k ($154k/yr) — positive. Per door: $376/mo.
- The deal already cash-flows at list — no discount required.
- Meets the 1% rule at list price ($52k rent vs $4.50M).
- Recommended offer: $3.96M (12.0% below list) — sets the bar for market timing.
- Cap rate 9.7% vs local median 3.5% in Arcadia — top-decile yield for the area; either an underpriced asset or a hidden risk that comps aren't pricing in. Stress-test before assuming the spread holds.
Location & tenants
- Location reads 72/100 on livability (#345 in FL) — a middle-class / working-renter tenant base. Strengths: cost of living A+, housing A+, health & safety A+; Watch: crime D, amenities F, commute F.
- Desoto (town): math 31% / reading 32% proficiency, ranked #69 of 73 in FL (top 94%) — families likely to look elsewhere, expect single-tenant / working-renter base with shorter leases; 71% free/reduced lunch — lower-income household profile, screen leases tightly.
- Zoned schools: Nocatee Elementary School (math 28% / reading 24%, grade F, #2,015 of 2,144 statewide, top 94%, 446 students, 84% FRL); Desoto County High School (math 26% / reading 33%, grade F, #447 of 667 statewide, top 68%, 1,244 students, 67% FRL) — zoned schools at 75% FRL track the district average.
- Market conditions: 207 active listings in the ZIP; 71 units permitted in DeSoto County in 2024 (0 in 5+ unit buildings).
Forward outlook
- Local home prices are declining (-3.0%/yr); year-one equity from $31k of loan paydown is wiped out by about $135k of value loss. Plan a longer hold.
- DeSoto County population projected at -10% by 2050 — secular population decline; favor cash flow + early exit over multi-decade hold.
- At projected returns (-3.0% appreciation + 3.0% rent growth), your $1.26M cash investment doubles in ~10 years — after that, you're playing with house money.
Negotiation context
- It's been on market 197 days — a 12% lower offer ($3.96M) is reasonable based on typical stale-listing flexibility.
- Current owner paid $2.50M; list at $4.50M implies a 80% gain — meaningful room to come down on a strong offer.
Risks & watch-outs
- Climate carrying-cost: severe wind risk, 99% chance of damaging wind over 30y; extreme-heat days projected 7→26/yr by 2055 (HVAC capex compounding) — expect insurance premiums to compound above CPI over the hold.
Questions for the listing agent
- It's been on market 197 days. Have you received any prior offers? Is the seller open to a 12% concession, seller financing, or rate buy-down credit?
- Can we see the unit-by-unit rent roll, current vacancy, and any below-market leases? What's the average tenancy length?
- What capital expenditures (roof, boiler, parking lot, exteriors) have been made in the last 5 years, and what's planned in the next 2?
- Why hasn't it sold? Are there any deal-killer items the seller is aware of (foundation, flood, title, zoning, code violations)?
- Is there a deadline driving the sale (1031 exchange, divorce, estate, relocation)? That informs how much negotiation room exists.
- Crime grade is D in this area — have there been break-ins, vandalism, or insurance claims at this property in the last 3 years? What carrier currently insures it and at what premium?
- What's the average days-on-market for RENTAL listings here right now (not sales)? A rising rental-DOM trend means longer vacancies and softer asking-rent achievability than the comps imply.
- What's the recent tenant-quality profile in this submarket — average credit score on applications, eviction rate, late-payment / NSF rate, and stable-employment percentage? A property-management company in the area should have these aggregated.
- How much new apartment / multifamily construction is in the pipeline within 1–3 miles? Heavy new supply (>2% of stock underway) typically softens rents 12–24 months out; light construction supports rent growth.
Investment metrics
- 1% rule
- 1.16% ✓
- Cap rate
- 9.70%
- Cash-on-cash
- 12.18%
- DSCR
- 1.54
- GRM
- 7.2
CMA / ARV
No comps found within radius.
Projected returns pro-forma
-3.0% appreciation · 3.0% rent growth · sell at horizon
- IRR
- 1.8%
- Equity multiple
- 1.07×
- Total profit
- $84,675
- Equity at exit
- $670,965
- IRR
- 11.3%
- Equity multiple
- 1.89×
- Total profit
- $1,119,292
- Equity at exit
- $389,078
Cash invested: $1,260,000 (down + closing). Projections, not guarantees.
Landlord ↔ Tenant lean methodology
- Overall (STATE)
- 87 Strongly Landlord-Friendly
- State Florida
- 87 Strongly Landlord-Friendly · R+3
- County
- — inherits STATE
- City
- — inherits STATE
ZIP-level market 34266
- Home prices YoY
- -6.1%
- Active inventory
- 207
- Price-to-rent
- 244.6×
Monthly cashflow live
- Estimated rent
- $52,136 medium interval (Pro) →
- Mortgage (P&I)
- −$23,598
- Tax from tax record
- −$2,922 /mo · $35,061/yr
- Insurance
- −$1,875
- HOA
- −$0
- Vacancy / Maint / Mgmt
- −$10,949
- Net cashflow
- $12,792
Break-even live
34-unit breakdown (identical units grouped — click to expand)
| Units | Beds | Baths | Est. rent |
|---|---|---|---|
| 34× units | 56 | 38 | $52,122 |
| #1 | 56 | 38 | $1,533 |
| #2 | 56 | 38 | $1,533 |
| #3 | 56 | 38 | $1,533 |
| #4 | 56 | 38 | $1,533 |
| #5 | 56 | 38 | $1,533 |
| #6 | 56 | 38 | $1,533 |
| #7 | 56 | 38 | $1,533 |
| #8 | 56 | 38 | $1,533 |
| #9 | 56 | 38 | $1,533 |
| #10 | 56 | 38 | $1,533 |
| #11 | 56 | 38 | $1,533 |
| #12 | 56 | 38 | $1,533 |
| #13 | 56 | 38 | $1,533 |
| #14 | 56 | 38 | $1,533 |
| #15 | 56 | 38 | $1,533 |
| #16 | 56 | 38 | $1,533 |
| #17 | 56 | 38 | $1,533 |
| #18 | 56 | 38 | $1,533 |
| #19 | 56 | 38 | $1,533 |
| #20 | 56 | 38 | $1,533 |
| #21 | 56 | 38 | $1,533 |
| #22 | 56 | 38 | $1,533 |
| #23 | 56 | 38 | $1,533 |
| #24 | 56 | 38 | $1,533 |
| #25 | 56 | 38 | $1,533 |
| #26 | 56 | 38 | $1,533 |
| #27 | 56 | 38 | $1,533 |
| #28 | 56 | 38 | $1,533 |
| #29 | 56 | 38 | $1,533 |
| #30 | 56 | 38 | $1,533 |
| #31 | 56 | 38 | $1,533 |
| #32 | 56 | 38 | $1,533 |
| #33 | 56 | 38 | $1,533 |
| #34 | 56 | 38 | $1,533 |
| Total (34 units) | $52,136 | ||
UW: 25.0% down · 7.5% · 30yr · 1.5% tax · 5.0% vac · 8.0% maint · 8.0% mgmt
Financing live
Cash to close
- Down payment
- $1,125,000
- Closing costs
- $135,000
- Reserves months
- —
- Total cash needed
- —
Loan-product check · same deal, 3 products live
Conventional
25% down · 7.5% · 30yr
- Down + closing
- —
- Monthly P&I
- —
- Monthly cashflow
- —
- DSCR
- —
- Eligible?
- —
Personal DTI + credit; lowest rate.
DSCR
20% down · 8.5% · 30yr
- Down + closing
- —
- Monthly P&I
- —
- Monthly cashflow
- —
- DSCR
- —
- Eligible?
- —
No personal income docs; deal must DSCR.
Hard money
10% down · 12.0% · 12mo
- Down + closing
- —
- Monthly P&I
- —
- Monthly cashflow
- —
- DSCR
- —
- Eligible?
- —
Short-term bridge; refi at stabilization.
Listing history 19 events
-
2026-06-18days on market $4,500,000 Active 197 DOM
-
2026-06-17days on market $4,500,000 Active 196 DOM
-
2026-06-16days on market $4,500,000 Active 195 DOM
-
2026-06-15days on market $4,500,000 Active 194 DOM
-
2026-06-14days on market $4,500,000 Active 192 DOM
-
2026-06-13days on market $4,500,000 Active 191 DOM
-
2026-06-10days on market $4,500,000 Active 189 DOM
-
2026-06-09days on market $4,500,000 Active 188 DOM
-
2026-06-08days on market $4,500,000 Active 187 DOM
-
2026-06-07pricedays on market $4,500,000 Active 186 DOM
-
2026-06-02days on market $4,600,000 Active 181 DOM
-
2026-06-01days on market $4,600,000 Active 180 DOM
-
2026-05-31days on market $4,600,000 Active 179 DOM
-
2026-05-30days on market $4,600,000 Active 178 DOM
-
2026-05-11price $4,600,000
-
2025-12-03$4,900,000 Active
-
2024-05-13soldstatus $2,500,000
-
2015-09-02soldstatus $530,000
-
1983-03-01soldstatus $56,200
ⓘ Source: listings_history table (triggers on properties + properties_extension) + one-shot
backfill from property_details.listing_events for pre-trigger history.
Tax reassessment forecast FL · Resets to sale price
- Current annual tax
- $35,061 · $2,922/mo
- Projected year-2 tax
- $37,350 · $3,112/mo
- Expected delta
- +$2,289/yr (+$191/mo · 6.5%)
ⓘ Screening estimate from a state-policy table — verify with the county assessor before closing.
Climate risk First Street
- Flood 1/10 Low FEMA zone X (unshaded) · 0% chance over 30 yrs
- Wildfire 3/10 Moderate
- Heat 9/10 Extreme 7 d/yr ≥107°F today · 26 d/yr by 30 yrs out
- Wind 10/10 Extreme 99% chance of damaging wind over 30 yrs
- Air quality 2/10 Low 1 unhealthy d/yr today · 2 by 30 yrs out
Nearby sold comps map
Loading sold comps map…
Walkable amenities ~0.75 mi
Loading nearby amenities…
Taxation est. · year 1
- Rental income
- $625,632
- − Mortgage interest
- −$252,070
- − Property taxes
- −$35,061
- − Insurance
- −$22,500
- − Repairs & maintenance
- −$50,051
- − Management
- −$50,051
- − Depreciation
- −$130,909
- Taxable income
- $84,991
- Est. tax owed @ 24.0%
- −$20,398
- After-tax cash flow
- $133,109/yr
For passive investors: Depreciation is non-cash, so a rental often shows a tax loss while cash-flowing — sheltering income. Rental losses are passive: they offset passive income freely, and up to $25,000/yr can offset ordinary (W-2) income if you actively participate and your MAGI is under $100k (phasing out to $0 by $150k); unused losses carry forward. On sale, claimed depreciation is recaptured at up to 25%, and gains may owe capital-gains tax (a 1031 exchange can defer both). Figures are a year-1 estimate at your 24.0% rate — not tax advice; consult a CPA.
Schools (NCES district)
- District
- Desoto
- NCES district ID
- 1200420
- Math proficiency
- 31% ▼ -9.00%
- Reading proficiency
- 32% ▼ -3.00%
- Median HH income
- $35,136
- Composite
- 26.03/100
- National rank
- #7305
- State rank
- #69 of 73 in FL
Livability — Arcadia
- Score
- 72/100
- State rank
- #345
- US rank
- #5983
Category grades
Schools grade is shown separately in the Schools card above.
Census & demographics
- Census place
- Arcadia, FL
- Population (ZIP)
- 29,065
Population outlook (DeSoto County) Hauer SSP2
- Today (2025)
- 34,958 people
- By 2030
- 34,465 · -1.4%
- By 2040
- 33,137 · -5.2%
- By 2050
- 31,273 · -10.5%
- By 2075
- 23,898 · -31.6%
- By 2100
- 15,517 · -55.6%
Race, ethnicity, and origin ACS 2023
- Neighborhood character
- Diverse neighborhood (Simpson 0.61)
- Race & ethnicity
- White 51% Hispanic / Latino 34% Black 13% Two or more races 11%
- Hispanic origin (detail)
- Mexican 26% Puerto Rican 2% Cuban 2%
- Common ancestry
- Lithuanian 2% Italian 2% Slovak 1%
- Foreign-born
- 15% · Canada
- Languages at home
- 76% English-only · Spanish 22% French/Haitian/Cajun 1%
Political lean MEDSL · DeSoto
- 2024 margin
- Solid R (+42.9) · D 28.2% · R 71.2%
- 2008→2024 swing
- -30.6pp toward R · 2008: -12.3pp · 2024: -42.9pp
- All cycles
- 2024: R+42.9 2020: R+32.0 2016: R+27.7 2012: R+14.3 2008: R+12.3
Not yet ingested
- Civics
- —
Market trends
- HPI YoY
- ▼ -26.01%
- Current HPI
- 403.1509
- Rent YoY
- —
- Metro
- —
- State GDP YoY
- ▲ 3.28%
- F500 in state
- 36
Industry mix (Fortune 500 HQ in FL)
| Industry | F500 HQs | Revenue |
|---|---|---|
| Industrial Technology | 2 | $29B |
|
||
| Insurance | 2 | $17B |
|
||
| Retail | 1 | $60B |
|
||
| Technology Distribution | 1 | $58B |
|
||
| Homebuilding | 1 | $35B |
|
||
| Technology Manufacturing | 1 | $35B |
|
||
Price history
+8085.1% since first listed5 events — show timeline
- 2026-05-11 Price Changed $4,600,000 Stellar MLS as Distributed by MLS Grid
- 2025-12-03 Listed $4,900,000 Stellar MLS as Distributed by MLS Grid
- 2024-05-13 Sold (Public Records) $2,500,000 Public Records
- 2015-09-02 Sold (Public Records) $530,000 Public Records
- 1983-03-01 Sold (Public Records) $56,200 Public Records
Property tax history
+1.9%/yrLatest (2025): $35,061 · +18.2% YoY. Source: county tax records.
Cash-flow waterfall
monthlySold comps — $/sqft
last 12 mo · ≤1 miLoading sold comps…