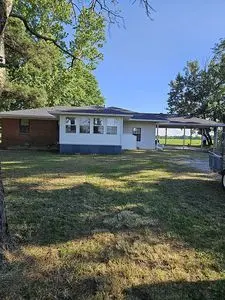
10955 U.S. 79 · Moro, AR
Flood risk 1/10 · Minimal
- FEMA flood zone
- A
- Chance of flooding over 30 yrs
- 0.0%
- Est. flood insurance / yr
- $1,009 – $1,996
Fire risk 1/10 · Minimal
- Est. fire insurance / yr
- $1,499 – $2,785
Heat risk 5/10 · Moderate
- Hot days now (above 109°F)
- 7 days/yr
- Hot days in 30 yrs
- 20 days/yr
Wind risk 6/10 · Moderate
- Chance of severe wind over 30 yrs
- 27.0%
Air-quality risk 1/10 · Minimal
- Unhealthy air days now
- 0 days/yr
- Unhealthy air days in 30 yrs
- 0 days/yr
Risk factors via First Street. Map © Google.
Why this score? — see what drove the B- grade
The composite is a weighted blend of 9 inputs, each scored 0–100. Each bar is that input's sub-score; the figure is the points it added to the 100-point composite (weight × sub-score).
- Cash flow +30.0/30.0
- DSCR +10.0/10.0
- 1% rule +9.8/10.0
- ARV discount +7.5/15.0
- Appreciation +4.2/10.0
- Livability +2.9/5.0
- Rent growth +2.5/5.0
- Condition / age +1.0/5.0
- Schools +0.6/10.0
$78,000
🖨 Deal sheet 📄 Offer letter ✓ Due diligence
Listing remarks
New roof . Has Sun Room. Extra room down Needs new air unit. Heat works This is a Owner sell not using Realtor!
Key facts
- Sun room
- Extra room
- Built 1992
Tags
Neighborhood map
What this means for you Summary
Snapshot
- This is a 3-bed/1.0-bath other listed at $78k. Condition is rated poor.
Deal economics
- At list price, monthly cash flow is $245 ($3k/yr) — positive.
- The deal already cash-flows at list — no discount required.
- Meets the 1% rule at list price ($1k rent vs $78k).
- Recommended offer: $76k (3.0% below list) — sets the bar for market timing.
Location & tenants
- Location reads 57/100 on livability (#338 in AR) — a working-class tenant base; expect higher turnover. Strengths: cost of living A+, housing A+; Watch: employment D, schools F, crime F.
- Lee County School District (town): math 8% / reading 9% proficiency, ranked #235 of 238 in AR (top 99%) — low school quality limits family demand, transient renter base, plan for 1-2y turnover; 96% free/reduced lunch — lower-income household profile, screen leases tightly.
- Market conditions: 5 active listings in the ZIP; 1 units permitted in Lee County in 2024 (0 in 5+ unit buildings).
Forward outlook
- Local home prices are declining (-1.5%/yr); year-one equity from $539 of loan paydown is wiped out by about $1k of value loss. Plan a longer hold.
- Lee County population projected at -22% by 2050 — secular population decline; favor cash flow + early exit over multi-decade hold.
- At projected returns (-1.5% appreciation + 3.0% rent growth), your $22k cash investment doubles in ~7 years — after that, you're playing with house money.
Negotiation context
- It's been on market 35 days — a 3% lower offer ($76k) is reasonable based on typical stale-listing flexibility.
Risks & watch-outs
- Watch-outs: flood insurance adds $125/mo.
- Climate carrying-cost: in FEMA flood zone A (mandatory federal flood insurance); major wind risk, 27% chance of damaging wind over 30y; extreme-heat days projected 7→20/yr by 2055 (HVAC capex compounding) — expect insurance premiums to compound above CPI over the hold.
Questions for the listing agent
- It's been on market 35 days. Have you received any prior offers? Is the seller open to a 3% concession, seller financing, or rate buy-down credit?
- Have any recent inspections been done? Can we get a copy of the seller's disclosures and any deferred-maintenance estimates?
- What's the actual annual flood-insurance premium (NFIP or private), and is the property in a SFHA with mandatory coverage?
- Is there a deadline driving the sale (1031 exchange, divorce, estate, relocation)? That informs how much negotiation room exists.
- Schools are F-rated, which usually means shorter tenancies and higher turnover. Who's the typical renter profile here, and what's been the actual vacancy rate?
- Crime grade is F in this area — have there been break-ins, vandalism, or insurance claims at this property in the last 3 years? What carrier currently insures it and at what premium?
- What's the average days-on-market for RENTAL listings here right now (not sales)? A rising rental-DOM trend means longer vacancies and softer asking-rent achievability than the comps imply.
- What's the recent tenant-quality profile in this submarket — average credit score on applications, eviction rate, late-payment / NSF rate, and stable-employment percentage? A property-management company in the area should have these aggregated.
- How much new for-sale + rental construction is in the pipeline within 1–3 miles? Heavy new supply typically softens prices + rents 12–24 months out; constrained supply supports both.
Investment metrics
- 1% rule
- 1.48% ✓
- Cap rate
- 11.99%
- Cash-on-cash
- 20.34%
- DSCR
- 1.91
- GRM
- 5.6
CMA / ARV
No comps found within radius.
Projected returns pro-forma
-1.52% appreciation · 3.0% rent growth · sell at horizon
- IRR
- 8.5%
- Equity multiple
- 1.37×
- Total profit
- $8,009
- Equity at exit
- $16,896
- IRR
- 15.5%
- Equity multiple
- 2.46×
- Total profit
- $31,974
- Equity at exit
- $16,144
Cash invested: $21,840 (down + closing). Projections, not guarantees.
Landlord ↔ Tenant lean methodology
- Overall (STATE)
- 92 Strongly Landlord-Friendly
- State Arkansas
- 92 Strongly Landlord-Friendly · R+14
- County
- — inherits STATE
- City
- — inherits STATE
ZIP-level market 72368
- Home prices YoY
- -1.6%
- Active inventory
- 5
- Price-to-rent
- 5.6×
Monthly cashflow live
- Estimated rent
- $1,151 medium interval (Pro) →
- Mortgage (P&I)
- −$409
- Tax est. 1.5%
- −$98 /mo · $1,170/yr
- Insurance
- −$32
- Flood insurance flood zone
- −$125 /mo · $1,502/yr
- HOA
- −$0
- Vacancy / Maint / Mgmt
- −$242
- Net cashflow
- $245
Break-even live
UW: 25.0% down · 7.5% · 30yr · 1.5% tax · 5.0% vac · 8.0% maint · 8.0% mgmt
Financing live
Cash to close
- Down payment
- $19,500
- Closing costs
- $2,340
- Reserves months
- —
- Total cash needed
- —
Loan-product check · same deal, 3 products live
Conventional
25% down · 7.5% · 30yr
- Down + closing
- —
- Monthly P&I
- —
- Monthly cashflow
- —
- DSCR
- —
- Eligible?
- —
Personal DTI + credit; lowest rate.
DSCR
20% down · 8.5% · 30yr
- Down + closing
- —
- Monthly P&I
- —
- Monthly cashflow
- —
- DSCR
- —
- Eligible?
- —
No personal income docs; deal must DSCR.
Hard money
10% down · 12.0% · 12mo
- Down + closing
- —
- Monthly P&I
- —
- Monthly cashflow
- —
- DSCR
- —
- Eligible?
- —
Short-term bridge; refi at stabilization.
Listing history 17 events
-
2026-06-19days on market $78,000 Active 35 DOM
-
2026-06-18days on market $78,000 Active 34 DOM
-
2026-06-17days on market $78,000 Active 33 DOM
-
2026-06-16days on market $78,000 Active 32 DOM
-
2026-06-15days on market $78,000 Active 31 DOM
-
2026-06-14days on market $78,000 Active 29 DOM
-
2026-06-12days on market $78,000 Active 28 DOM
-
2026-06-09days on market $78,000 Active 25 DOM
-
2026-06-08days on market $78,000 Active 24 DOM
-
2026-06-07days on market $78,000 Active 23 DOM
-
2026-06-07days on market $78,000 Active 22 DOM
-
2026-06-04days on market $78,000 Active 19 DOM
-
2026-06-02days on market $78,000 Active 18 DOM
-
2026-06-01days on market $78,000 Active 17 DOM
-
2026-05-31days on market $78,000 Active 16 DOM
-
2026-05-31days on market $78,000 Active 15 DOM
-
2026-05-16$78,000 Active 113-char remark
ⓘ Source: listings_history table (triggers on properties + properties_extension) + one-shot
backfill from property_details.listing_events for pre-trigger history.
Climate risk First Street
- Flood 1/10 Low FEMA zone A · 0% chance over 30 yrs
- Wildfire 1/10 Low
- Heat 5/10 Major 7 d/yr ≥109°F today · 20 d/yr by 30 yrs out
- Wind 6/10 Major 27% chance of damaging wind over 30 yrs
- Air quality 1/10 Low 0 unhealthy d/yr today · 0 by 30 yrs out
Nearby sold comps map
Loading sold comps map…
Walkable amenities ~0.75 mi
Loading nearby amenities…
Taxation est. · year 1
- Rental income
- $13,811
- − Mortgage interest
- −$4,369
- − Property taxes
- −$1,170
- − Insurance
- −$1,892
- − Repairs & maintenance
- −$1,105
- − Management
- −$1,105
- − Depreciation
- −$2,269
- Taxable income
- $1,901
- Est. tax owed @ 24.0%
- −$456
- After-tax cash flow
- $2,484/yr
For passive investors: Depreciation is non-cash, so a rental often shows a tax loss while cash-flowing — sheltering income. Rental losses are passive: they offset passive income freely, and up to $25,000/yr can offset ordinary (W-2) income if you actively participate and your MAGI is under $100k (phasing out to $0 by $150k); unused losses carry forward. On sale, claimed depreciation is recaptured at up to 25%, and gains may owe capital-gains tax (a 1031 exchange can defer both). Figures are a year-1 estimate at your 24.0% rate — not tax advice; consult a CPA.
Condition & rehab AI · 2 photos
This property requires extensive repairs and improvements, including a new roof, exterior painting, HVAC replacement, landscaping, and perimeter fencing, to become move-in ready and significantly increase its value.
Repairs flagged
- Major roof — Aerial view suggests a lack of proper roof coverage.
- Major exterior walls — Weathered appearance suggests significant damage or wear.
- Major HVAC system — Listing mentions a need for a new air unit, indicating a major issue with the current system.
- Major landscaping — Sparse and minimal landscaping suggests a need for significant improvement.
- Major perimeter fencing — No fencing is visible, indicating a need for perimeter security and property definition.
Value-add opportunities
- Both new roof — A new roof would significantly improve the home's appearance and functionality.
- Both exterior painting — Painting the exterior walls would enhance curb appeal and protect the structure.
- Both HVAC replacement — Replacing the HVAC system would improve comfort and energy efficiency.
- Both landscaping improvements — Enhancing the landscaping would increase curb appeal and property value.
- Both perimeter fencing — Installing perimeter fencing would improve security and property definition, enhancing both resale and rental value.
Renovation cost estimate screening
| Repair item | Severity | Est. cost |
|---|---|---|
| roof · Aerial view suggests a lack of proper roof coverage. | Major | $15,000–50,000 |
| exterior walls · Weathered appearance suggests significant damage or wear. | Major | $15,000–50,000 |
| HVAC system · Listing mentions a need for a new air unit, indicating a major issue with the current system. | Major | $15,000–50,000 |
| landscaping · Sparse and minimal landscaping suggests a need for significant improvement. | Major | $15,000–50,000 |
| perimeter fencing · No fencing is visible, indicating a need for perimeter security and property definition. | Major | $15,000–50,000 |
| Total estimated repair cost · 5 items | $75,000–250,000 |
Value-add ROI direction
- Both new roof — A new roof would significantly improve the home's appearance and functionality. ↑
- Both exterior painting — Painting the exterior walls would enhance curb appeal and protect the structure. ↑
- Both HVAC replacement — Replacing the HVAC system would improve comfort and energy efficiency. ↑
- Both landscaping improvements — Enhancing the landscaping would increase curb appeal and property value. ↑
- Both perimeter fencing — Installing perimeter fencing would improve security and property definition, enhancing both resale and rental value. ↑
ⓘ Cost ranges are severity-bucket heuristics (US national rule-of-thumb). Get contractor quotes + a written scope before underwriting a rehab budget.
Schools (NCES district)
- District
- Lee County School District
- NCES district ID
- 0509360
- Math proficiency
- 8% ▼ -6.00%
- Reading proficiency
- 9% ▼ -5.00%
- Median HH income
- $28,151
- Composite
- 6.29/100
- National rank
- #10002
- State rank
- #235 of 238 in AR
Livability — Moro
- Score
- 57/100
- State rank
- #338
- US rank
- #21512
Category grades
Schools grade is shown separately in the Schools card above.
Census & demographics
- Population (ZIP)
- 1,175
Population outlook (Lee County) Hauer SSP2
- Today (2025)
- 8,633 people
- By 2030
- 8,163 · -5.4%
- By 2040
- 7,360 · -14.7%
- By 2050
- 6,711 · -22.3%
- By 2075
- 5,485 · -36.5%
- By 2100
- 4,611 · -46.6%
Race, ethnicity, and origin ACS 2023
- Neighborhood character
- Predominantly White (76%)
- Race & ethnicity
- White 76% Black 14% Hispanic / Latino 7% Two or more races 2%
- Hispanic origin (detail)
- Mexican 7%
- Common ancestry
- Slovak 2% Iranian 1% Italian 1%
- Foreign-born
- 0%
- Languages at home
- 98% English-only · Spanish 2%
Political lean MEDSL · Lee
- 2024 margin
- Toss-up / Even · D 50.4% · R 46.9% · Other 2.7%
- 2008→2024 swing
- -18.0pp toward R · 2008: 21.5pp · 2024: 3.5pp
- All cycles
- 2024: D+3.5 2020: D+4.8 2016: D+16.9 2012: D+24.2 2008: D+21.5
Not yet ingested
- Civics
- —
Market trends
- HPI YoY
- ▼ -1.52%
- Current HPI
- 94.9789
- Rent YoY
- —
- Metro
- —
- State GDP YoY
- ▲ 3.80%
- F500 in state
- 10
Industry mix (Fortune 500 HQ in AR)
| Industry | F500 HQs | Revenue |
|---|---|---|
| Retail | 1 | $681B |
|
||
| Food / Agriculture | 1 | $53B |
|
||
| Retail / Energy | 1 | $22B |
|
||
| Transportation / Logistics | 1 | $12B |
|
||
| Energy | 1 | $4B |
|
||
Price history
1 event — show timeline
- 2026-05-16 Listed $78,000 FSBO.com
Cash-flow waterfall
monthlySold comps — $/sqft
last 12 mo · ≤1 miLoading sold comps…