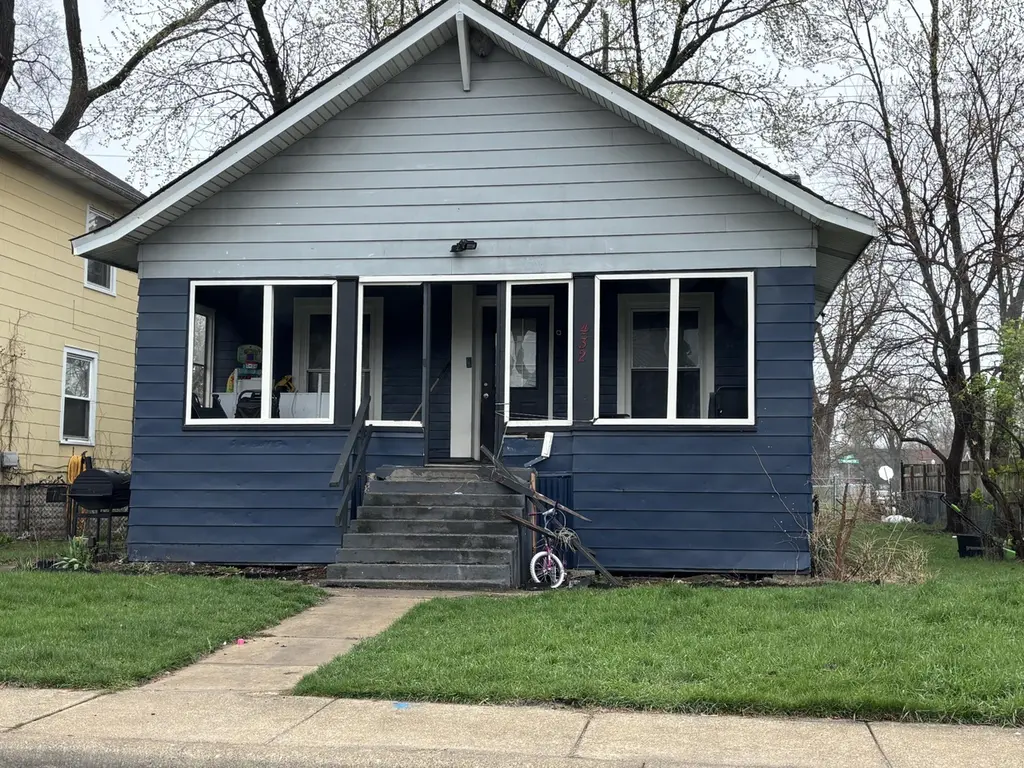
432 Detroit St · Hammond, IN
Flood risk 4/10 · Minor
- FEMA flood zone
- X (unshaded)
- Chance of flooding over 30 yrs
- 0.21%
- Est. flood insurance / yr
- $473 – $860
Fire risk 1/10 · Minimal
- Est. fire insurance / yr
- $717 – $1,331
Heat risk 3/10 · Minor
- Hot days now (above 102°F)
- 7 days/yr
- Hot days in 30 yrs
- 15 days/yr
Wind risk 2/10 · Minimal
- Chance of severe wind over 30 yrs
- 1.0%
Air-quality risk 4/10 · Minor
- Unhealthy air days now
- 5 days/yr
- Unhealthy air days in 30 yrs
- 6 days/yr
Risk factors via First Street. Map © Google.
Why this score? — see what drove the A grade
The composite is a weighted blend of 9 inputs, each scored 0–100. Each bar is that input's sub-score; the figure is the points it added to the 100-point composite (weight × sub-score).
- Cash flow +30.0/30.0
- ARV discount +15.0/15.0
- 1% rule +10.0/10.0
- DSCR +10.0/10.0
- Appreciation +10.0/10.0
- Rent growth +4.4/5.0
- Livability +3.5/5.0
- Condition / age +2.5/5.0
- Schools +1.1/10.0
$102,000
🖨 Deal sheet 📄 Offer letter ✓ Due diligence
Listing remarks MLS
THERE IS ALOT OF ROMM FOR EVERYONE IN THE FAMILY IN THIS 4 BEDROOM, 2.5 BATH CAPE COD HOME WITH FULL BASEMENT, FIREPLACE AND FENCED YARD FOR FAMILY FUN. CALL TODAY TO SEE THIS HOME AND FALL IN LOVE.
Key facts
- 6,011 sq ft lot
- Built 1915
- Listed 69 days
Property features AI
Exterior
- Parking: No parking features listed
- Utilities: Electricity connected; Public water; Public sewer; Natural gas connected
- Home design: One and one-half story home; Built in 1915; Property listed as fixer
- Construction: Aluminum siding construction; Full basement
- Exterior features: Neighborhood view; Front porch; Fenced yard; Aluminum siding
Interior
- Kitchen: No appliances listed
- Bedrooms: Primary bedroom; Bedroom 2; Bedroom 3; Office (can be used as a bedroom/bonus room)
- Bathrooms: 2 full bathrooms; 1 half bathroom
- Heating & cooling: Forced air heating (natural gas); No cooling listed
- Interior features: Has fireplace in the great room and living room; Other interior features
- Laundry & utility: Basement (full)
Neighborhood map
What this means for you Summary
Snapshot
- This is a 4-bed/2.5-bath single-family listed at $102k.
Deal economics
- At list price, monthly cash flow is $867 ($10k/yr) — positive.
- The deal already cash-flows at list — no discount required.
- Meets the 1% rule at list price ($2k rent vs $102k).
- Recommended offer: $96k (6.0% below list) — sets the bar for market timing.
- Cap rate 16.5% vs local median 5.8% in Hammond — top-decile yield for the area; either an underpriced asset or a hidden risk that comps aren't pricing in. Stress-test before assuming the spread holds.
Location & tenants
- Location reads 70/100 on livability (#143 in IN) — a middle-class / working-renter tenant base. Strengths: cost of living A+, housing A+, commute A; Watch: health & safety D+, employment D, schools F.
- School City Of Hammond (suburban): math 8% / reading 18% proficiency, ranked #289 of 301 in IN (top 96%) — low school quality limits family demand, transient renter base, plan for 1-2y turnover; 74% free/reduced lunch — lower-income household profile, screen leases tightly.
- Market conditions: Rents rising fast (+7.6%/yr); 52 active listings in the ZIP; 5 comparable units currently listed for rent nearby; rentals leasing fast (median 2d on market — plan ~1-2 weeks tenant-placement turnaround); lower-income renter base — watch delinquency; 1,642 units permitted in Lake County in 2024 (14 in 5+ unit buildings).
- At $1,936/mo this rent would consume 63% of the median local household income ($37k/yr) (locally 900% of renters already pay >50% of income on rent) — very limited rent-growth headroom before tenants either downsize or default.
Forward outlook
- In year one you build about $11k of equity ($705 loan paydown + $10k appreciation (10.0% local appreciation)).
- Lake County population projected to shrink 7% by 2050 — rents likely to lag national; underwrite the cash flow, not the appreciation.
- At projected returns (10.0% appreciation + 7.6% rent growth), your $29k cash investment doubles in ~2 years — after that, you're playing with house money.
- By year 4, paydown + projected appreciation supports a ~$39k cash-out refi (75% LTV) — recoverable capital for the next deal without selling this one.
Negotiation context
- It's been on market 69 days — a 6% lower offer ($96k) is reasonable based on typical stale-listing flexibility.
- 4 sale attempts since 25y ago with the ask held roughly flat each time — persistent listings suggest the price (not the market) is what's stuck; bring a comps-based counter.
- Current owner paid $17k; list at $102k implies a 500% gain — meaningful room to come down on a strong offer.
Risks & watch-outs
- Watch-outs: built in 1915 — expect roof / HVAC / electrical / plumbing capex.
Questions for the listing agent
- It's been on market 69 days. Have you received any prior offers? Is the seller open to a 6% concession, seller financing, or rate buy-down credit?
- Built in 1915 — when were the roof, HVAC, electrical panel, plumbing, and water heater last replaced?
- Why hasn't it sold? Are there any deal-killer items the seller is aware of (foundation, flood, title, zoning, code violations)?
- Is there a deadline driving the sale (1031 exchange, divorce, estate, relocation)? That informs how much negotiation room exists.
- Schools are F-rated, which usually means shorter tenancies and higher turnover. Who's the typical renter profile here, and what's been the actual vacancy rate?
- Crime grade is F in this area — have there been break-ins, vandalism, or insurance claims at this property in the last 3 years? What carrier currently insures it and at what premium?
- What's the average days-on-market for RENTAL listings here right now (not sales)? A rising rental-DOM trend means longer vacancies and softer asking-rent achievability than the comps imply.
- What's the recent tenant-quality profile in this submarket — average credit score on applications, eviction rate, late-payment / NSF rate, and stable-employment percentage? A property-management company in the area should have these aggregated.
- How much new for-sale + rental construction is in the pipeline within 1–3 miles? Heavy new supply typically softens prices + rents 12–24 months out; constrained supply supports both.
Investment metrics
- 1% rule
- 1.90% ✓
- Cap rate
- 16.49%
- Cash-on-cash
- 36.43%
- DSCR
- 2.62
- GRM
- 4.4
CMA / ARV
- ARV (on-the-fly)
- $182,628
- Comps found
- 12
Show comp detail 12 sales within ~0.75 mi
| Address | Dist | Beds/Ba | Sqft | Sold | Price | $/sf | Match |
|---|---|---|---|---|---|---|---|
| 42 Detroit St | 0.33mi | 3/1.5 (-1) | 1,724 (+8%) | 2mo | $103,000 | $60 | 61 |
| 6621 Monroe Ave | 0.74mi | 4/2.0 | 1,589 (-1%) | 2mo | $223,400 | $141 | 61 |
| 922 Carroll St | 0.75mi | 4/2.0 | 1,601 (-0%) | 6mo | $215,000 | $134 | 58 |
| 106 Forestdale Pkwy | 0.57mi | 4/3.0 | 1,519 (-5%) | 6mo | $126,500 | $83 | 57 |
| 106 Elizabeth St | 0.58mi | 3/1.5 (-1) | 1,507 (-6%) | 7mo | $172,250 | $114 | 48 |
| 122 Elizabeth St | 0.62mi | 3/1.0 (-1) | 1,686 (+5%) | 5mo | $164,000 | $97 | 47 |
| 5736 Calumet Ave | 0.58mi | 4/2.0 | 1,770 (+10%) | 8mo | $86,000 | $49 | 47 |
| 1037 Ames St | 0.74mi | 3/2.0 (-1) | 1,679 (+5%) | 5mo | $194,000 | $116 | 46 |
| 4 Warren St | 0.55mi | 4/1.0 | 1,775 (+11%) | 7mo | $145,000 | $82 | 44 |
| 6360 Hohman Ave | 0.49mi | 3/1.5 (-1) | 1,833 (+14%) | 1mo | $160,000 | $87 | 43 |
| 244 Condit St | 0.68mi | 3/2.0 (-1) | 1,397 (-13%) | 1mo | $293,500 | $210 | 39 |
| 903 Bauer St | 0.69mi | 3/1.5 (-1) | 1,472 (-8%) | 9mo | $198,000 | $135 | 38 |
Match score weights: distance 35% · size 25% · config 20% · recency 20%. Top-matched comps best support the ARV.
Projected returns pro-forma
10.0% appreciation · 7.61% rent growth · sell at horizon
- IRR
- 55.3%
- Equity multiple
- 5.21×
- Total profit
- $120,176
- Equity at exit
- $91,890
- IRR
- 50.7%
- Equity multiple
- 12.67×
- Total profit
- $333,400
- Equity at exit
- $198,164
Cash invested: $28,560 (down + closing). Projections, not guarantees.
Landlord ↔ Tenant lean methodology
- Overall (STATE)
- 90 Strongly Landlord-Friendly
- State Indiana
- 90 Strongly Landlord-Friendly · R+11
- County
- — inherits STATE
- City
- — inherits STATE
ZIP-level market 46320
- Home prices YoY
- 5.0%
- Rents YoY
- 7.6%
- Active inventory
- 52
- Price-to-rent
- 4.4×
Monthly cashflow live
- Estimated rent
- $1,936 high interval (Pro) →
- Mortgage (P&I)
- −$535
- Tax from tax record
- −$85 /mo · $1,015/yr
- Insurance
- −$42
- HOA
- −$0
- Vacancy / Maint / Mgmt
- −$406
- Net cashflow
- $867
Break-even live
UW: 25.0% down · 7.5% · 30yr · 1.5% tax · 5.0% vac · 8.0% maint · 8.0% mgmt
Financing live
Cash to close
- Down payment
- $25,500
- Closing costs
- $3,060
- Reserves months
- —
- Total cash needed
- —
Loan-product check · same deal, 3 products live
Conventional
25% down · 7.5% · 30yr
- Down + closing
- —
- Monthly P&I
- —
- Monthly cashflow
- —
- DSCR
- —
- Eligible?
- —
Personal DTI + credit; lowest rate.
DSCR
20% down · 8.5% · 30yr
- Down + closing
- —
- Monthly P&I
- —
- Monthly cashflow
- —
- DSCR
- —
- Eligible?
- —
No personal income docs; deal must DSCR.
Hard money
10% down · 12.0% · 12mo
- Down + closing
- —
- Monthly P&I
- —
- Monthly cashflow
- —
- DSCR
- —
- Eligible?
- —
Short-term bridge; refi at stabilization.
Rent comps 5 comps
| Address | Beds | Baths | Sqft | Rent | $/sqft | DOM | Units | Dist |
|---|---|---|---|---|---|---|---|---|
| 3 Waltham St Hammond, IN | 3.0 | 1.0 | 1200 | $1,095 | $0.91 | 24d | 1 | 0.47mi |
| 34 Elizabeth St Calumet City, IL | 3.0 | 1.0 | 1246 | $2,400 | $1.93 | 1d | 1 | 0.54mi |
| 617 Kane St Hammond, IN | 4.0 | 2.0 | 2146 | $2,300 | $1.07 | 1d | 1 | 0.89mi |
| 252 Lawndale St Hammond, IN | 4.0 | 3.0 | 2016 | $2,600 | $1.29 | 1d | 1 | 1.10mi |
| 1539 Wentworth Ave Unit 3W Calumet City, IL | 3.0 | 1.0 | 1100 | $1,700 | $1.55 | 12d | 1 | 1.17mi |
Listing history 18 events
-
2026-06-18days on market $102,000 Active 69 DOM
-
2026-06-17days on market $102,000 Active 68 DOM
-
2026-06-16days on market $102,000 Active 67 DOM
-
2026-06-15days on market $102,000 Active 66 DOM
-
2026-06-13days on market $102,000 Active 64 DOM
-
2026-06-09days on market $102,000 Active 60 DOM
-
2026-06-08days on market $102,000 Active 59 DOM
-
2026-06-07days on market $102,000 Active 58 DOM
-
2026-06-04days on market $102,000 Active 55 DOM
-
2026-06-03days on market $102,000 Active 54 DOM
-
2026-06-02days on market $102,000 Active 53 DOM
-
2026-06-01days on market $102,000 Active 52 DOM
-
2026-05-31days on market $102,000 Active 51 DOM
-
2026-04-10$102,000 Active
-
2013-01-25soldstatus $17,000 198-char remark
Show marketing remark (198 chars)
THERE IS ALOT OF ROMM FOR EVERYONE IN THE FAMILY IN THIS 4 BEDROOM, 2.5 BATH CAPE COD HOME WITH FULL BASEMENT, FIREPLACE AND FENCED YARD FOR FAMILY FUN. CALL TODAY TO SEE THIS HOME AND FALL IN LOVE.
-
2012-12-10$17,500 198-char remark
Show marketing remark (198 chars)
THERE IS ALOT OF ROMM FOR EVERYONE IN THE FAMILY IN THIS 4 BEDROOM, 2.5 BATH CAPE COD HOME WITH FULL BASEMENT, FIREPLACE AND FENCED YARD FOR FAMILY FUN. CALL TODAY TO SEE THIS HOME AND FALL IN LOVE.
-
2007-05-07$49,900 199-char remark
Show marketing remark (199 chars)
CORPORATE FORECLOSURE, AS IS CONDITION. ALL OFFERS MUST HAVE PROOF OF FUNDS AND EARNEST MONEY PAYABLE TO LISTING OFFICE. FAX ALL OFFERS TO LISTING OFFICE. SELLER WILL MAKE NO REPAIRS OR IMPROVEMENTS.
-
2001-07-12$65,900
ⓘ Source: listings_history table (triggers on properties + properties_extension) + one-shot
backfill from property_details.listing_events for pre-trigger history.
Tax reassessment forecast IN · Partial reset (capped growth)
- Current annual tax
- $1,015 · $85/mo
- Projected year-2 tax
- $1,015 · $85/mo
- Expected delta
- $0/yr ($0/mo · 0.0%)
ⓘ Screening estimate from a state-policy table — verify with the county assessor before closing.
Climate risk First Street
- Flood 4/10 Moderate FEMA zone X (unshaded) · 21% chance over 30 yrs
- Wildfire 1/10 Low
- Heat 3/10 Moderate 7 d/yr ≥102°F today · 15 d/yr by 30 yrs out
- Wind 2/10 Low 100% chance of damaging wind over 30 yrs
- Air quality 4/10 Moderate 5 unhealthy d/yr today · 6 by 30 yrs out
Nearby sold comps map
Loading sold comps map…
Walkable amenities ~0.75 mi
Loading nearby amenities…
Taxation est. · year 1
- Rental income
- $23,227
- − Mortgage interest
- −$5,714
- − Property taxes
- −$1,015
- − Insurance
- −$510
- − Repairs & maintenance
- −$1,858
- − Management
- −$1,858
- − Depreciation
- −$2,967
- Taxable income
- $9,305
- Est. tax owed @ 24.0%
- −$2,233
- After-tax cash flow
- $8,172/yr
For passive investors: Depreciation is non-cash, so a rental often shows a tax loss while cash-flowing — sheltering income. Rental losses are passive: they offset passive income freely, and up to $25,000/yr can offset ordinary (W-2) income if you actively participate and your MAGI is under $100k (phasing out to $0 by $150k); unused losses carry forward. On sale, claimed depreciation is recaptured at up to 25%, and gains may owe capital-gains tax (a 1031 exchange can defer both). Figures are a year-1 estimate at your 24.0% rate — not tax advice; consult a CPA.
Schools (NCES district)
- District
- School City Of Hammond
- NCES district ID
- 1804320
- Math proficiency
- 8% ▼ -18.00%
- Reading proficiency
- 18% ▼ -15.00%
- Median HH income
- $39,970
- Composite
- 11.11/100
- National rank
- #9730
- State rank
- #289 of 301 in IN
Livability — Hammond
- Score
- 70/100
- State rank
- #143
- US rank
- #7343
Category grades
Schools grade is shown separately in the Schools card above.
Census & demographics
- Census place
- Hammond, IN
- County
- Lake County · 422,878 people
- City population
- 58,809
- Metro
- Chicago-Naperville-Elgin, IL-IN-WI
- Population (ZIP)
- 14,353
- Household income
- $37,158
- Rent vs Own
- Severe rent burden
- 900.0
Population outlook (Lake County) Hauer SSP2
- Today (2025)
- 484,026 people
- By 2030
- 478,091 · -1.2%
- By 2040
- 462,974 · -4.3%
- By 2050
- 449,894 · -7.1%
- By 2075
- 436,169 · -9.9%
- By 2100
- 426,607 · -11.9%
Race, ethnicity, and origin ACS 2023
- Neighborhood character
- Diverse neighborhood (Simpson 0.64)
- Race & ethnicity
- Black 44% Hispanic / Latino 39% White 14% Two or more races 12% Asian 1%
- Hispanic origin (detail)
- Mexican 31% Puerto Rican 4%
- Common ancestry
- Romanian 2% Lithuanian 1%
- Foreign-born
- 14% · Canada
- Languages at home
- 68% English-only · Spanish 31%
Political lean MEDSL · Lake
- 2024 margin
- Lean D (+5.6) · D 52.1% · R 46.5% · Other 1.5%
- 2008→2024 swing
- -28.6pp toward R · 2008: 34.3pp · 2024: 5.6pp
- All cycles
- 2024: D+5.6 2020: D+15.1 2016: D+20.6 2012: D+31.0 2008: D+34.3
Not yet ingested
- Civics
- —
Market trends
- HPI YoY
- ▲ 13.81%
- Current HPI
- 288.1513
- Rent YoY
- ▲ 7.61%
- Metro
- Chicago-Naperville-Elgin, IL-IN-WI
- State GDP YoY
- ▲ 2.90%
- F500 in state
- 18
Industry mix (Fortune 500 HQ in IN)
| Industry | F500 HQs | Revenue |
|---|---|---|
| Industrial Machinery | 2 | $37B |
|
||
| Healthcare | 1 | $177B |
|
||
| Pharmaceuticals | 1 | $45B |
|
||
| Metals / Steel | 1 | $18B |
|
||
| Agriculture | 1 | $17B |
|
||
| Packaging | 1 | $12B |
|
||
Price history
+54.8% since first listed5 events — show timeline
- 2026-04-10 Listed $102,000 NIRA MLS as Distributed by MLS Grid
- 2013-01-25 Sold (MLS) $17,000 NIRA MLS as Distributed by MLS Grid
- 2012-12-10 Listed $17,500 NIRA MLS as Distributed by MLS Grid
- 2007-05-07 Listed $49,900 NIRA MLS as Distributed by MLS Grid
- 2001-07-12 Listed $65,900 NIRA MLS as Distributed by MLS Grid
Property tax history
+8.2%/yrLatest (2024): $1,015 · +1.7% YoY. Source: county tax records.
Cash-flow waterfall
monthlySold comps — $/sqft
last 12 mo · ≤1 miLoading sold comps…