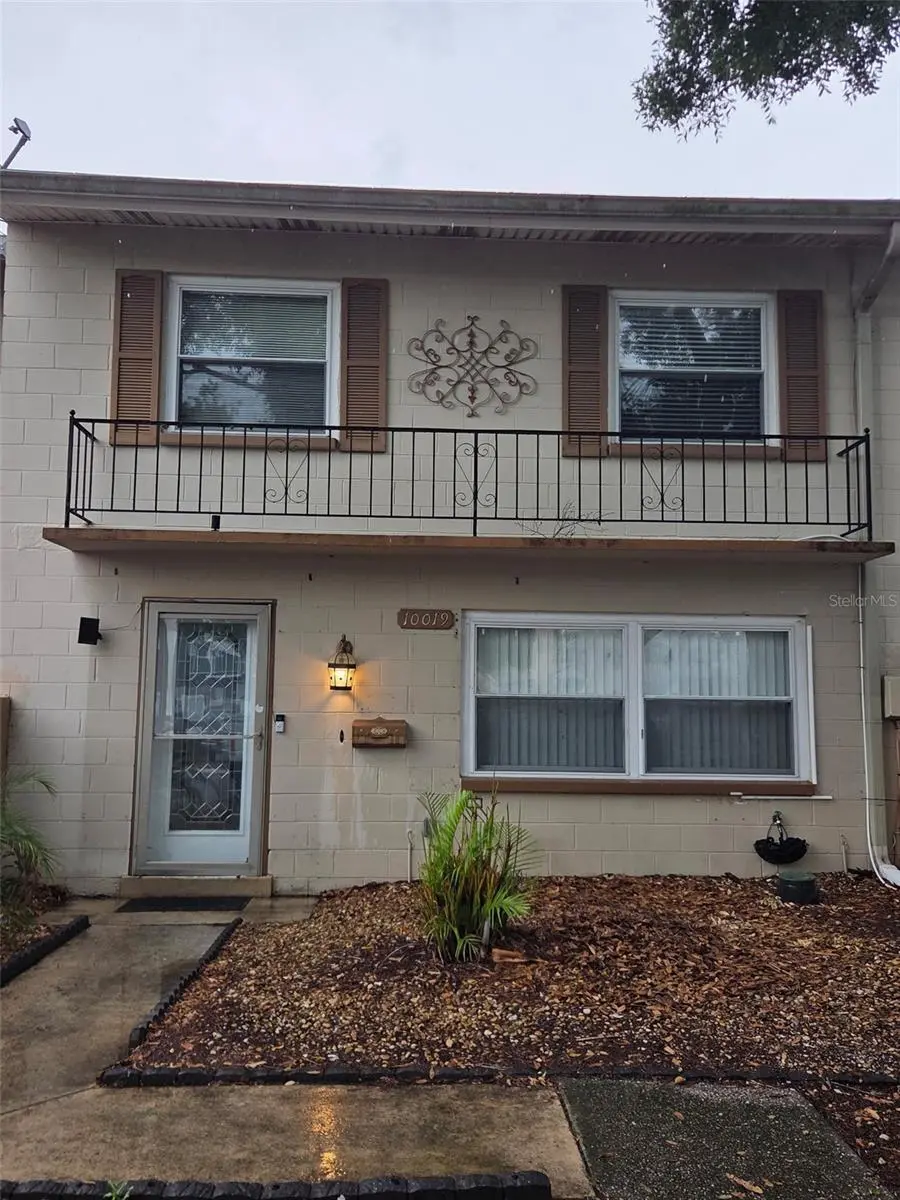
10019 N 52nd St · Temple Terrace, FL
Flood risk 1/10 · Minimal
- FEMA flood zone
- X (unshaded)
- Chance of flooding over 30 yrs
- 0.0%
- Est. flood insurance / yr
- $507 – $1,088
Fire risk 1/10 · Minimal
- Est. fire insurance / yr
- $947 – $1,759
Heat risk 10/10 · Severe
- Hot days now (above 109°F)
- 7 days/yr
- Hot days in 30 yrs
- 26 days/yr
Wind risk 9/10 · Severe
- Chance of severe wind over 30 yrs
- 99.0%
Air-quality risk 3/10 · Minor
- Unhealthy air days now
- 3 days/yr
- Unhealthy air days in 30 yrs
- 4 days/yr
Risk factors via First Street. Map © Google.
Why this score? — see what drove the C- grade
The composite is a weighted blend of 9 inputs, each scored 0–100. Each bar is that input's sub-score; the figure is the points it added to the 100-point composite (weight × sub-score).
- Cash flow +20.4/30.0
- ARV discount +7.5/15.0
- DSCR +6.5/10.0
- 1% rule +4.3/10.0
- Schools +4.2/10.0
- Livability +4.0/5.0
- Condition / age +2.5/5.0
- Rent growth +2.4/5.0
- Appreciation +0.0/10.0
$240,000
🖨 Deal sheet 📄 Offer letter ✓ Due diligence
Listing remarks
One or more photo(s) has been virtually staged. NO HOA Spacious 3 bedroom and 3 full bathrooms. Townhome excellent location very close to Busch Gardens, restaurants, shopping and the University of Florida. Plenty of Parking in the front and a garden/ lawn area in the back. Very large primary bedroom with private bathroom. Spacious 2nd and 3rd bedrooms. Great open Kitchen!. Home or investment, this is a great no HOA townhome location.
Key facts
- Plenty of parking
- Garden lawn area
- Private bathroom
Tags
Property features AI
Finance
- Other: Homestead exempt; No CDD; Unfurnished
- Financial info: Taxes and other financial details available but excluded
- HOA & community: No association fees listed (association fee includes: None); Community playground
Exterior
- Parking: Parking details not provided
- Security: Security features not specified
- Utilities: Public water; Public sewer; Electricity connected
- Home design: Residential townhouse; Two stories; Faces west; Entry level information not specified
- Construction: Block construction; Shingle roof; Slab foundation; Building area reported as 1,906 total; living area reported as 1,776
- Exterior features: Paved road access; Lot of about 0.04 acres (under 1/4 acre)
Interior
- Kitchen: Range; Refrigerator; Dishwasher not listed
- Bedrooms: 3 bedrooms
- Flooring: Carpet; Ceramic tile
- Bathrooms: 3 full bathrooms
- Heating & cooling: Central heating (electric); Central air conditioning
- Interior features: Other interior features; 11 total rooms
- Laundry & utility: Laundry room; Washer; Dryer
Neighborhood map
What this means for you Summary
Snapshot
- This is a 3-bed/3.0-bath townhouse listed at $240k.
Deal economics
- At list price, monthly cash flow is $313 ($4k/yr) — positive.
- The deal already cash-flows at list — no discount required.
- To meet the 1% rule (rent ≥ 1% of price), the offer needs to be $222k (7.5% below list).
- Recommended offer: $222k (7.5% below list) — sets the bar for 1% rule.
Location & tenants
- Location reads 80/100 on livability (#123 in FL, #1,870 nationally) — a professional / high-income tenant draw. Strengths: commute A+, housing A+, cost of living A-; Watch: crime D+, amenities F.
- Hillsborough (suburban): math 47% / reading 50% proficiency, ranked #41 of 73 in FL (top 56%) — families likely to look elsewhere, expect single-tenant / working-renter base with shorter leases.
- Market conditions: Rents soft (-0.3%/yr); 282 active listings in the ZIP; 35 comparable units currently listed for rent nearby; rentals at typical pace (median 16d on market — plan ~3-4 weeks tenant-placement turnaround); 9,053 units permitted in Hillsborough County in 2024 (4,555 in 5+ unit buildings).
- At $2,221/mo this rent would consume 52% of the median local household income ($51k/yr) (locally 3295% of renters already pay >50% of income on rent) — very limited rent-growth headroom before tenants either downsize or default.
Forward outlook
- Local home prices are declining (-3.0%/yr); year-one equity from $2k of loan paydown is wiped out by about $7k of value loss. Plan a longer hold.
- Hillsborough County population projected at +37% by 2050 — long-run rental-demand tailwind backs the buy-and-hold thesis.
Negotiation context
- Only 2 days on market — expect competitive offers; lowballing is unlikely to land.
- Current owner paid $115k; list at $240k implies a 109% gain — meaningful room to come down on a strong offer.
Risks & watch-outs
- Climate carrying-cost: severe wind risk, 99% chance of damaging wind over 30y; extreme-heat days projected 7→26/yr by 2055 (HVAC capex compounding) — expect insurance premiums to compound above CPI over the hold.
Questions for the listing agent
- Built in 1970 — when were the roof, HVAC, electrical panel, plumbing, and water heater last replaced?
- Is there a deadline driving the sale (1031 exchange, divorce, estate, relocation)? That informs how much negotiation room exists.
- Crime grade is D in this area — have there been break-ins, vandalism, or insurance claims at this property in the last 3 years? What carrier currently insures it and at what premium?
- What's the average days-on-market for RENTAL listings here right now (not sales)? A rising rental-DOM trend means longer vacancies and softer asking-rent achievability than the comps imply.
- What's the recent tenant-quality profile in this submarket — average credit score on applications, eviction rate, late-payment / NSF rate, and stable-employment percentage? A property-management company in the area should have these aggregated.
- How much new for-sale + rental construction is in the pipeline within 1–3 miles? Heavy new supply typically softens prices + rents 12–24 months out; constrained supply supports both.
Investment metrics
- 1% rule
- 0.93% ✗
- Cap rate
- 7.86%
- Cash-on-cash
- 5.59%
- DSCR
- 1.25
- GRM
- 9.0
CMA / ARV
No comps found within radius.
Projected returns pro-forma
-3.0% appreciation · 0.0% rent growth · sell at horizon
- IRR
- -10.7%
- Equity multiple
- 0.62×
- Total profit
- $-25,559
- Equity at exit
- $35,785
- IRR
- -5.8%
- Equity multiple
- 0.67×
- Total profit
- $-22,138
- Equity at exit
- $20,751
Cash invested: $67,200 (down + closing). Projections, not guarantees.
Landlord ↔ Tenant lean methodology
- Overall (STATE)
- 87 Strongly Landlord-Friendly
- State Florida
- 87 Strongly Landlord-Friendly · R+3
- County
- — inherits STATE
- City
- — inherits STATE
ZIP-level market 33617
- Rents YoY
- -0.3%
- Active inventory
- 282
- Price-to-rent
- 9.0×
Monthly cashflow live
- Estimated rent
- $2,221 high interval (Pro) →
- Mortgage (P&I)
- −$1,259
- Tax from tax record
- −$83 /mo · $991/yr
- Insurance
- −$100
- HOA
- −$0
- Vacancy / Maint / Mgmt
- −$466
- Net cashflow
- $313
Break-even live
UW: 25.0% down · 7.5% · 30yr · 1.5% tax · 5.0% vac · 8.0% maint · 8.0% mgmt
Financing live
Cash to close
- Down payment
- $60,000
- Closing costs
- $7,200
- Reserves months
- —
- Total cash needed
- —
Loan-product check · same deal, 3 products live
Conventional
25% down · 7.5% · 30yr
- Down + closing
- —
- Monthly P&I
- —
- Monthly cashflow
- —
- DSCR
- —
- Eligible?
- —
Personal DTI + credit; lowest rate.
DSCR
20% down · 8.5% · 30yr
- Down + closing
- —
- Monthly P&I
- —
- Monthly cashflow
- —
- DSCR
- —
- Eligible?
- —
No personal income docs; deal must DSCR.
Hard money
10% down · 12.0% · 12mo
- Down + closing
- —
- Monthly P&I
- —
- Monthly cashflow
- —
- DSCR
- —
- Eligible?
- —
Short-term bridge; refi at stabilization.
Rent comps 35 comps
| Address | Beds | Baths | Sqft | Rent | $/sqft | DOM | Units | Dist |
|---|---|---|---|---|---|---|---|---|
| 10017 N 53rd St Temple Terrace, FL | 2.0 | 1.5 | 1300 | $1,750 | $1.35 | 24d | 1 | 0.09mi |
| 9805 N 53rd St Temple Terrace, FL | 3.0 | 2.0 | 1474 | $2,295 | $1.56 | 3d | 1 | 0.15mi |
| 10605 N 56th St Temple Terrace, FL | 2.0–3.0 | 1.0–2.5 | 1212 | $1,895 | $1.56 | 3d | 5 | 0.45mi |
| 10928 Le Jardin Cir Apt 101 Temple Terrace, FL | 3.0 | 2.0 | 1385 | $1,890 | $1.36 | 11d | 1 | 0.46mi |
| 5039 Chalet Ct Tampa, FL | 1.0–3.0 | 1.0–2.0 | 1187 | $2,005 | $1.69 | 2d | 13 | 0.53mi |
| 5008 E Liberty St Tampa, FL | 3.0 | 2.5 | 1935 | $3,000 | $1.55 | 18d | 1 | 0.55mi |
| 11110 N 56th St Temple Terrace, FL | 1.0–2.0 | 1.0–2.5 | 1130 | $1,795 | $1.59 | 18d | 5 | 0.56mi |
| 4729 E 98th Ave Tampa, FL | 3.0 | 2.0 | 1968 | $2,995 | $1.52 | 24d | 1 | 0.59mi |
| 9811 N Connechusett Rd Tampa, FL | 3.0 | 2.0 | 1485 | $2,185 | $1.47 | 16d | 1 | 0.69mi |
| 8740 Grove Ter Tampa, FL | 2.0 | 1.0–2.0 | 1125 | $1,350 | $1.20 | 24d | 10 | 0.69mi |
| 10410 N Ojus Dr Tampa, FL | 4.0 | 2.0 | 1637 | $2,200 | $1.34 | 24d | 1 | 0.70mi |
| 11325 N 50th St Tampa, FL | 1.0–3.0 | 1.0–2.0 | 975 | $2,013 | $2.06 | 15d | 1 | 0.75mi |
| 8901 Bertha Palmer Blvd Tampa, FL | 1.0–3.0 | 1.0–2.0 | 973 | $2,467 | $2.53 | 3d | 16 | 0.75mi |
| 11301 N 53rd St Temple Terrace, FL | 2.0–3.0 | 2.0 | 1242 | $1,890 | $1.52 | 3d | 3 | 0.77mi |
| 6121 Whiteway Dr Temple Terrace, FL | 4.0 | 2.0 | 2176 | $2,895 | $1.33 | 22d | 1 | 0.80mi |
| 518 Crestover Dr Temple Terrace, FL | 4.0 | 3.0 | 2078 | $3,500 | $1.68 | 3d | 1 | 0.83mi |
| 5008 Sierra Pl Tampa, FL | 3.0 | 2.0 | 1461 | $2,161 | $1.48 | 15d | 1 | 0.99mi |
| 8412 Rio Bravo Ct Tampa, FL | 1.0–3.0 | 1.0–2.5 | 1014 | $1,619 | $1.60 | 24d | 1 | 1.01mi |
| 4406 E Mango Ter Tampa, FL | 2.0 | 1.0 | 1680 | $1,499 | $0.89 | 24d | 1 | 1.17mi |
| 5116 E 122nd Ave Temple Terrace, FL | 4.0 | 3.0 | 2500 | $2,990 | $1.20 | 24d | 1 | 1.20mi |
| 8810 N Orangeview Ave Tampa, FL | 3.0 | 2.0 | 1495 | $2,448 | $1.64 | 22d | 1 | 1.27mi |
| 5709 Las Ventanas Dr Tampa, FL | 3.0–4.0 | 3.5 | 1550 | $1,995 | $1.29 | 5d | 4 | 1.28mi |
| 11830 Skylake Pl #12 Temple Terrace, FL | 2.0 | 2.0 | 1350 | $1,695 | $1.26 | 5d | 1 | 1.28mi |
| 5114 Sunridge Palms Dr Tampa, FL | 3.0 | 2.5 | 1368 | $1,950 | $1.43 | 24d | 1 | 1.29mi |
| 4203 E Yukon St Tampa, FL | 4.0 | 2.0 | 1596 | $2,375 | $1.49 | 15d | 1 | 1.33mi |
| 4203 E Yukon St Tampa, FL | 4.0 | 2.0 | 1596 | $2,375 | $1.49 | 22d | 1 | 1.33mi |
| 10420 McKinley Dr Tampa, FL | 1.0–3.0 | 1.0–2.5 | 1347 | $2,379 | $1.77 | 1d | 81 | 1.33mi |
| 5001 Sunridge Palms Dr Tampa, FL | 3.0 | 3.5 | 2075 | $2,590 | $1.25 | 18d | 1 | 1.35mi |
| 11702 Moffat Ave Unit 1380467P Tampa, FL | 3.0 | 2.0 | 1517 | $3,470 | $2.29 | 2d | 1 | 1.38mi |
| 5052 Sunridge Palms Dr #104 Tampa, FL | 2.0 | 2.5 | 1405 | $2,100 | $1.49 | 18d | 1 | 1.39mi |
| 5028 Sunridge Palms Dr Tampa, FL | 3.0 | 4.0 | 1844 | $2,250 | $1.22 | 24d | 1 | 1.42mi |
| 7002 Ponderosa Dr Tampa, FL | 3.0 | 2.0 | 1246 | $1,899 | $1.52 | 3d | 1 | 1.44mi |
| 6010 Soaring Ave Unit 1053149P Tampa, FL | 4.0 | 3.0 | 2454 | $6,645 | $2.71 | 14d | 1 | 1.47mi |
| 5003 Puritan Rd Tampa, FL | 3.0 | 2.0 | 1469 | $2,000 | $1.36 | 5d | 1 | 1.47mi |
| 5138 Puritan Cir Tampa, FL | 3.0 | 2.0 | 1757 | $2,550 | $1.45 | 24d | 1 | 1.49mi |
Listing history 5 events
-
2026-05-20status Pending
-
2026-05-18$240,000 Active
-
2018-07-02soldstatus $115,000
-
2000-08-28soldstatus $69,000
-
1999-10-11soldstatus $57,500
ⓘ Source: listings_history table (triggers on properties + properties_extension) + one-shot
backfill from property_details.listing_events for pre-trigger history.
Tax reassessment forecast FL · Resets to sale price
- Current annual tax
- $991 · $83/mo
- Projected year-2 tax
- $1,992 · $166/mo
- Expected delta
- +$1,001/yr (+$83/mo · 100.9%)
ⓘ Screening estimate from a state-policy table — verify with the county assessor before closing.
Climate risk First Street
- Flood 1/10 Low FEMA zone X (unshaded) · 0% chance over 30 yrs
- Wildfire 1/10 Low
- Heat 10/10 Extreme 7 d/yr ≥109°F today · 26 d/yr by 30 yrs out
- Wind 9/10 Extreme 99% chance of damaging wind over 30 yrs
- Air quality 3/10 Moderate 3 unhealthy d/yr today · 4 by 30 yrs out
Nearby sold comps map
Loading sold comps map…
Walkable amenities ~0.75 mi
Loading nearby amenities…
Taxation est. · year 1
- Rental income
- $26,647
- − Mortgage interest
- −$13,444
- − Property taxes
- −$991
- − Insurance
- −$1,200
- − Repairs & maintenance
- −$2,132
- − Management
- −$2,132
- − Depreciation
- −$6,982
- Taxable loss
- −$233
- Est. tax savings @ 24.0%
- +$56
- After-tax cash flow
- $3,813/yr
For passive investors: Depreciation is non-cash, so a rental often shows a tax loss while cash-flowing — sheltering income. Rental losses are passive: they offset passive income freely, and up to $25,000/yr can offset ordinary (W-2) income if you actively participate and your MAGI is under $100k (phasing out to $0 by $150k); unused losses carry forward. On sale, claimed depreciation is recaptured at up to 25%, and gains may owe capital-gains tax (a 1031 exchange can defer both). Figures are a year-1 estimate at your 24.0% rate — not tax advice; consult a CPA.
Schools (NCES district)
- District
- Hillsborough
- NCES district ID
- 1200870
- Math proficiency
- 47% ▼ -8.00%
- Reading proficiency
- 50% ▼ -4.00%
- Median HH income
- $50,622
- Composite
- 41.6/100
- National rank
- #3435
- State rank
- #41 of 73 in FL
Livability — Temple Terrace
- Score
- 80/100
- State rank
- #123
- US rank
- #1870
Category grades
Schools grade is shown separately in the Schools card above.
Census & demographics
- Census place
- Temple Terrace, FL
- County
- Hillsborough County · 1,540,968 people
- City population
- 65,509
- Metro
- Tampa-St. Petersburg-Clearwater, FL
- Population (ZIP)
- 47,851
- Household income
- $50,948
- Rent vs Own
- Severe rent burden
- 3295.0
Population outlook (Hillsborough County) Hauer SSP2
- Today (2025)
- 1,607,022 people
- By 2030
- 1,733,968 · +7.9%
- By 2040
- 1,979,565 · +23.2%
- By 2050
- 2,203,427 · +37.1%
- By 2075
- 2,667,893 · +66.0%
- By 2100
- 2,891,558 · +79.9%
Race, ethnicity, and origin ACS 2023
- Neighborhood character
- Highly diverse neighborhood (Simpson 0.71)
- Race & ethnicity
- Black 36% White 33% Hispanic / Latino 23% Two or more races 14% Asian 5%
- Hispanic origin (detail)
- Mexican 2% Puerto Rican 7% Cuban 4% Dominican 2%
- Common ancestry
- Hispanic 3% Lithuanian 1% Romanian 1%
- Foreign-born
- 17% · Canada, Vietnam, Jamaica
- Languages at home
- 74% English-only · Spanish 15% Arabic 3% French/Haitian/Cajun 3%
Political lean MEDSL · Hillsborough
- 2024 margin
- Toss-up / Even · D 47.8% · R 50.9% · Other 1.3%
- 2008→2024 swing
- -10.2pp toward R · 2008: 7.1pp · 2024: -3.1pp
- All cycles
- 2024: R+3.1 2020: D+6.9 2016: D+6.8 2012: D+6.7 2008: D+7.1
Not yet ingested
- Civics
- —
Market trends
- HPI YoY
- ▼ -243.20%
- Current HPI
- 352.4572
- Rent YoY
- ▼ -0.33%
- Metro
- Tampa-St. Petersburg-Clearwater, FL
- State GDP YoY
- ▲ 3.28%
- F500 in state
- 36
Industry mix (Fortune 500 HQ in FL)
| Industry | F500 HQs | Revenue |
|---|---|---|
| Industrial Technology | 2 | $29B |
|
||
| Insurance | 2 | $17B |
|
||
| Retail | 1 | $60B |
|
||
| Technology Distribution | 1 | $58B |
|
||
| Homebuilding | 1 | $35B |
|
||
| Technology Manufacturing | 1 | $35B |
|
||
Price history
+317.4% since first listed5 events — show timeline
- 2026-05-20 Pending — Stellar MLS as Distributed by MLS Grid
- 2026-05-18 Listed $240,000 Stellar MLS as Distributed by MLS Grid
- 2018-07-02 Sold (Public Records) $115,000 Public Records
- 2000-08-28 Sold (Public Records) $69,000 Public Records
- 1999-10-11 Sold (Public Records) $57,500 Public Records
Property tax history
+16.0%/yrLatest (2025): $991 · +11.0% YoY. Source: county tax records.
Cash-flow waterfall
monthlySold comps — $/sqft
last 12 mo · ≤1 miLoading sold comps…