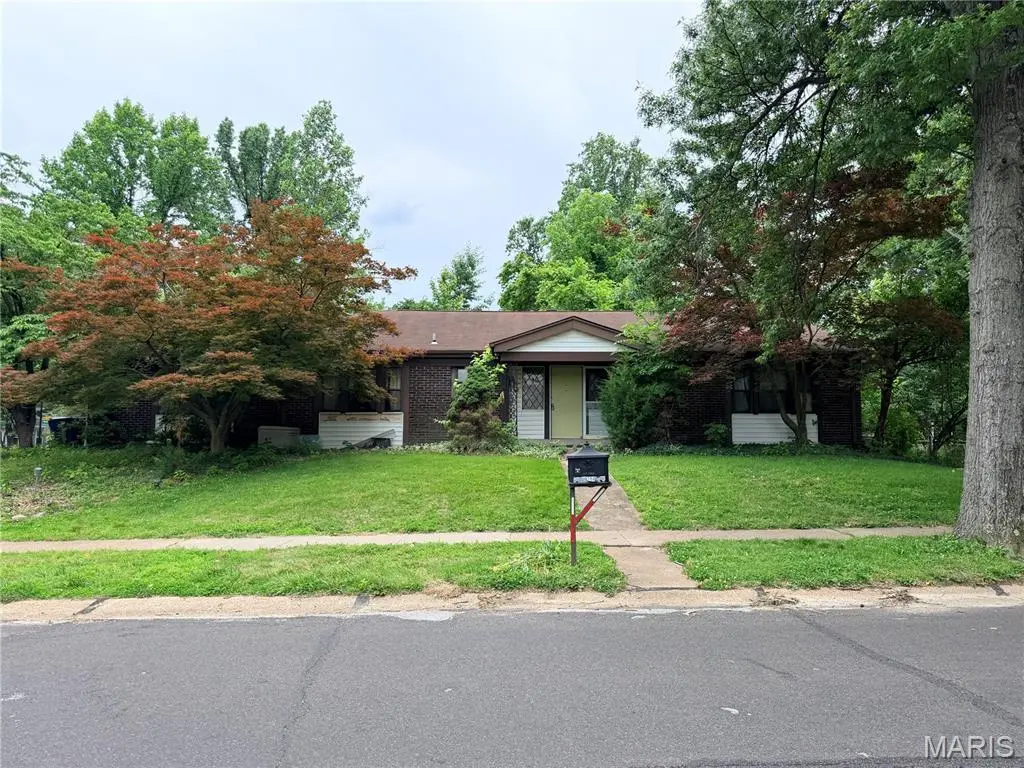
13204 Hobnail Dr · Chesterfield, MO
Flood risk 1/10 · Minimal
- FEMA flood zone
- X (unshaded)
- Chance of flooding over 30 yrs
- 0.0%
- Est. flood insurance / yr
- $473 – $860
Fire risk 1/10 · Minimal
- Est. fire insurance / yr
- $1,054 – $1,958
Heat risk 5/10 · Moderate
- Hot days now (above 106°F)
- 7 days/yr
- Hot days in 30 yrs
- 20 days/yr
Wind risk 2/10 · Minimal
- Chance of severe wind over 30 yrs
- 1.0%
Air-quality risk 2/10 · Minimal
- Unhealthy air days now
- 2 days/yr
- Unhealthy air days in 30 yrs
- 2 days/yr
Risk factors via First Street. Map © Google.
Why this score? — see what drove the D+ grade
The composite is a weighted blend of 9 inputs, each scored 0–100. Each bar is that input's sub-score; the figure is the points it added to the 100-point composite (weight × sub-score).
- ARV discount +15.0/15.0
- Appreciation +10.0/10.0
- Cash flow +7.2/30.0
- Schools +5.1/10.0
- Livability +3.6/5.0
- Condition / age +2.5/5.0
- 1% rule +1.8/10.0
- Rent growth +1.8/5.0
- DSCR +1.3/10.0
$300,000
🖨 Deal sheet 📄 Offer letter ✓ Due diligence
Listing remarks
Property sold as is, in current condition, needing complete rehab.
Key facts
- 0.34 acre lot
- 2 garage spots
- Built 1966
Neighborhood map
What this means for you Summary
Snapshot
- This is a 3-bed/2.5-bath single-family listed at $300k.
Deal economics
- At list price, monthly cash flow is $-419 ($-5k/yr) — negative.
- To cash-flow at today's rent, offer at most $226k (24.7% below list).
- To meet the 1% rule (rent ≥ 1% of price), the offer needs to be $205k (31.5% below list).
- Recommended offer: $205k (31.5% below list) — sets the bar for 1% rule.
- Cap rate 4.6% vs local median 2.9% in Chesterfield — top-decile yield for the area; either an underpriced asset or a hidden risk that comps aren't pricing in. Stress-test before assuming the spread holds.
Location & tenants
- Location reads 71/100 on livability (#110 in MO) — a middle-class / working-renter tenant base. Strengths: employment A+, housing A+, crime A; Watch: amenities F, commute F, cost of living D-.
- Parkway C-2 (suburban): math 49% / reading 62% proficiency, ranked #18 of 324 in MO (top 6%) — acceptable for families but not a draw, mixed tenant base, ~2y average lease; only 14% free/reduced lunch — higher-income household profile.
- Zoned schools: River Bend Elem. (math 42% / reading 61%, grade C-, #268 of 1,115 statewide, top 24%, 423 students, 18% FRL); Central High (math 53% / reading 73%, grade B-, #26 of 521 statewide, top 5%, 1,244 students, 13% FRL) — zoned schools at 16% FRL track the district average.
- Market conditions: Rents soft (-3.0%/yr); 170 active listings in the ZIP; 2 comparable units currently listed for rent nearby; solid renter incomes; 920 units permitted in St. Louis County in 2024 (250 in 5+ unit buildings).
Forward outlook
- In year one you build about $32k of equity ($2k loan paydown + $30k appreciation (10.0% local appreciation)).
- By year 2, paydown + projected appreciation supports a ~$52k cash-out refi (75% LTV) — recoverable capital for the next deal without selling this one.
Negotiation context
- Only 0 days on market — expect competitive offers; lowballing is unlikely to land.
- Current owner paid $162k; list at $300k implies a 85% gain — meaningful room to come down on a strong offer.
Risks & watch-outs
- Climate carrying-cost: extreme-heat days projected 7→20/yr by 2055 (HVAC capex compounding) — expect insurance premiums to compound above CPI over the hold.
Questions for the listing agent
- What do current leases actually rent for vs. the listed asking? Can we see a recent rent roll and the last 12 months of T-12 income?
- Built in 1966 — when were the roof, HVAC, electrical panel, plumbing, and water heater last replaced?
- What does the HOA fee cover, when was the last increase, and are there any pending special assessments or reserve-fund shortfalls?
- Is there a deadline driving the sale (1031 exchange, divorce, estate, relocation)? That informs how much negotiation room exists.
- Schools are A-rated — typically a magnet for longer-tenancy family renters. What's the average tenant stay here, and is there a school-zone premium baked into asking?
- The area grade is low — what's the realistic commute time and amenity access for the typical tenant pool here? Any planned neighborhood developments (good or bad) we should know about?
- What's the average days-on-market for RENTAL listings here right now (not sales)? A rising rental-DOM trend means longer vacancies and softer asking-rent achievability than the comps imply.
- What's the recent tenant-quality profile in this submarket — average credit score on applications, eviction rate, late-payment / NSF rate, and stable-employment percentage? A property-management company in the area should have these aggregated.
- How much new for-sale + rental construction is in the pipeline within 1–3 miles? Heavy new supply typically softens prices + rents 12–24 months out; constrained supply supports both.
Investment metrics
- 1% rule
- 0.68% ✗
- Cap rate
- 4.62%
- Cash-on-cash
- -5.99%
- DSCR
- 0.73
- GRM
- 12.2
CMA / ARV
- ARV (on-the-fly)
- $424,116
- Comps found
- 12
Show comp detail 12 sales within ~0.75 mi
| Address | Dist | Beds/Ba | Sqft | Sold | Price | $/sf | Match |
|---|---|---|---|---|---|---|---|
| 13009 Musket Ct | 0.33mi | 4/2.0 (+1) | 2,171 (-4%) | 1mo | $419,900 | $193 | 70 |
| 1905 Kings Row Mnr | 0.60mi | 3/3.0 | 2,249 (-1%) | 3mo | $475,000 | $211 | 67 |
| 1324 Golden Point Dr | 0.34mi | 2/3.0 (-1) | 2,166 (-4%) | 6mo | $365,000 | $169 | 65 |
| 13114 Walden Woods Ct | 0.36mi | 3/2.0 | 2,045 (-10%) | 5mo | $369,900 | $181 | 60 |
| 13081 Greenbough Dr | 0.44mi | 4/2.5 (+1) | 2,463 (+9%) | 1mo | $519,900 | $211 | 59 |
| 13172 Greenbough Dr | 0.27mi | 4/2.5 (+1) | 2,579 (+14%) | 1mo | $550,000 | $213 | 59 |
| 12970 Nancy Lee Dr | 0.48mi | 3/2.0 | 2,502 (+10%) | 3mo | $359,000 | $143 | 56 |
| 13118 Hickory Mill Ct | 0.44mi | 2/2.5 (-1) | 2,008 (-12%) | 6mo | $374,900 | $187 | 50 |
| 1803 Seven Pnes | 0.71mi | 4/2.5 (+1) | 2,120 (-6%) | 2mo | $365,000 | $172 | 49 |
| 13116 Fir Tree Ct | 0.47mi | 2/2.5 (-1) | 2,569 (+13%) | 4mo | $350,000 | $136 | 48 |
| 12910 Autumn View Dr | 0.64mi | 3/3.0 | 2,019 (-11%) | 4mo | $257,500 | $128 | 46 |
| 12934 Ballantine Ct | 0.71mi | 3/2.5 | 1,992 (-12%) | 2mo | $424,900 | $213 | 45 |
Match score weights: distance 35% · size 25% · config 20% · recency 20%. Top-matched comps best support the ARV.
Projected returns pro-forma
10.0% appreciation · 0.0% rent growth · sell at horizon
- IRR
- 19.3%
- Equity multiple
- 2.56×
- Total profit
- $130,684
- Equity at exit
- $270,264
- IRR
- 17.2%
- Equity multiple
- 5.70×
- Total profit
- $395,081
- Equity at exit
- $582,834
Cash invested: $84,000 (down + closing). Projections, not guarantees.
Landlord ↔ Tenant lean methodology
- Overall (STATE)
- 81 Strongly Landlord-Friendly
- State Missouri
- 81 Strongly Landlord-Friendly · R+10
- County
- — inherits STATE
- City
- — inherits STATE
ZIP-level market 63146
- Home prices YoY
- 4.9%
- Rents YoY
- -3.0%
- Active inventory
- 170
- Price-to-rent
- 12.2×
Monthly cashflow live
- Estimated rent
- $2,054 medium interval (Pro) →
- Mortgage (P&I)
- −$1,573
- Tax from tax record
- −$312 /mo · $3,741/yr
- Insurance
- −$125
- HOA
- −$32
- Vacancy / Maint / Mgmt
- −$431
- Net cashflow
- $-419
Break-even live
UW: 25.0% down · 7.5% · 30yr · 1.5% tax · 5.0% vac · 8.0% maint · 8.0% mgmt
Financing live
Cash to close
- Down payment
- $75,000
- Closing costs
- $9,000
- Reserves months
- —
- Total cash needed
- —
Loan-product check · same deal, 3 products live
Conventional
25% down · 7.5% · 30yr
- Down + closing
- —
- Monthly P&I
- —
- Monthly cashflow
- —
- DSCR
- —
- Eligible?
- —
Personal DTI + credit; lowest rate.
DSCR
20% down · 8.5% · 30yr
- Down + closing
- —
- Monthly P&I
- —
- Monthly cashflow
- —
- DSCR
- —
- Eligible?
- —
No personal income docs; deal must DSCR.
Hard money
10% down · 12.0% · 12mo
- Down + closing
- —
- Monthly P&I
- —
- Monthly cashflow
- —
- DSCR
- —
- Eligible?
- —
Short-term bridge; refi at stabilization.
Rent comps 2 comps
| Address | Beds | Baths | Sqft | Rent | $/sqft | DOM | Units | Dist |
|---|---|---|---|---|---|---|---|---|
| 815 Montmartre Ct Saint Louis, MO | 3.0 | 2.0 | 1862 | $2,300 | $1.24 | 43d | 1 | 1.01mi |
| 12545 Markaire Dr St. Louis, MO | 1.0–3.0 | 1.0–4.0 | 1420 | $2,695 | $1.90 | 10d | 5 | 1.43mi |
HOA detail
- Monthly dues
- $32 · $384/yr
Tax reassessment forecast MO · Resets to sale price
- Current annual tax
- $3,741 · $312/mo
- Projected year-2 tax
- $3,741 · $312/mo
- Expected delta
- $0/yr ($0/mo · 0.0%)
ⓘ Screening estimate from a state-policy table — verify with the county assessor before closing.
Climate risk First Street
- Flood 1/10 Low FEMA zone X (unshaded) · 0% chance over 30 yrs
- Wildfire 1/10 Low
- Heat 5/10 Major 7 d/yr ≥106°F today · 20 d/yr by 30 yrs out
- Wind 2/10 Low 100% chance of damaging wind over 30 yrs
- Air quality 2/10 Low 2 unhealthy d/yr today · 2 by 30 yrs out
Nearby sold comps map
Loading sold comps map…
Walkable amenities ~0.75 mi
Loading nearby amenities…
Taxation est. · year 1
- Rental income
- $24,651
- − Mortgage interest
- −$16,805
- − Property taxes
- −$3,741
- − Insurance
- −$1,500
- − Repairs & maintenance
- −$1,972
- − Management
- −$1,972
- − HOA
- −$384
- − Depreciation
- −$8,727
- Taxable loss
- −$10,450
- Est. tax savings @ 24.0%
- +$2,508
- After-tax cash flow
- $-2,522/yr
For passive investors: Depreciation is non-cash, so a rental often shows a tax loss while cash-flowing — sheltering income. Rental losses are passive: they offset passive income freely, and up to $25,000/yr can offset ordinary (W-2) income if you actively participate and your MAGI is under $100k (phasing out to $0 by $150k); unused losses carry forward. On sale, claimed depreciation is recaptured at up to 25%, and gains may owe capital-gains tax (a 1031 exchange can defer both). Figures are a year-1 estimate at your 24.0% rate — not tax advice; consult a CPA.
Schools (NCES district)
- District
- Parkway C-2
- NCES district ID
- 2923580
- Math proficiency
- 49% ▼ -11.00%
- Reading proficiency
- 62% ▼ -2.00%
- Median HH income
- $83,551
- Composite
- 50.5/100
- National rank
- #1851
- State rank
- #18 of 324 in MO
Livability — Chesterfield
- Score
- 71/100
- State rank
- #110
- US rank
- #7054
Category grades
Schools grade is shown separately in the Schools card above.
Census & demographics
- County
- Saint Louis County · 888,823 people
- City population
- 43,243
- Metro
- St. Louis, MO-IL
- Population (ZIP)
- 30,678
- Household income
- $84,756
- Rent vs Own
- Severe rent burden
- 1156.0
Population outlook (St. Louis County) Hauer SSP2
- Today (2025)
- 1,025,227 people
- By 2030
- 1,028,023 · +0.3%
- By 2040
- 1,020,940 · -0.4%
- By 2050
- 1,007,280 · -1.8%
- By 2075
- 987,277 · -3.7%
- By 2100
- 921,984 · -10.1%
Race, ethnicity, and origin ACS 2023
- Neighborhood character
- Diverse neighborhood (Simpson 0.56)
- Race & ethnicity
- White 63% Asian 17% Black 13% Two or more races 4% Hispanic / Latino 3%
- Common ancestry
- Scotch-Irish 3% Romanian 3% Italian 2%
- Foreign-born
- 19% · China, South Korea, Canada
- Languages at home
- 79% English-only · Other Asian/Pacific 7% Other Indo-European 4% Chinese 3%
Political lean MEDSL · St. Louis
- 2024 margin
- Strong D (+23.4) · D 60.8% · R 37.4% · Other 1.7%
- 2008→2024 swing
- +3.5pp toward D · 2008: 19.9pp · 2024: 23.4pp
- All cycles
- 2024: D+23.4 2020: D+24.0 2016: D+16.2 2012: D+13.7 2008: D+19.9
Not yet ingested
- Civics
- —
Market trends
- HPI YoY
- ▲ 33.10%
- Current HPI
- 711.49
- Rent YoY
- ▼ -2.96%
- Metro
- St. Louis, MO-IL
- State GDP YoY
- ▲ 1.84%
- F500 in state
- 20
Industry mix (Fortune 500 HQ in MO)
| Industry | F500 HQs | Revenue |
|---|---|---|
| Healthcare | 1 | $163B |
|
||
| Insurance | 1 | $21B |
|
||
| Industrial Technology | 1 | $17B |
|
||
| Retail | 1 | $16B |
|
||
| Industrial Distribution | 1 | $10B |
|
||
| Utilities | 1 | $9B |
|
||
Price history
+114.3% since first listed4 events — show timeline
- 2026-05-30 Delisted — MARIS as Distributed by MLS Grid
- 2026-05-29 Listed $300,000 MARIS as Distributed by MLS Grid
- 1997-11-06 Sold (Public Records) $162,000 Public Records
- 1990-03-01 Sold (Public Records) $140,000 Public Records
Property tax history
+1.7%/yrLatest (2022): $3,741 · +0.4% YoY. Source: county tax records.
Cash-flow waterfall
monthlySold comps — $/sqft
last 12 mo · ≤1 miLoading sold comps…