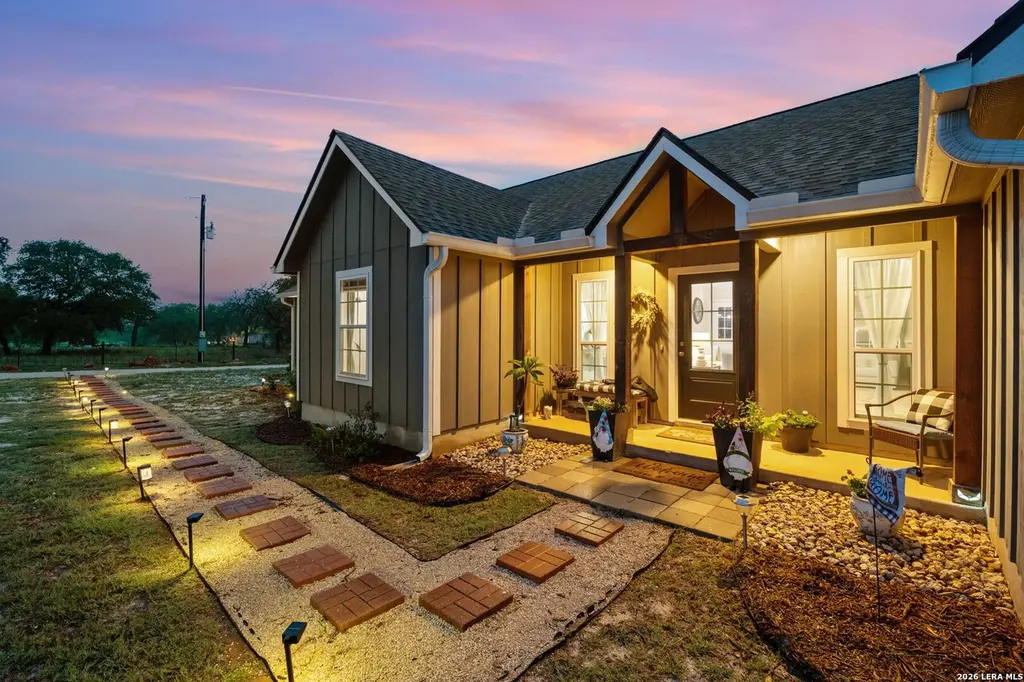
2520 County Road 319 · La Vernia, TX
Flood risk 1/10 · Minimal
- FEMA flood zone
- X (unshaded)
- Chance of flooding over 30 yrs
- 0.0%
- Est. flood insurance / yr
- $507 – $1,088
Fire risk 5/10 · Moderate
- Est. fire insurance / yr
- $1,222 – $2,270
Heat risk 8/10 · Major
- Hot days now (above 109°F)
- 7 days/yr
- Hot days in 30 yrs
- 24 days/yr
Wind risk 8/10 · Major
- Chance of severe wind over 30 yrs
- 80.0%
Air-quality risk 1/10 · Minimal
- Unhealthy air days now
- 0 days/yr
- Unhealthy air days in 30 yrs
- 0 days/yr
Risk factors via First Street. Map © Google.
Why this score? — see what drove the C grade
The composite is a weighted blend of 9 inputs, each scored 0–100. Each bar is that input's sub-score; the figure is the points it added to the 100-point composite (weight × sub-score).
- Cash flow +16.9/30.0
- ARV discount +13.1/15.0
- DSCR +5.3/10.0
- Schools +5.2/10.0
- Condition / age +4.8/5.0
- 1% rule +4.4/10.0
- Livability +3.1/5.0
- Rent growth +2.5/5.0
- Appreciation +0.0/10.0
$425,000
🖨 Deal sheet 📄 Offer letter ✓ Due diligence
Listing remarks MLS
1.17 acres in La Vernia. Not in a defined subdivision. Minimal restrictions in place. County road frontage.
Key facts
- Private acres
- Flexible nook
- Open views
Tags
Property features AI
Finance
- Financial info: Down payment resources available
- HOA & community: Rolling Hills Sub (community)
Exterior
- Parking: 2-car garage; Oversized parking available
- Utilities: Electric service by GVEC; Co-op water and septic; Water supplier: SS Water Sup; Garbage service: Waste Connec
- Home design: Pre-owned single-family home; Approx. 3 years old; Located in the Rolling Hills subdivision
- Construction: Siding exterior; Slab foundation; Composition roof; Built by United Built Homes
- Exterior features: Covered patio; Partial fence; Double-pane windows; Storage building / shed; Gutters; Special yard lighting; County view; Level lot; County road access
Interior
- Kitchen: Island kitchen; Eat-in kitchen; Walk-in pantry; Dishwasher; Disposal; Stove/Range
- Bedrooms: Master bedroom: split plan, on lower level, walk-in closet, multiple closets, ceiling fan, full bath (16 x 14); Bedroom 2: 15 x 10; Bedroom 3: 14 x 11; Bedroom 4: 12 x 12
- Flooring: Laminate flooring; Other (see remarks)
- Bathrooms: 2 full bathrooms; Master bath with shower only and double vanity (7 x 7)
- Heating & cooling: Central heating (electric); Central air conditioning
- Interior features: Ceiling fans; Washer and dryer connections; Disposal; Dishwasher; Stove/Range; Garage door opener; Smoke alarm; Electric water heater; Private garbage service; 1 living area with separate dining room; Eat-in kitchen with island and walk-in pantry; Utility room inside / laundry room; Open floor plan; Pull-down storage; All bedrooms on lower level; Some window coverings remain; Living room fireplace
- Laundry & utility: Utility/Laundry room inside (9 x 10); Washer connection; Dryer connection; Garage door opener
Neighborhood map
What this means for you Summary
Snapshot
- This is a 4-bed/2.0-bath single-family listed at $425k. Condition is rated excellent.
Deal economics
- At list price, monthly cash flow is $282 ($3k/yr) — positive.
- The deal already cash-flows at list — no discount required.
- To meet the 1% rule (rent ≥ 1% of price), the offer needs to be $400k (5.9% below list).
- Recommended offer: $400k (5.9% below list) — sets the bar for 1% rule.
- Cap rate 7.1% vs local median 1.4% in La Vernia — top-decile yield for the area; either an underpriced asset or a hidden risk that comps aren't pricing in. Stress-test before assuming the spread holds.
Location & tenants
- Location reads 61/100 on livability (#994 in TX) — a middle-class / working-renter tenant base. Strengths: crime A+, cost of living A+, housing A+; Watch: amenities F, commute F, health & safety F.
- La Vernia ISD (rural): math 61% / reading 53% proficiency, ranked #62 of 826 in TX (top 8%) — acceptable for families but not a draw, mixed tenant base, ~2y average lease.
- Zoned schools: La Vernia Pri (881 students, 31% FRL); La Vernia H S (math 57% / reading 71%, grade B-, #224 of 1,632 statewide, top 14%, 981 students, 24% FRL) — zoned schools at 28% FRL track the district average.
- Market conditions: 232 active listings in the ZIP; 1 comparable units currently listed for rent nearby; 135 units permitted in Wilson County in 2024 (0 in 5+ unit buildings).
Forward outlook
- Local home prices are declining (-3.0%/yr); year-one equity from $3k of loan paydown is wiped out by about $13k of value loss. Plan a longer hold.
- Wilson County population projected at +46% by 2050 — long-run rental-demand tailwind backs the buy-and-hold thesis.
Negotiation context
- Only 14 days on market — expect competitive offers; lowballing is unlikely to land.
- 2 sale attempts since 5y ago with the ask held roughly flat each time — persistent listings suggest the price (not the market) is what's stuck; bring a comps-based counter.
Risks & watch-outs
- Climate carrying-cost: severe wind risk, 80% chance of damaging wind over 30y; moderate wildfire risk; extreme-heat days projected 7→24/yr by 2055 (HVAC capex compounding) — expect insurance premiums to compound above CPI over the hold.
Questions for the listing agent
- Is there a deadline driving the sale (1031 exchange, divorce, estate, relocation)? That informs how much negotiation room exists.
- Schools are B-rated — typically a magnet for longer-tenancy family renters. What's the average tenant stay here, and is there a school-zone premium baked into asking?
- What's the average days-on-market for RENTAL listings here right now (not sales)? A rising rental-DOM trend means longer vacancies and softer asking-rent achievability than the comps imply.
- What's the recent tenant-quality profile in this submarket — average credit score on applications, eviction rate, late-payment / NSF rate, and stable-employment percentage? A property-management company in the area should have these aggregated.
- How much new for-sale + rental construction is in the pipeline within 1–3 miles? Heavy new supply typically softens prices + rents 12–24 months out; constrained supply supports both.
Investment metrics
- 1% rule
- 0.94% ✗
- Cap rate
- 7.09%
- Cash-on-cash
- 2.84%
- DSCR
- 1.13
- GRM
- 8.9
CMA / ARV
- ARV (on-the-fly)
- $485,408
- Comps found
- 11
Show comp detail 11 sales within ~0.75 mi
| Address | Dist | Beds/Ba | Sqft | Sold | Price | $/sf | Match |
|---|---|---|---|---|---|---|---|
| 2520 County Road 319 | 0.00mi | 4/2.0 | 2,167 (0%) | 1mo | $425,000 | $196 | 100 |
| 524 Jacobs | 0.33mi | 4/2.5 | 2,120 (-2%) | 2mo | $500,000 | $236 | 78 |
| 568 Jacobs Ln | 0.54mi | 4/2.5 | 2,185 (+1%) | 6mo | $489,900 | $224 | 66 |
| 517 Jacobs Ln | 0.27mi | 4/2.5 | 2,276 (+5%) | 13mo | $580,000 | $255 | 66 |
| 147 Shadow Woods | 0.30mi | 3/2.0 (-1) | 2,214 (+2%) | 18mo | $445,000 | $201 | 63 |
| 521 Jacobs Ln | 0.29mi | 4/2.0 | 1,845 (-15%) | 15mo | $415,000 | $225 | 49 |
| 411 Rose Blossom Loop | 0.64mi | 4/2.0 | 2,308 (+6%) | 14mo | $465,000 | $201 | 48 |
| 561 Jacobs Ln | 0.48mi | 4/2.5 | 2,428 (+12%) | 11mo | $570,000 | $235 | 47 |
| 112 Rolling Hills Dr | 0.35mi | 4/2.0 | 1,872 (-14%) | 18mo | $250,000 | $134 | 46 |
| 159 Shadow Woods | 0.31mi | 3/2.0 (-1) | 1,873 (-14%) | 21mo | $397,500 | $212 | 41 |
| 300 Rose Garden Dr | 0.73mi | 4/2.5 | 2,369 (+9%) | 15mo | $554,000 | $234 | 36 |
Match score weights: distance 35% · size 25% · config 20% · recency 20%. Top-matched comps best support the ARV.
Projected returns pro-forma
-3.0% appreciation · 3.0% rent growth · sell at horizon
- IRR
- -11.8%
- Equity multiple
- 0.57×
- Total profit
- $-50,877
- Equity at exit
- $63,369
- IRR
- -2.6%
- Equity multiple
- 0.82×
- Total profit
- $-21,069
- Equity at exit
- $36,746
Cash invested: $119,000 (down + closing). Projections, not guarantees.
Landlord ↔ Tenant lean methodology
- Overall (STATE)
- 87 Strongly Landlord-Friendly
- State Texas
- 87 Strongly Landlord-Friendly · R+5
- County
- — inherits STATE
- City
- — inherits STATE
ZIP-level market 78121
- Home prices YoY
- -20.1%
- Active inventory
- 232
- Price-to-rent
- 8.9×
Monthly cashflow live
- Estimated rent
- $4,000 medium interval (Pro) →
- Mortgage (P&I)
- −$2,229
- Tax from tax record
- −$472 /mo · $5,665/yr
- Insurance
- −$177
- HOA
- −$0
- Vacancy / Maint / Mgmt
- −$840
- Net cashflow
- $282
Break-even live
UW: 25.0% down · 7.5% · 30yr · 1.5% tax · 5.0% vac · 8.0% maint · 8.0% mgmt
Financing live
Cash to close
- Down payment
- $106,250
- Closing costs
- $12,750
- Reserves months
- —
- Total cash needed
- —
Loan-product check · same deal, 3 products live
Conventional
25% down · 7.5% · 30yr
- Down + closing
- —
- Monthly P&I
- —
- Monthly cashflow
- —
- DSCR
- —
- Eligible?
- —
Personal DTI + credit; lowest rate.
DSCR
20% down · 8.5% · 30yr
- Down + closing
- —
- Monthly P&I
- —
- Monthly cashflow
- —
- DSCR
- —
- Eligible?
- —
No personal income docs; deal must DSCR.
Hard money
10% down · 12.0% · 12mo
- Down + closing
- —
- Monthly P&I
- —
- Monthly cashflow
- —
- DSCR
- —
- Eligible?
- —
Short-term bridge; refi at stabilization.
Rent comps 1 comps
| Address | Beds | Baths | Sqft | Rent | $/sqft | DOM | Units | Dist |
|---|---|---|---|---|---|---|---|---|
| 112 Scenic Hills Dr La Vernia, TX | 4.0 | 2.5 | 2382 | $4,000 | $1.68 | 1d | 1 | 0.69mi |
Listing history 7 events
-
2026-05-08status Pending
-
2026-04-28historical Active Option
-
2026-04-23$425,000 New
-
2021-06-14soldstatus Sold 107-char remark
Show marketing remark (107 chars)
1.17 acres in La Vernia. Not in a defined subdivision. Minimal restrictions in place. County road frontage.
-
2021-05-20status Pending 107-char remark
Show marketing remark (107 chars)
1.17 acres in La Vernia. Not in a defined subdivision. Minimal restrictions in place. County road frontage.
-
2021-05-06historical Active Option 107-char remark
Show marketing remark (107 chars)
1.17 acres in La Vernia. Not in a defined subdivision. Minimal restrictions in place. County road frontage.
-
2021-04-27$69,900 New 107-char remark
Show marketing remark (107 chars)
1.17 acres in La Vernia. Not in a defined subdivision. Minimal restrictions in place. County road frontage.
ⓘ Source: listings_history table (triggers on properties + properties_extension) + one-shot
backfill from property_details.listing_events for pre-trigger history.
Tax reassessment forecast TX · Resets to sale price
- Current annual tax
- $5,665 · $472/mo
- Projected year-2 tax
- $7,778 · $648/mo
- Expected delta
- +$2,113/yr (+$176/mo · 37.3%)
ⓘ Screening estimate from a state-policy table — verify with the county assessor before closing.
Climate risk First Street
- Flood 1/10 Low FEMA zone X (unshaded) · 0% chance over 30 yrs
- Wildfire 5/10 Major
- Heat 8/10 Severe 7 d/yr ≥109°F today · 24 d/yr by 30 yrs out
- Wind 8/10 Severe 80% chance of damaging wind over 30 yrs
- Air quality 1/10 Low 0 unhealthy d/yr today · 0 by 30 yrs out
Nearby sold comps map
Loading sold comps map…
Walkable amenities ~0.75 mi
Loading nearby amenities…
Taxation est. · year 1
- Rental income
- $48,000
- − Mortgage interest
- −$23,807
- − Property taxes
- −$5,665
- − Insurance
- −$2,125
- − Repairs & maintenance
- −$3,840
- − Management
- −$3,840
- − Depreciation
- −$12,364
- Taxable loss
- −$3,640
- Est. tax savings @ 24.0%
- +$874
- After-tax cash flow
- $4,259/yr
For passive investors: Depreciation is non-cash, so a rental often shows a tax loss while cash-flowing — sheltering income. Rental losses are passive: they offset passive income freely, and up to $25,000/yr can offset ordinary (W-2) income if you actively participate and your MAGI is under $100k (phasing out to $0 by $150k); unused losses carry forward. On sale, claimed depreciation is recaptured at up to 25%, and gains may owe capital-gains tax (a 1031 exchange can defer both). Figures are a year-1 estimate at your 24.0% rate — not tax advice; consult a CPA.
Condition & rehab AI · 12 photos
This well-maintained, modern single-family home is move-in ready with no immediate repairs needed. It offers a spacious layout, modern finishes, and a beautiful outdoor space.
Value-add opportunities
- Both Landscaping and curb appeal improvements — Enhances curb appeal and can attract more buyers
- Both Add a smart home system — Improves convenience and can increase property value
- Both Install smart locks — Enhances security and can increase property value
Renovation cost estimate screening
Value-add ROI direction
- Both Landscaping and curb appeal improvements — Enhances curb appeal and can attract more buyers ↑
- Both Add a smart home system — Improves convenience and can increase property value ↑
- Both Install smart locks — Enhances security and can increase property value ↑
ⓘ Cost ranges are severity-bucket heuristics (US national rule-of-thumb). Get contractor quotes + a written scope before underwriting a rehab budget.
Schools (NCES district)
- District
- La Vernia ISD
- NCES district ID
- 4826310
- Math proficiency
- 61% ▼ -8.00%
- Reading proficiency
- 53% ▼ -3.00%
- Median HH income
- $81,317
- Composite
- 51.63/100
- National rank
- #1704
- State rank
- #62 of 826 in TX
Livability — La Vernia
- Score
- 61/100
- State rank
- #994
- US rank
- #17682
Category grades
Schools grade is shown separately in the Schools card above.
Census & demographics
- Population (ZIP)
- 15,001
Population outlook (Wilson County) Hauer SSP2
- Today (2025)
- 58,434 people
- By 2030
- 63,912 · +9.4%
- By 2040
- 74,704 · +27.8%
- By 2050
- 85,024 · +45.5%
- By 2075
- 111,025 · +90.0%
- By 2100
- 126,692 · +116.8%
Race, ethnicity, and origin ACS 2023
- Neighborhood character
- Predominantly White (70%)
- Race & ethnicity
- White 70% Hispanic / Latino 23% Two or more races 14% Black 2%
- Hispanic origin (detail)
- Mexican 21%
- Common ancestry
- Romanian 5% Italian 3% Czech 1%
- Foreign-born
- 6% · Canada
- Languages at home
- 86% English-only · Spanish 12% Russian/Polish/Slavic 1%
Political lean MEDSL · Wilson
- 2024 margin
- Solid R (+53.7) · D 22.9% · R 76.6%
- 2008→2024 swing
- -19.8pp toward R · 2008: -33.9pp · 2024: -53.7pp
- All cycles
- 2024: R+53.7 2020: R+48.4 2016: R+47.8 2012: R+43.0 2008: R+33.9
Not yet ingested
- Civics
- —
Market trends
- HPI YoY
- ▼ -56.30%
- Current HPI
- 223.1249
- Rent YoY
- —
- Metro
- —
- State GDP YoY
- ▲ 3.95%
- F500 in state
- 110
Industry mix (Fortune 500 HQ in TX)
| Industry | F500 HQs | Revenue |
|---|---|---|
| Energy | 16 | $1,198B |
|
||
| Technology | 5 | $198B |
|
||
| Engineering / Construction | 4 | $72B |
|
||
| Energy Services | 3 | $60B |
|
||
| Utilities | 3 | $41B |
|
||
| Healthcare | 2 | $330B |
|
||
Price history
+508.0% since first listed7 events — show timeline
- 2026-05-08 Pending — LERA
- 2026-04-28 Contingent — LERA
- 2026-04-23 Listed $425,000 LERA
- 2021-06-14 Sold (MLS) — LERA
- 2021-05-20 Pending — LERA
- 2021-05-06 Contingent — LERA
- 2021-04-27 Listed $69,900 LERA
Property tax history
-0.3%/yrLatest (2025): $5,665 · -0.3% YoY. Source: county tax records.
Cash-flow waterfall
monthlySold comps — $/sqft
last 12 mo · ≤1 miLoading sold comps…