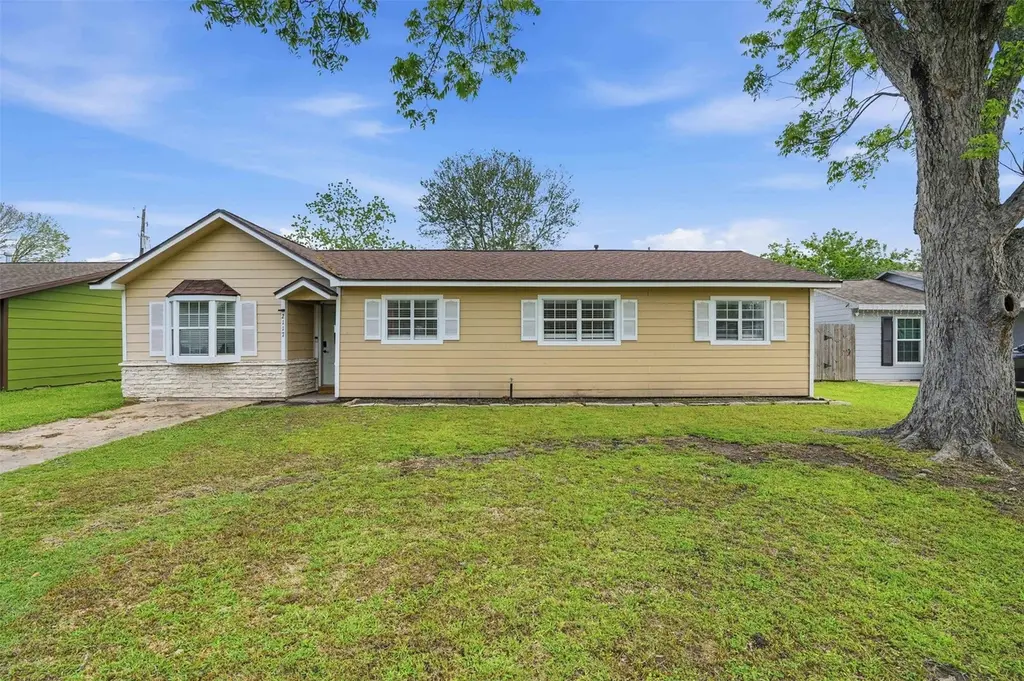
2117 Estate Dr · Deer Park, TX
Flood risk 1/10 · Minimal
- FEMA flood zone
- X (unshaded)
- Chance of flooding over 30 yrs
- 0.0%
- Est. flood insurance / yr
- $507 – $1,088
Fire risk 1/10 · Minimal
- Est. fire insurance / yr
- $1,222 – $2,270
Heat risk 9/10 · Severe
- Hot days now (above 108°F)
- 7 days/yr
- Hot days in 30 yrs
- 22 days/yr
Wind risk 9/10 · Severe
- Chance of severe wind over 30 yrs
- 99.0%
Air-quality risk 2/10 · Minimal
- Unhealthy air days now
- 2 days/yr
- Unhealthy air days in 30 yrs
- 2 days/yr
Risk factors via First Street. Map © Google.
Why this score? — see what drove the D- grade
The composite is a weighted blend of 9 inputs, each scored 0–100. Each bar is that input's sub-score; the figure is the points it added to the 100-point composite (weight × sub-score).
- Cash flow +9.9/30.0
- ARV discount +9.6/15.0
- Schools +4.3/10.0
- 1% rule +4.1/10.0
- Livability +3.6/5.0
- Rent growth +3.1/5.0
- DSCR +2.8/10.0
- Condition / age +2.5/5.0
- Appreciation +0.0/10.0
$199,000
🖨 Deal sheet 📄 Offer letter ✓ Due diligence
Listing remarks MLS
This 1,330 square foot house sits on a 7,020 square foot lot and features 3 bedrooms, Game room and 2 bathrooms. Recently updated. It won't last!
Key facts
- Updated electrical
- Pex plumbing
- New hvac
Tags
Property features AI
Exterior
- Parking: No parking
- Utilities: Public water; Public sewer
- Home design: Residential property; One story; Entry on first floor
- Construction: Vinyl siding; Composition roof; Slab foundation; Built in 1950
- Exterior features: Subdivision lot
Interior
- Kitchen: Convection oven; Gas cooktop
- Bedrooms: Primary bedroom on first floor (20 x 12); Bedroom on first floor (13 x 10); Bedroom on first floor (11 x 9); Bedroom on first floor (10 x 11)
- Flooring: Plank; Tile; Vinyl
- Bathrooms: 2 full bathrooms
- Heating & cooling: Central heating (gas); Central electric air conditioning
- Interior features: Vaulted ceilings; 7 total rooms
- Laundry & utility: Washer hookup; Electric dryer hookup
Neighborhood map
What this means for you Summary
Snapshot
- This is a 3-bed/1.0-bath single-family listed at $199k.
Deal economics
- At list price, monthly cash flow is $-125 ($-2k/yr) — negative.
- To cash-flow at today's rent, offer at most $177k (11.1% below list).
- To meet the 1% rule (rent ≥ 1% of price), the offer needs to be $182k (8.7% below list).
- Recommended offer: $177k (11.1% below list) — sets the bar for cash-flow.
- Cap rate 5.5% vs local median 3.6% in Deer Park — top-decile yield for the area; either an underpriced asset or a hidden risk that comps aren't pricing in. Stress-test before assuming the spread holds.
Location & tenants
- Location reads 72/100 on livability (#244 in TX) — a middle-class / working-renter tenant base. Strengths: cost of living A+, housing A+, crime A; Watch: amenities C-, commute F.
- Deer Park ISD (suburban): math 50% / reading 47% proficiency, ranked #170 of 826 in TX (top 21%) — families likely to look elsewhere, expect single-tenant / working-renter base with shorter leases.
- Zoned schools: Carpenter El (math 36% / reading 41%, grade F, #1,680 of 4,322 statewide, top 40%, 847 students, 60% FRL); Deer Park H S (math 57% / reading 59%, grade C, #320 of 1,632 statewide, top 20%, 4,026 students, 38% FRL).
- Market conditions: Rents rising (+2.3%/yr); 167 active listings in the ZIP; 15 comparable units currently listed for rent nearby; rentals at typical pace (median 24d on market — plan ~3-4 weeks tenant-placement turnaround); 47% of comp listings sitting > 30 days — soft ceiling on asking rent; solid renter incomes; 29,883 units permitted in Harris County in 2024 (8,621 in 5+ unit buildings).
Forward outlook
- Local home prices are declining (-3.0%/yr); year-one equity from $1k of loan paydown is wiped out by about $6k of value loss. Plan a longer hold.
- Harris County population projected at +47% by 2050 — long-run rental-demand tailwind backs the buy-and-hold thesis.
Negotiation context
- It's been on market 52 days — a 3% lower offer ($193k) is reasonable based on typical stale-listing flexibility.
- 3 sale attempts since 9y ago; this cycle's ask has dropped $11k (5%) from the opening price — seller is motivated, your offer sets the floor, not the list.
Risks & watch-outs
- Watch-outs: property tax is 2.6% of price; built in 1950 — expect roof / HVAC / electrical / plumbing capex.
- Climate carrying-cost: severe wind risk, 99% chance of damaging wind over 30y; extreme-heat days projected 7→22/yr by 2055 (HVAC capex compounding) — expect insurance premiums to compound above CPI over the hold.
Questions for the listing agent
- What do current leases actually rent for vs. the listed asking? Can we see a recent rent roll and the last 12 months of T-12 income?
- It's been on market 52 days. Have you received any prior offers? Is the seller open to a 11% concession, seller financing, or rate buy-down credit?
- Built in 1950 — when were the roof, HVAC, electrical panel, plumbing, and water heater last replaced?
- Property tax is high relative to price — has the assessment been appealed recently, and will the sale trigger a re-assessment?
- Is there a deadline driving the sale (1031 exchange, divorce, estate, relocation)? That informs how much negotiation room exists.
- The area grade is low — what's the realistic commute time and amenity access for the typical tenant pool here? Any planned neighborhood developments (good or bad) we should know about?
- What's the average days-on-market for RENTAL listings here right now (not sales)? A rising rental-DOM trend means longer vacancies and softer asking-rent achievability than the comps imply.
- What's the recent tenant-quality profile in this submarket — average credit score on applications, eviction rate, late-payment / NSF rate, and stable-employment percentage? A property-management company in the area should have these aggregated.
- How much new for-sale + rental construction is in the pipeline within 1–3 miles? Heavy new supply typically softens prices + rents 12–24 months out; constrained supply supports both.
Investment metrics
- 1% rule
- 0.91% ✗
- Cap rate
- 5.54%
- Cash-on-cash
- -2.70%
- DSCR
- 0.88
- GRM
- 9.1
CMA / ARV
- ARV (median comp)
- $208,804
- List price
- $199,000
- Delta
- -4.70%
- Verdict
- FAIR
- Comps
- 20 within 1.0 mi
Show comp detail 12 sales within ~0.75 mi
| Address | Dist | Beds/Ba | Sqft | Sold | Price | $/sf | Match |
|---|---|---|---|---|---|---|---|
| 2206 Hillshire Dr | 0.06mi | 3/2.0 | 1,402 (+5%) | 14mo | $234,000 | $167 | 73 |
| 2606 Hillshire Dr | 0.47mi | 3/2.0 | 1,310 (-2%) | 2mo | $250,000 | $191 | 70 |
| 3625 Whatley Dr | 0.19mi | 3/2.0 | 1,434 (+8%) | 6mo | $272,000 | $190 | 69 |
| 1014 Brookhollow Dr | 0.48mi | 3/2.0 | 1,386 (+4%) | 0mo | $269,500 | $194 | 66 |
| 3205 Brookhurst Ln | 0.41mi | 3/2.0 | 1,420 (+7%) | 1mo | $269,500 | $190 | 65 |
| 1110 Brookhollow Dr | 0.46mi | 3/2.0 | 1,406 (+6%) | 2mo | $249,000 | $177 | 64 |
| 1010 Wisdom Dr | 0.26mi | 3/2.0 | 1,510 (+14%) | 2mo | $295,000 | $195 | 60 |
| 2406 Hillshire Dr | 0.25mi | 3/1.5 | 1,488 (+12%) | 11mo | $259,000 | $174 | 58 |
| 1818 Hillshire Dr | 0.31mi | 3/2.0 | 1,156 (-13%) | 11mo | $185,000 | $160 | 51 |
| 2413 Estate Dr | 0.27mi | 3/2.0 | 1,525 (+15%) | 14mo | $264,900 | $174 | 47 |
| 6510 Bramley Dr | 0.47mi | 3/2.0 | 1,511 (+14%) | 7mo | $250,000 | $165 | 46 |
| 7406 Valeda Dr | 0.75mi | 3/2.0 | 1,155 (-13%) | 7mo | $205,000 | $177 | 33 |
Match score weights: distance 35% · size 25% · config 20% · recency 20%. Top-matched comps best support the ARV.
Projected returns pro-forma
-3.0% appreciation · 2.26% rent growth · sell at horizon
- IRR
- -21.6%
- Equity multiple
- 0.26×
- Total profit
- $-41,419
- Equity at exit
- $29,672
- IRR
- -17.3%
- Equity multiple
- 0.08×
- Total profit
- $-51,186
- Equity at exit
- $17,206
Cash invested: $55,720 (down + closing). Projections, not guarantees.
Landlord ↔ Tenant lean methodology
- Overall (STATE)
- 87 Strongly Landlord-Friendly
- State Texas
- 87 Strongly Landlord-Friendly · R+5
- County
- — inherits STATE
- City
- — inherits STATE
ZIP-level market 77536
- Home prices YoY
- -24.8%
- Rents YoY
- 2.3%
- Active inventory
- 167
- Price-to-rent
- 9.1×
Monthly cashflow live
- Estimated rent
- $1,817 high interval (Pro) →
- Mortgage (P&I)
- −$1,044
- Tax from tax record
- −$434 /mo · $5,206/yr
- Insurance
- −$83
- HOA
- −$0
- Vacancy / Maint / Mgmt
- −$382
- Net cashflow
- $-125
Break-even live
UW: 25.0% down · 7.5% · 30yr · 1.5% tax · 5.0% vac · 8.0% maint · 8.0% mgmt
Financing live
Cash to close
- Down payment
- $49,750
- Closing costs
- $5,970
- Reserves months
- —
- Total cash needed
- —
Loan-product check · same deal, 3 products live
Conventional
25% down · 7.5% · 30yr
- Down + closing
- —
- Monthly P&I
- —
- Monthly cashflow
- —
- DSCR
- —
- Eligible?
- —
Personal DTI + credit; lowest rate.
DSCR
20% down · 8.5% · 30yr
- Down + closing
- —
- Monthly P&I
- —
- Monthly cashflow
- —
- DSCR
- —
- Eligible?
- —
No personal income docs; deal must DSCR.
Hard money
10% down · 12.0% · 12mo
- Down + closing
- —
- Monthly P&I
- —
- Monthly cashflow
- —
- DSCR
- —
- Eligible?
- —
Short-term bridge; refi at stabilization.
Rent comps 15 comps
| Address | Beds | Baths | Sqft | Rent | $/sqft | DOM | Units | Dist |
|---|---|---|---|---|---|---|---|---|
| 800 W Pasadena Blvd Deer Park, TX | 3.0 | 1.0–2.0 | 965 | $2,510 | $2.60 | 1d | 22 | 0.35mi |
| 4311 Glenwood Ave Deer Park, TX | 2.0 | 2.0 | 1028 | $1,001 | $0.97 | 43d | 1 | 0.42mi |
| 500 W Pasadena Blvd Deer Park, TX | 2.0–4.0 | 2.0–3.0 | 1300 | $2,030 | $1.56 | 1d | 25 | 0.58mi |
| 510 W Pasadena Blvd Deer Park, TX | 2.0 | 2.0 | 1125 | $1,476 | $1.31 | 43d | 1 | 0.58mi |
| 407 McDermott St Deer Park, TX | 2.0 | 2.0 | 1025 | $1,220 | $1.19 | 43d | 1 | 0.59mi |
| 401 McDermott St Deer Park, TX | 1.0–2.0 | 1.0–2.0 | 940 | $1,585 | $1.69 | 5d | 13 | 0.61mi |
| 401 W Pasadena Blvd Deer Park, TX | 1.0–3.0 | 1.0–2.0 | 1038 | $2,090 | $2.01 | 1d | 21 | 0.66mi |
| 6565 Spencer Hwy Unit 6598 Pasadena, TX | 3.0 | 2.0 | 1200 | $1,602 | $1.33 | 2d | 1 | 0.76mi |
| 1803 Weeping Oaks Pasadena, TX | 3.0 | 3.0 | 1833 | $1,895 | $1.03 | 43d | 1 | 0.79mi |
| 1817 New Orleans St Deer Park, TX | 3.0 | 2.0 | 1798 | $2,240 | $1.25 | 24d | 1 | 0.85mi |
| 7201 Spencer Hwy Pasadena, TX | 1.0–3.0 | 1.0–2.0 | 925 | $1,600 | $1.73 | 43d | 18 | 1.02mi |
| 722 E Brown Ln Deer Park, TX | 3.0 | 2.0 | 1349 | $1,844 | $1.37 | 24d | 1 | 1.28mi |
| 1516 Sam Houston Pkwy Pasadena, TX | 1.0–3.0 | 1.0–2.0 | 943 | $1,600 | $1.70 | 43d | 1 | 1.35mi |
| 7912 Spencer Hwy Pasadena, TX | 2.0 | 2.0 | 950 | $950 | $1.00 | 43d | 1 | 1.43mi |
| 5939 Ollia Cir Pasadena, TX | 3.0 | 2.0 | 1515 | $2,015 | $1.33 | 24d | 1 | 1.46mi |
Listing history 22 events
-
2026-06-15days on market $199,000 Pending 52 DOM
-
2026-06-13days on market $199,000 Pending 50 DOM
-
2026-06-09days on market $199,000 Pending 46 DOM
-
2026-06-08statusdays on market $199,000 Pending 45 DOM
-
2026-06-07days on market $199,000 Active 44 DOM
-
2026-06-04days on market $199,000 Active 41 DOM
-
2026-06-02days on market $199,000 Active 39 DOM
-
2026-06-01days on market $199,000 Active 38 DOM
-
2026-05-31days on market $199,000 Active 37 DOM
-
2026-05-14price $204,900 636-char remark
-
2026-04-24$209,900 Active 636-char remark
-
2019-11-18status Pending
-
2019-11-07status Option Pending
-
2019-11-06historical
-
2019-11-01price $155,000
-
2019-10-04$160,000 Active
-
2017-07-31soldstatus
-
2017-07-27soldstatus Sold
Show marketing remark (145 chars)
This 1,330 square foot house sits on a 7,020 square foot lot and features 3 bedrooms, Game room and 2 bathrooms. Recently updated. It won't last!
-
2017-06-12status Pending
Show marketing remark (145 chars)
This 1,330 square foot house sits on a 7,020 square foot lot and features 3 bedrooms, Game room and 2 bathrooms. Recently updated. It won't last!
-
2017-06-04status Option Pending
Show marketing remark (145 chars)
This 1,330 square foot house sits on a 7,020 square foot lot and features 3 bedrooms, Game room and 2 bathrooms. Recently updated. It won't last!
-
2017-06-04$125,000 Active
Show marketing remark (145 chars)
This 1,330 square foot house sits on a 7,020 square foot lot and features 3 bedrooms, Game room and 2 bathrooms. Recently updated. It won't last!
-
1988-01-02soldstatus
ⓘ Source: listings_history table (triggers on properties + properties_extension) + one-shot
backfill from property_details.listing_events for pre-trigger history.
Tax reassessment forecast TX · Resets to sale price
- Current annual tax
- $5,206 · $434/mo
- Projected year-2 tax
- $5,206 · $434/mo
- Expected delta
- $0/yr ($0/mo · 0.0%)
ⓘ Screening estimate from a state-policy table — verify with the county assessor before closing.
Climate risk First Street
- Flood 1/10 Low FEMA zone X (unshaded) · 0% chance over 30 yrs
- Wildfire 1/10 Low
- Heat 9/10 Extreme 7 d/yr ≥108°F today · 22 d/yr by 30 yrs out
- Wind 9/10 Extreme 99% chance of damaging wind over 30 yrs
- Air quality 2/10 Low 2 unhealthy d/yr today · 2 by 30 yrs out
Nearby sold comps map
Loading sold comps map…
Walkable amenities ~0.75 mi
Loading nearby amenities…
Taxation est. · year 1
- Rental income
- $21,801
- − Mortgage interest
- −$11,147
- − Property taxes
- −$5,206
- − Insurance
- −$995
- − Repairs & maintenance
- −$1,744
- − Management
- −$1,744
- − Depreciation
- −$5,789
- Taxable loss
- −$4,825
- Est. tax savings @ 24.0%
- +$1,158
- After-tax cash flow
- $-344/yr
For passive investors: Depreciation is non-cash, so a rental often shows a tax loss while cash-flowing — sheltering income. Rental losses are passive: they offset passive income freely, and up to $25,000/yr can offset ordinary (W-2) income if you actively participate and your MAGI is under $100k (phasing out to $0 by $150k); unused losses carry forward. On sale, claimed depreciation is recaptured at up to 25%, and gains may owe capital-gains tax (a 1031 exchange can defer both). Figures are a year-1 estimate at your 24.0% rate — not tax advice; consult a CPA.
Schools (NCES district)
- District
- Deer Park ISD
- NCES district ID
- 4816530
- Math proficiency
- 50% ▼ -10.00%
- Reading proficiency
- 47% ▼ -3.00%
- Median HH income
- $68,227
- Composite
- 43.3/100
- National rank
- #3039
- State rank
- #170 of 826 in TX
Livability — Deer Park
- Score
- 72/100
- State rank
- #244
- US rank
- #5835
Category grades
Schools grade is shown separately in the Schools card above.
Census & demographics
- Census place
- Deer Park, TX
- County
- Harris County · 4,702,590 people
- City population
- 33,174
- Metro
- Houston-The Woodlands-Sugar Land, TX
- Population (ZIP)
- 33,174
- Household income
- $102,045
- Rent vs Own
- Severe rent burden
- 583.0
Population outlook (Harris County) Hauer SSP2
- Today (2025)
- 5,571,493 people
- By 2030
- 6,089,821 · +9.3%
- By 2040
- 7,142,806 · +28.2%
- By 2050
- 8,185,864 · +46.9%
- By 2075
- 10,574,329 · +89.8%
- By 2100
- 12,109,958 · +117.4%
Race, ethnicity, and origin ACS 2023
- Neighborhood character
- Majority White (58%)
- Race & ethnicity
- White 58% Hispanic / Latino 36% Two or more races 15% Black 3% Native American 1%
- Hispanic origin (detail)
- Mexican 33%
- Common ancestry
- Italian 3% Slovak 2% Lithuanian 2%
- Foreign-born
- 7% · Canada
- Languages at home
- 83% English-only · Spanish 17%
Political lean MEDSL · Harris
- 2024 margin
- Lean D (+5.5) · D 52.0% · R 46.4% · Other 1.6%
- 2008→2024 swing
- +3.9pp toward D · 2008: 1.6pp · 2024: 5.5pp
- All cycles
- 2024: D+5.5 2020: D+13.3 2016: D+12.4 2012: D+0.1 2008: D+1.6
Not yet ingested
- Civics
- —
Market trends
- HPI YoY
- ▼ -83.30%
- Current HPI
- 253.1973
- Rent YoY
- ▲ 2.26%
- Metro
- Houston-The Woodlands-Sugar Land, TX
- State GDP YoY
- ▲ 3.95%
- F500 in state
- 110
Industry mix (Fortune 500 HQ in TX)
| Industry | F500 HQs | Revenue |
|---|---|---|
| Energy | 16 | $1,198B |
|
||
| Technology | 5 | $198B |
|
||
| Engineering / Construction | 4 | $72B |
|
||
| Energy Services | 3 | $60B |
|
||
| Utilities | 3 | $41B |
|
||
| Healthcare | 2 | $330B |
|
||
Price history
+59.2% since first listed16 events — show timeline
- 2026-06-16 Pending — HARMLS
- 2026-06-08 Pending — HARMLS
- 2026-05-27 Price Changed $199,000 HARMLS
- 2026-05-14 Price Changed $204,900 HARMLS
- 2026-04-24 Listed $209,900 HARMLS
- 2019-11-18 Pending — HARMLS
- 2019-11-07 Pending — HARMLS
- 2019-11-06 Listing Removed — HARMLS
- 2019-11-01 Price Changed $155,000 HARMLS
- 2019-10-04 Listed $160,000 HARMLS
- 2017-07-31 Sold (Public Records) — Public Records
- 2017-07-27 Sold (MLS) — HARMLS
- 2017-06-12 Pending — HARMLS
- 2017-06-04 Pending — HARMLS
- 2017-06-04 Listed $125,000 HARMLS
- 1988-01-02 Sold (Public Records) — Public Records
Property tax history
+7.8%/yrLatest (2025): $5,206 · +8.4% YoY. Source: county tax records.
Cash-flow waterfall
monthlySold comps — $/sqft
last 12 mo · ≤1 miLoading sold comps…