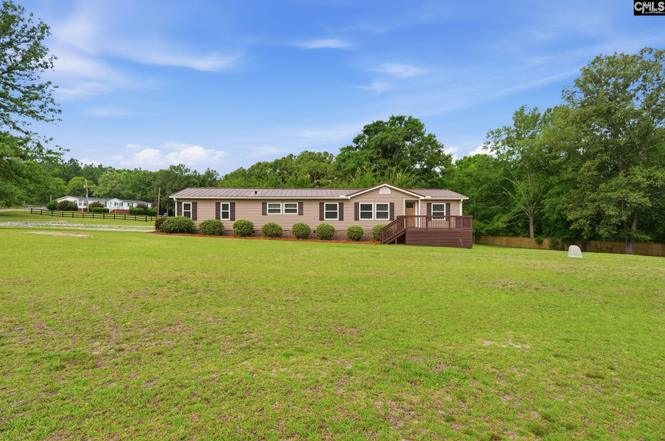
1463 Spears Creek Rd · Columbia, SC
Flood risk 1/10 · Minimal
- FEMA flood zone
- X (unshaded)
- Chance of flooding over 30 yrs
- 0.0%
- Est. flood insurance / yr
- $507 – $1,088
Fire risk 6/10 · Moderate
- Est. fire insurance / yr
- $783 – $1,453
Heat risk 7/10 · Major
- Hot days now (above 107°F)
- 7 days/yr
- Hot days in 30 yrs
- 16 days/yr
Wind risk 7/10 · Major
- Chance of severe wind over 30 yrs
- 78.0%
Air-quality risk 2/10 · Minimal
- Unhealthy air days now
- 2 days/yr
- Unhealthy air days in 30 yrs
- 2 days/yr
Risk factors via First Street. Map © Google.
Why this score? — see what drove the D grade
The composite is a weighted blend of 9 inputs, each scored 0–100. Each bar is that input's sub-score; the figure is the points it added to the 100-point composite (weight × sub-score).
- Cash flow +14.0/30.0
- ARV discount +7.5/15.0
- DSCR +4.2/10.0
- Livability +3.9/5.0
- Schools +3.8/10.0
- 1% rule +2.6/10.0
- Rent growth +2.5/5.0
- Condition / age +2.5/5.0
- Appreciation +0.0/10.0
$295,500
🖨 Deal sheet (PDF) 📄 Offer letter ✓ Due diligence
Listing remarks
One-of-a-Kind Country Retreat on Over 3 Acres with NO HOA! This beautiful one-story home is the perfect blend of privacy, space, and modern updates with low Kershaw County taxes. Situated on over 3 acres, this 4 bedroom, 2.5-bath home is packed with unique features and recent improvements. Step inside to an inviting open-concept floor plan featuring stunning cedar beam ceilings in the living room, dining area, and kitchen. Hardwood floors flow throughout the main living spaces, and the bedrooms provide comfort with carpeting. Sheetrock walls throughout provide a finished look, and the oversized living room provides plenty of space for entertaining, relaxing, or creating a shared office
Key facts
- Laundry room
- Over 3 acres
- Cedar beam ceilings
Tags
Property features AI
Finance
- Other: Approximately 3.01 acres; Dirt road access; Built-ins
Exterior
- Parking: 15 total parking spaces; 7 garage spaces; Detached carport (main level garage)
- Utilities: Private well water; Septic sewer
- Home design: Single-story home
- Construction: Crawlspace foundation
- Exterior features: Vinyl exterior; Front uncovered porch; Covered back porch; Full gutters; Shed; Workshop; Irrigation well; Partial wood privacy fence
Interior
- Kitchen: Hardwood floor; Center island; Pantry; Formica countertops; Wood cabinets
- Bedrooms: Master suite with French doors, his-and-hers closets, private bath, separate shower, box ceilings, and hardwood floors (main level); Three additional bedrooms with ceiling fans, private closets, and carpeted floors (main level)
- Flooring: Hardwood in main living areas and master bedroom; carpet in secondary bedrooms
- Bathrooms: Two full baths and one half bath
- Heating & cooling: Central heating; Central cooling
- Interior features: Ceiling fan throughout
- Laundry & utility: Main-level laundry in a common/mud/utility room
Neighborhood map
What this means for you Summary
Snapshot
- This is a 4-bed/2.5-bath manufactured listed at $296k.
Deal economics
- At list price, monthly cash flow is $38 ($458/yr) — positive.
- The deal already cash-flows at list — no discount required.
- To meet the 1% rule (rent ≥ 1% of price), the offer needs to be $223k (24.4% below list).
- Recommended offer: $223k (24.4% below list) — sets the bar for 1% rule.
- Cap rate 6.4% vs local median 5.0% in Columbia — meaningfully above typical; check what's discounted (condition, days-on-market, listing class) to confirm the premium yield is real.
Location & tenants
- Location reads 78/100 on livability (#18 in SC, #2,436 nationally) — a middle-class / working-renter tenant base. Strengths: amenities A+, commute A+, cost of living A+; Watch: employment D, crime F.
- Kershaw 01 (rural): math 38% / reading 51% proficiency, ranked #25 of 80 in SC (top 31%) — families likely to look elsewhere, expect single-tenant / working-renter base with shorter leases.
- Zoned schools: Lugoff-Elgin High (math 65% / reading 89%, grade A-, #28 of 196 statewide, top 16%, 1,744 students, 62% FRL).
- Zoned-school proficiency averages 77% at this address vs 44% district-wide (+32 pts) — the actual schools serving this property are materially stronger than the Kershaw 01 average implies; a family-tenant draw the district grade alone would hide.
- Market conditions: 178 active listings in the ZIP; 1 comparable units currently listed for rent nearby; 491 units permitted in Kershaw County in 2024 (0 in 5+ unit buildings).
- This rent runs 40% of the median local income ($68k/yr) — at the standard rent-burdened threshold; future hikes will face affordability resistance.
Forward outlook
- Local home prices are declining (-3.0%/yr); year-one equity from $2k of loan paydown is wiped out by about $9k of value loss. Plan a longer hold.
- Kershaw County population projected at +8% by 2050 — modest demand growth; plan on rents tracking national, not racing it.
Negotiation context
- Only 4 days on market — expect competitive offers; lowballing is unlikely to land.
- Current owner paid $145k; list at $296k implies a 104% gain — meaningful room to come down on a strong offer.
Risks & watch-outs
- Climate carrying-cost: major wind risk, 78% chance of damaging wind over 30y; major wildfire risk; extreme-heat days projected 7→16/yr by 2055 (HVAC capex compounding) — expect insurance premiums to compound above CPI over the hold.
Questions for the listing agent
- Is there a deadline driving the sale (1031 exchange, divorce, estate, relocation)? That informs how much negotiation room exists.
- Schools are D-rated, which usually means shorter tenancies and higher turnover. Who's the typical renter profile here, and what's been the actual vacancy rate?
- Crime grade is F in this area — have there been break-ins, vandalism, or insurance claims at this property in the last 3 years? What carrier currently insures it and at what premium?
- The area grade is low — what's the realistic commute time and amenity access for the typical tenant pool here? Any planned neighborhood developments (good or bad) we should know about?
- What's the average days-on-market for RENTAL listings here right now (not sales)? A rising rental-DOM trend means longer vacancies and softer asking-rent achievability than the comps imply.
- What's the recent tenant-quality profile in this submarket — average credit score on applications, eviction rate, late-payment / NSF rate, and stable-employment percentage? A property-management company in the area should have these aggregated.
- How much new for-sale + rental construction is in the pipeline within 1–3 miles? Heavy new supply typically softens prices + rents 12–24 months out; constrained supply supports both.
Investment metrics
- 1% rule
- 0.76% ✗
- Cap rate
- 6.45%
- Cash-on-cash
- 0.55%
- DSCR
- 1.02
- GRM
- 11.0
CMA / ARV
No comps found within radius.
Projected returns pro-forma
-3.0% appreciation · 3.0% rent growth · sell at horizon
- IRR
- -15.5%
- Equity multiple
- 0.45×
- Total profit
- $-45,610
- Equity at exit
- $44,060
- IRR
- -7.1%
- Equity multiple
- 0.55×
- Total profit
- $-37,233
- Equity at exit
- $25,549
Cash invested: $82,740 (down + closing). Projections, not guarantees.
Landlord ↔ Tenant lean methodology
- Overall (STATE)
- 90 Strongly Landlord-Friendly
- State South Carolina
- 90 Strongly Landlord-Friendly · R+6
- County
- — inherits STATE
- City
- — inherits STATE
ZIP-level market 29078
- Home prices YoY
- -22.9%
- Active inventory
- 178
- Price-to-rent
- 11.0×
Monthly cashflow live
- Estimated rent
- $2,234 medium interval (Pro) →
- Mortgage (P&I)
- −$1,550
- Tax from tax record
- −$54 /mo · $651/yr
- Insurance
- −$123
- HOA
- −$0
- Vacancy / Maint / Mgmt
- −$469
- Net cashflow
- $38
Break-even live
Sensitivity live
| Price | -10% $205 | -5% $122 | +0% $38 | +5% $-45 | +10% $-129 |
|---|---|---|---|---|---|
| Rent | -10% $-138 | -5% $-50 | +0% $38 | +5% $126 | +10% $215 |
| Rate | -1.0pp $187 | -0.5pp $113 | base $38 | +0.5pp $-38 | +1.0pp $-116 |
UW: 25.0% down · 7.5% · 30yr · 1.5% tax · 5.0% vac · 8.0% maint · 8.0% mgmt
Financing live
Cash to close
- Down payment
- $73,875
- Closing costs
- $8,865
- Reserves months
- —
- Total cash needed
- —
Loan-product check · same deal, 3 products live
Conventional
25% down · 7.5% · 30yr
- Down + closing
- —
- Monthly P&I
- —
- Monthly cashflow
- —
- DSCR
- —
- Eligible?
- —
Personal DTI + credit; lowest rate.
DSCR
20% down · 8.5% · 30yr
- Down + closing
- —
- Monthly P&I
- —
- Monthly cashflow
- —
- DSCR
- —
- Eligible?
- —
No personal income docs; deal must DSCR.
Hard money
10% down · 12.0% · 12mo
- Down + closing
- —
- Monthly P&I
- —
- Monthly cashflow
- —
- DSCR
- —
- Eligible?
- —
Short-term bridge; refi at stabilization.
Rent comps 1 comps
| Address | Beds | Baths | Sqft | Rent | $/sqft | DOM | Units | Dist |
|---|---|---|---|---|---|---|---|---|
| 71 Carina Ln Lugoff, SC | 5.0 | 3.0 | 2456 | $2,500 | $1.02 | 3d | 1 | 0.26mi |
Listing history 4 events
-
2026-06-16statusdays on market $295,500 Pending 4 DOM
-
2026-06-15days on market $295,500 Active 3 DOM
-
2026-06-14remarks 699-char remark
-
2026-06-14$295,500 Active 1 DOM
ⓘ Source: listings_history table (triggers on properties + properties_extension) + one-shot
backfill from property_details.listing_events for pre-trigger history.
Tax reassessment forecast SC · Resets to sale price
- Current annual tax
- $651 · $54/mo
- Projected year-2 tax
- $1,684 · $140/mo
- Expected delta
- +$1,033/yr (+$86/mo · 158.6%)
ⓘ Screening estimate from a state-policy table — verify with the county assessor before closing.
Climate risk First Street
- Flood 1/10 Low FEMA zone X (unshaded) · 0% chance over 30 yrs
- Wildfire 6/10 Major
- Heat 7/10 Severe 7 d/yr ≥107°F today · 16 d/yr by 30 yrs out
- Wind 7/10 Severe 78% chance of damaging wind over 30 yrs
- Air quality 2/10 Low 2 unhealthy d/yr today · 2 by 30 yrs out
Nearby sold comps map
Loading sold comps map…
Walkable amenities ~0.75 mi
Loading nearby amenities…
Taxation est. · year 1
- Rental income
- $26,814
- − Mortgage interest
- −$16,553
- − Property taxes
- −$651
- − Insurance
- −$1,478
- − Repairs & maintenance
- −$2,145
- − Management
- −$2,145
- − Depreciation
- −$8,596
- Taxable loss
- −$4,754
- Est. tax savings @ 24.0%
- +$1,141
- After-tax cash flow
- $1,599/yr
For passive investors: Depreciation is non-cash, so a rental often shows a tax loss while cash-flowing — sheltering income. Rental losses are passive: they offset passive income freely, and up to $25,000/yr can offset ordinary (W-2) income if you actively participate and your MAGI is under $100k (phasing out to $0 by $150k); unused losses carry forward. On sale, claimed depreciation is recaptured at up to 25%, and gains may owe capital-gains tax (a 1031 exchange can defer both). Figures are a year-1 estimate at your 24.0% rate — not tax advice; consult a CPA.
Schools (NCES district)
- District
- Kershaw 01
- NCES district ID
- 4502550
- Math proficiency
- 38% ▼ -7.00%
- Reading proficiency
- 51% ▲ 6.00%
- Median HH income
- $44,585
- Composite
- 37.66/100
- National rank
- #4371
- State rank
- #25 of 80 in SC
Livability — Columbia
- Score
- 78/100
- State rank
- #18
- US rank
- #2436
Category grades
Schools grade is shown separately in the Schools card above.
Census & demographics
- County
- Kershaw County · 47,655 people
- City population
- 335,994
- Metro
- Columbia, SC
- Population (ZIP)
- 16,283
- Household income
- $67,727
- Rent vs Own
- Severe rent burden
- 61.0
Population outlook (Kershaw County) Hauer SSP2
- Today (2025)
- 67,683 people
- By 2030
- 69,374 · +2.5%
- By 2040
- 71,936 · +6.3%
- By 2050
- 73,292 · +8.3%
- By 2075
- 75,762 · +11.9%
- By 2100
- 72,620 · +7.3%
Race, ethnicity, and origin ACS 2023
- Neighborhood character
- Predominantly White (74%)
- Race & ethnicity
- White 74% Black 18% Hispanic / Latino 6% Two or more races 4%
- Hispanic origin (detail)
- Puerto Rican 3%
- Common ancestry
- Italian 2% Lithuanian 2% Slovak 1%
- Foreign-born
- 2% · Canada
- Languages at home
- 93% English-only · Spanish 6%
Political lean MEDSL · Kershaw
- 2024 margin
- Strong R (+28.2) · D 35.3% · R 63.5% · Other 1.2%
- 2008→2024 swing
- -9.5pp toward R · 2008: -18.7pp · 2024: -28.2pp
- All cycles
- 2024: R+28.2 2020: R+23.1 2016: R+24.8 2012: R+18.6 2008: R+18.7
Not yet ingested
- Civics
- —
Market trends
- HPI YoY
- ▼ -62.83%
- Current HPI
- 211.3661
- Rent YoY
- —
- Metro
- Columbia, SC
- State GDP YoY
- ▲ 4.51%
- F500 in state
- 2
Industry mix (Fortune 500 HQ in SC)
| Industry | F500 HQs | Revenue |
|---|---|---|
| Packaging | 1 | $7B |
|
||
Price history
+103.8% since first listed2 events — show timeline
- 2026-06-12 Listed $295,500 Consolidated MLS
- 2020-10-07 Sold (Public Records) $145,000 Public Records
Property tax history
+14.4%/yrLatest (2024): $651 · -0.5% YoY. Source: county tax records.
Cash-flow waterfall
monthlySold comps — $/sqft
last 12 mo · ≤1 miLoading sold comps…