 Duplex
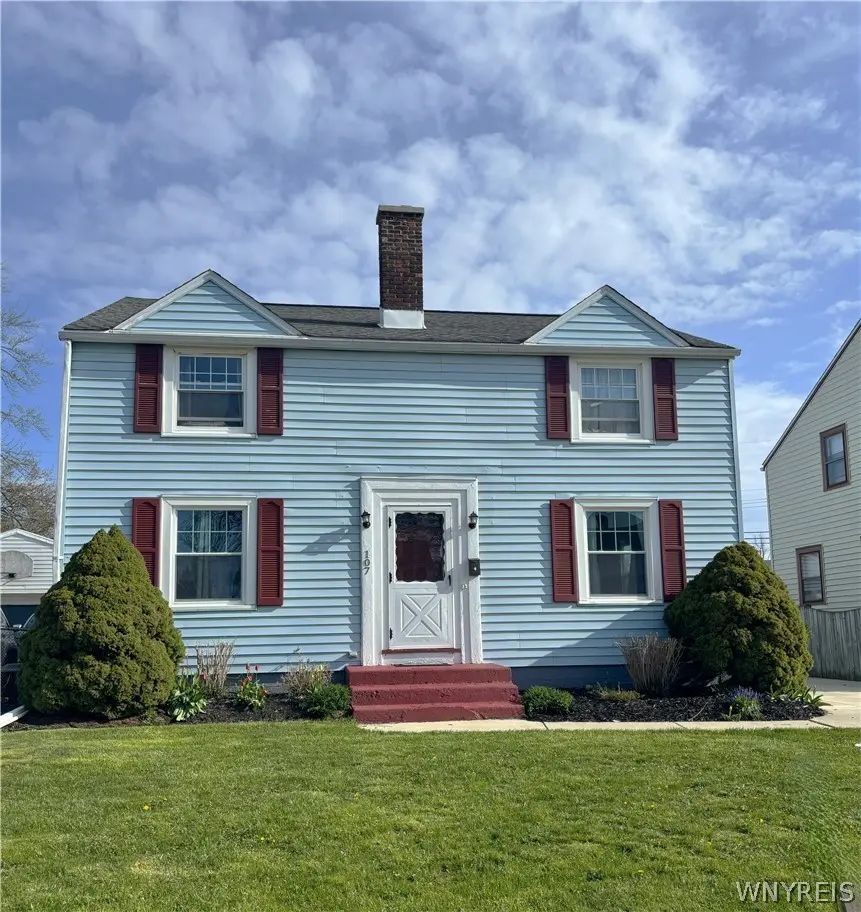
107 Fowler Ave · Tonawanda Town, NY
Flood risk 1/10 · Minimal
- FEMA flood zone
- X (unshaded)
- Chance of flooding over 30 yrs
- 0.0%
- Est. flood insurance / yr
- $473 – $860
Fire risk 1/10 · Minimal
- Est. fire insurance / yr
- $691 – $1,283
Heat risk 3/10 · Minor
- Hot days now (above 92°F)
- 7 days/yr
- Hot days in 30 yrs
- 15 days/yr
Wind risk 1/10 · Minimal
- Chance of severe wind over 30 yrs
- —
Air-quality risk 3/10 · Minor
- Unhealthy air days now
- 3 days/yr
- Unhealthy air days in 30 yrs
- 4 days/yr
Risk factors via First Street. Map © Google.
Why this score? — see what drove the D grade
The composite is a weighted blend of 9 inputs, each scored 0–100. Each bar is that input's sub-score; the figure is the points it added to the 100-point composite (weight × sub-score).
- Cash flow +13.8/30.0
- ARV discount +6.3/15.0
- Rent growth +4.9/5.0
- 1% rule +4.5/10.0
- DSCR +4.2/10.0
- Schools +3.9/10.0
- Livability +2.5/5.0
- Condition / age +2.5/5.0
- Appreciation +0.0/10.0
$299,900
🖨 Deal sheet (PDF) 📄 Offer letter ✓ Due diligence
Multi-family units
County records classify this as Multi-Family (2-4 Unit). Listing-text estimate: 2 units. confirmed
Listing remarks MLS
Maintenance free vinyl sided 3/2 duplex with 2.5 car garage on fully fenced lot. Owners side has built on addition with half bath that can serve as either a third bedroom or den. Great mechanic's with two new furnaces and owner side a/c(2012). Updated electrical boxes. Copper plumbing. Many newer windows thru-out. Hardwood floors. Enclosed mudroom off back entrance hallway. Overhead storage in the garage. Basement has storage units along with small finished office. Garage roof 2013.
Key facts
- Quiet street
- New chimney
- Newer driveway
Tags
Property features AI
Finance
- Other: Owner/responsibility and rent include details: see remarks
- Financial info: Two total units in the building; Operating expense details: see remarks
Exterior
- Parking: Garage with approximately 2.5-car capacity; Additional parking with two or more spaces
- Utilities: Public water (connected); Sewer connected; Electric service with circuit breakers
- Home design: Two-story multifamily property; Resale condition
- Construction: Vinyl siding; Asphalt roof; Block foundation; Existing (previously built) structure
- Exterior features: Rectangular residential lot (approx. 49 x 110); City street frontage
Interior
- Kitchen: Eat-in kitchens in each unit
- Bedrooms: Two 2-bedroom units (each unit has 2 bedrooms)
- Flooring: Carpet; Hardwood; Varies by area
- Bathrooms: Unit configurations include full and half baths: one unit with 1 full bath; the other unit with 1 full bath and 1 half bath
- Heating & cooling: Gas forced-air heating; Central air conditioning
- Interior features: Full basement; Varied flooring including carpet and hardwood
- Laundry & utility: Gas water heater; Separate gas and electric meters for each unit
Neighborhood map
What this means for you Summary
Snapshot
- This is a 2 × 2-bed/1-bath units multifamily listed at $300k.
Deal economics
- At list price, monthly cash flow is $28 ($331/yr) — positive. Per door: $14/mo.
- The deal already cash-flows at list — no discount required.
- To meet the 1% rule (rent ≥ 1% of price), the offer needs to be $284k (5.3% below list).
- Recommended offer: $284k (5.3% below list) — sets the bar for 1% rule.
- Cap rate 6.4% vs local median 4.1% in Tonawanda Town — top-decile yield for the area; either an underpriced asset or a hidden risk that comps aren't pricing in. Stress-test before assuming the spread holds.
Location & tenants
- Location reads: area grade D — affects rentability + tenant quality, not the cash-flow math above.
- Kenmore-Tonawanda Union Free School District (suburban): math 44% / reading 47% proficiency, ranked #453 of 590 in NY (top 77%) — families likely to look elsewhere, expect single-tenant / working-renter base with shorter leases.
- Zoned schools: Herbert Hoover Elementary School (math 37% / reading 52%, grade F, #1,277 of 2,108 statewide, top 64%, 565 students, 43% FRL); Herbert Hoover Middle School (math 24% / reading 39%, grade F, #522 of 729 statewide, top 73%, 758 students, 51% FRL); Kenmore West Senior High School (math 74% / reading 57%, grade B, #773 of 1,100 statewide, top 70%, 1,358 students, 51% FRL) — zoned schools average 48% FRL vs 33% district-wide (15 pts higher); higher-poverty schools than district average — tighter screening recommended.
- Market conditions: Rents rising fast (+9.8%/yr); 102 active listings in the ZIP; 3 comparable units currently listed for rent nearby; rentals at typical pace (median 26d on market — plan ~3-4 weeks tenant-placement turnaround); 1,244 units permitted in Erie County in 2024 (563 in 5+ unit buildings).
- At $2,840/mo this rent would consume 46% of the median local household income ($74k/yr) (locally 727% of renters already pay >50% of income on rent) — very limited rent-growth headroom before tenants either downsize or default.
Forward outlook
- Local home prices are declining (-3.0%/yr); year-one equity from $2k of loan paydown is wiped out by about $9k of value loss. Plan a longer hold.
Negotiation context
- It's been on market 20 days — a 2% lower offer ($295k) is reasonable based on typical stale-listing flexibility.
- 2 sale attempts since 13y ago with the ask held roughly flat each time — persistent listings suggest the price (not the market) is what's stuck; bring a comps-based counter.
- Current owner paid $110k; list at $300k implies a 173% gain — meaningful room to come down on a strong offer.
Risks & watch-outs
- Watch-outs: built in 1944 — expect roof / HVAC / electrical / plumbing capex.
Questions for the listing agent
- Can we see the unit-by-unit rent roll, current vacancy, and any below-market leases? What's the average tenancy length?
- What capital expenditures (roof, boiler, parking lot, exteriors) have been made in the last 5 years, and what's planned in the next 2?
- Built in 1944 — when were the roof, HVAC, electrical panel, plumbing, and water heater last replaced?
- Is there a deadline driving the sale (1031 exchange, divorce, estate, relocation)? That informs how much negotiation room exists.
- The area grade is low — what's the realistic commute time and amenity access for the typical tenant pool here? Any planned neighborhood developments (good or bad) we should know about?
- What's the average days-on-market for RENTAL listings here right now (not sales)? A rising rental-DOM trend means longer vacancies and softer asking-rent achievability than the comps imply.
- What's the recent tenant-quality profile in this submarket — average credit score on applications, eviction rate, late-payment / NSF rate, and stable-employment percentage? A property-management company in the area should have these aggregated.
- How much new apartment / multifamily construction is in the pipeline within 1–3 miles? Heavy new supply (>2% of stock underway) typically softens rents 12–24 months out; light construction supports rent growth.
Investment metrics
- 1% rule
- 0.95% ✗
- Cap rate
- 6.40%
- Cash-on-cash
- 0.39%
- DSCR
- 1.02
- GRM
- 8.8
CMA / ARV
- ARV (on-the-fly)
- $292,336
- Comps found
- 12
Show comp detail 12 sales within ~0.75 mi
| Address | Dist | Beds/Ba | Sqft | Sold | Price | $/sf | Match |
|---|---|---|---|---|---|---|---|
| 186 Pullman Ave | 0.17mi | 4/2.0 (-1) | 2,014 (+4%) | 5mo | $328,000 | $163 | 75 |
| 371 Hamilton Blvd | 0.24mi | 4/2.0 (-1) | 1,968 (+2%) | 8mo | $300,000 | $152 | 73 |
| 86 Pullman Ave | 0.09mi | 4/2.0 (-1) | 1,792 (-7%) | 6mo | $315,000 | $176 | 71 |
| 175 W Girard Blvd | 0.27mi | 4/2.0 (-1) | 2,002 (+3%) | 7mo | $265,000 | $132 | 69 |
| 165 Tremont Ave | 0.49mi | 4/2.0 (-1) | 1,896 (-2%) | 1mo | $331,000 | $175 | 66 |
| 87 Eiseman Ave | 0.44mi | 4/2.0 (-1) | 2,012 (+4%) | 5mo | $133,000 | $66 | 62 |
| 310 Kinsey Ave | 0.31mi | 5/2.0 | 2,122 (+10%) | 8mo | $320,000 | $151 | 60 |
| 175 Mayville Ave | 0.17mi | 4/2.0 (-1) | 1,674 (-14%) | 5mo | $225,000 | $134 | 58 |
| 374 Victoria Blvd | 0.59mi | 4/2.0 (-1) | 1,832 (-5%) | 8mo | $235,522 | $129 | 50 |
| 87 Tulane Rd | 0.45mi | 4/2.0 (-1) | 2,178 (+12%) | 3mo | $250,000 | $115 | 49 |
| 379 Victoria Blvd | 0.56mi | 4/2.0 (-1) | 1,764 (-9%) | 6mo | $285,606 | $162 | 47 |
| 92 Tremont Ave | 0.61mi | 4/2.0 (-1) | 2,160 (+12%) | 5mo | $240,000 | $111 | 41 |
Match score weights: distance 35% · size 25% · config 20% · recency 20%. Top-matched comps best support the ARV.
Projected returns pro-forma
-3.0% appreciation · 8.0% rent growth · sell at horizon
- IRR
- -9.8%
- Equity multiple
- 0.62×
- Total profit
- $-31,703
- Equity at exit
- $44,716
- IRR
- 5.7%
- Equity multiple
- 1.52×
- Total profit
- $43,496
- Equity at exit
- $25,930
Cash invested: $83,972 (down + closing). Projections, not guarantees.
Landlord ↔ Tenant lean methodology
- Overall (STATE)
- 15 Strongly Tenant-Friendly
- State New York
- 15 Strongly Tenant-Friendly · D+10
- County
- — inherits STATE
- City
- — inherits STATE
ZIP-level market 14217
- Home prices YoY
- -34.3%
- Rents YoY
- 9.8%
- Active inventory
- 102
- Price-to-rent
- 17.6×
Monthly cashflow live
- Estimated rent
- $2,840 high interval (Pro) →
- Mortgage (P&I)
- −$1,573
- Tax from tax record
- −$518 /mo · $6,221/yr
- Insurance
- −$125
- HOA
- −$0
- Vacancy / Maint / Mgmt
- −$596
- Net cashflow
- $28
Break-even live
Sensitivity live
| Price | -10% $197 | -5% $112 | +0% $28 | +5% $-57 | +10% $-142 |
|---|---|---|---|---|---|
| Rent | -10% $-197 | -5% $-85 | +0% $28 | +5% $140 | +10% $252 |
| Rate | -1.0pp $179 | -0.5pp $104 | base $28 | +0.5pp $-50 | +1.0pp $-129 |
2-unit breakdown (identical units grouped — click to expand)
| Units | Beds | Baths | Est. rent |
|---|---|---|---|
| 2× units | 2 | 1 | $2,840 |
| #1 | 2 | 1 | $1,420 |
| #2 | 2 | 1 | $1,420 |
| Total (2 units) | $2,840 | ||
UW: 25.0% down · 7.5% · 30yr · 1.5% tax · 5.0% vac · 8.0% maint · 8.0% mgmt
Financing live
Cash to close
- Down payment
- $74,975
- Closing costs
- $8,997
- Reserves months
- —
- Total cash needed
- —
Loan-product check · same deal, 3 products live
Conventional
25% down · 7.5% · 30yr
- Down + closing
- —
- Monthly P&I
- —
- Monthly cashflow
- —
- DSCR
- —
- Eligible?
- —
Personal DTI + credit; lowest rate.
DSCR
20% down · 8.5% · 30yr
- Down + closing
- —
- Monthly P&I
- —
- Monthly cashflow
- —
- DSCR
- —
- Eligible?
- —
No personal income docs; deal must DSCR.
Hard money
10% down · 12.0% · 12mo
- Down + closing
- —
- Monthly P&I
- —
- Monthly cashflow
- —
- DSCR
- —
- Eligible?
- —
Short-term bridge; refi at stabilization.
Rent comps 3 comps
| Address | Beds | Baths | Sqft | Rent | $/sqft | DOM | Units | Dist |
|---|---|---|---|---|---|---|---|---|
| 237 W Girard Blvd Buffalo, NY | 4.0 | 1.5 | 1329 | $4,000 | $3.01 | 25d | 1 | 0.17mi |
| 148 Colonial Ave Buffalo, NY | 4.0 | 2.0 | 1240 | $2,900 | $2.34 | 25d | 1 | 0.78mi |
| 62 Seabrook St Buffalo, NY | 4.0 | 1.0 | 1300 | $2,000 | $1.54 | 3d | 1 | 0.92mi |
Listing history 13 events
-
2026-06-21days on market $299,900 Active 20 DOM
-
2026-06-18days on market $299,900 Active 17 DOM
-
2026-06-17days on market $299,900 Active 16 DOM
-
2026-06-16days on market $299,900 Active 15 DOM
-
2026-06-15days on market $299,900 Active 14 DOM
-
2026-06-13days on market $299,900 Active 12 DOM
-
2026-06-10days on market $299,900 Active 9 DOM
-
2026-06-09days on market $299,900 Active 8 DOM
-
2026-06-08days on market $299,900 Active 7 DOM
-
2026-06-07days on market $299,900 Active 6 DOM
-
2026-06-03days on market $299,900 Active 2 DOM
-
2026-06-02remarks 699-char remark
-
2026-06-02$299,900 Active 1 DOM
ⓘ Source: listings_history table (triggers on properties + properties_extension) + one-shot
backfill from property_details.listing_events for pre-trigger history.
Tax reassessment forecast NY · Partial reset (capped growth)
- Current annual tax
- $6,221 · $518/mo
- Projected year-2 tax
- $6,221 · $518/mo
- Expected delta
- $0/yr ($0/mo · 0.0%)
ⓘ Screening estimate from a state-policy table — verify with the county assessor before closing.
Climate risk First Street
- Flood 1/10 Low FEMA zone X (unshaded) · 0% chance over 30 yrs
- Wildfire 1/10 Low
- Heat 3/10 Moderate 7 d/yr ≥92°F today · 15 d/yr by 30 yrs out
- Wind 1/10 Low
- Air quality 3/10 Moderate 3 unhealthy d/yr today · 4 by 30 yrs out
Nearby sold comps map
Loading sold comps map…
Walkable amenities ~0.75 mi
Loading nearby amenities…
Taxation est. · year 1
- Rental income
- $34,080
- − Mortgage interest
- −$16,799
- − Property taxes
- −$6,221
- − Insurance
- −$1,500
- − Repairs & maintenance
- −$2,726
- − Management
- −$2,726
- − Depreciation
- −$8,724
- Taxable loss
- −$4,616
- Est. tax savings @ 24.0%
- +$1,108
- After-tax cash flow
- $1,438/yr
For passive investors: Depreciation is non-cash, so a rental often shows a tax loss while cash-flowing — sheltering income. Rental losses are passive: they offset passive income freely, and up to $25,000/yr can offset ordinary (W-2) income if you actively participate and your MAGI is under $100k (phasing out to $0 by $150k); unused losses carry forward. On sale, claimed depreciation is recaptured at up to 25%, and gains may owe capital-gains tax (a 1031 exchange can defer both). Figures are a year-1 estimate at your 24.0% rate — not tax advice; consult a CPA.
Schools (NCES district)
- District
- Kenmore-Tonawanda Union Free School District
- NCES district ID
- 3616230
- Math proficiency
- 44% ▼ -12.00%
- Reading proficiency
- 47% ▼ -1.00%
- Median HH income
- $51,433
- Composite
- 39.18/100
- National rank
- #4024
- State rank
- #453 of 590 in NY
Livability — Tonawanda Town
No livability data for this city. (Only ~50 U.S. cities are tracked.)
Census & demographics
- Census place
- Tonawanda Town, NY
- County
- Erie County · 714,559 people
- City population
- 63,948
- Metro
- Buffalo-Cheektowaga, NY
- Population (ZIP)
- 22,471
- Household income
- $73,800
- Rent vs Own
- Severe rent burden
- 727.0
Population outlook (Erie County) Hauer SSP2
- Today (2025)
- 933,037 people
- By 2030
- 935,181 · +0.2%
- By 2040
- 928,531 · -0.5%
- By 2050
- 905,725 · -2.9%
- By 2075
- 834,037 · -10.6%
- By 2100
- 708,033 · -24.1%
Race, ethnicity, and origin ACS 2023
- Neighborhood character
- Predominantly White (82%)
- Race & ethnicity
- White 82% Two or more races 8% Hispanic / Latino 6% Black 5%
- Hispanic origin (detail)
- Puerto Rican 4%
- Common ancestry
- Romanian 13% Italian 2% Slovak 2%
- Foreign-born
- 4% · Canada
- Languages at home
- 94% English-only · Spanish 3% Arabic 1% Russian/Polish/Slavic 1%
Political lean MEDSL · Erie
- 2024 margin
- Lean D (+9.7) · D 54.8% · R 45.2%
- 2008→2024 swing
- -7.9pp toward R · 2008: 17.5pp · 2024: 9.7pp
- All cycles
- 2024: D+9.7 2020: D+14.7 2016: D+4.8 2012: D+15.6 2008: D+17.5
Not yet ingested
- Civics
- —
Market trends
- HPI YoY
- ▼ -172.52%
- Current HPI
- 330.7596
- Rent YoY
- ▲ 9.76%
- Metro
- Buffalo-Cheektowaga, NY
- State GDP YoY
- ▲ 2.60%
- F500 in state
- 92
Industry mix (Fortune 500 HQ in NY)
| Industry | F500 HQs | Revenue |
|---|---|---|
| Financial Services | 10 | $950B |
|
||
| Consumer Goods | 9 | $162B |
|
||
| Insurance | 4 | $225B |
|
||
| Telecommunications | 2 | $144B |
|
||
| Pharmaceuticals | 2 | $112B |
|
||
| Media / Entertainment | 2 | $69B |
|
||
Price history
+203.0% since first listed6 events — show timeline
- 2026-06-01 Listed $299,900 WNYREIS
- 2013-07-19 Sold (Public Records) $110,000 Public Records
- 2013-07-19 Sold (MLS) $110,000 WNYREIS
- 2013-05-01 Listed $107,500 WNYREIS
- 2004-09-29 Sold (Public Records) $86,000 Public Records
- 1995-05-17 Sold (Public Records) $98,969 Public Records
Property tax history
+5.6%/yrLatest (2025): $6,221 · +3.9% YoY. Source: county tax records.
Cash-flow waterfall
monthlySold comps — $/sqft
last 12 mo · ≤1 miLoading sold comps…