210 Wilson St · Delta, MO
Flood risk 1/10 · Minimal
- FEMA flood zone
- X (unshaded)
- Chance of flooding over 30 yrs
- 0.0%
- Est. flood insurance / yr
- $507 – $1,088
Fire risk 3/10 · Minor
- Est. fire insurance / yr
- $1,054 – $1,958
Heat risk 6/10 · Moderate
- Hot days now (above 108°F)
- 7 days/yr
- Hot days in 30 yrs
- 21 days/yr
Wind risk 2/10 · Minimal
- Chance of severe wind over 30 yrs
- 4.0%
Air-quality risk 3/10 · Minor
- Unhealthy air days now
- 3 days/yr
- Unhealthy air days in 30 yrs
- 5 days/yr
Risk factors via First Street. Map © Google.
Why this score? — see what drove the D grade
The composite is a weighted blend of 9 inputs, each scored 0–100. Each bar is that input's sub-score; the figure is the points it added to the 100-point composite (weight × sub-score).
- Cash flow +12.6/30.0
- ARV discount +7.5/15.0
- Appreciation +5.0/10.0
- Condition / age +3.8/5.0
- DSCR +3.7/10.0
- 1% rule +3.6/10.0
- Livability +3.0/5.0
- Schools +2.8/10.0
- Rent growth +2.5/5.0
$149,000
🖨 Deal sheet (PDF) 📄 Offer letter ✓ Due diligence
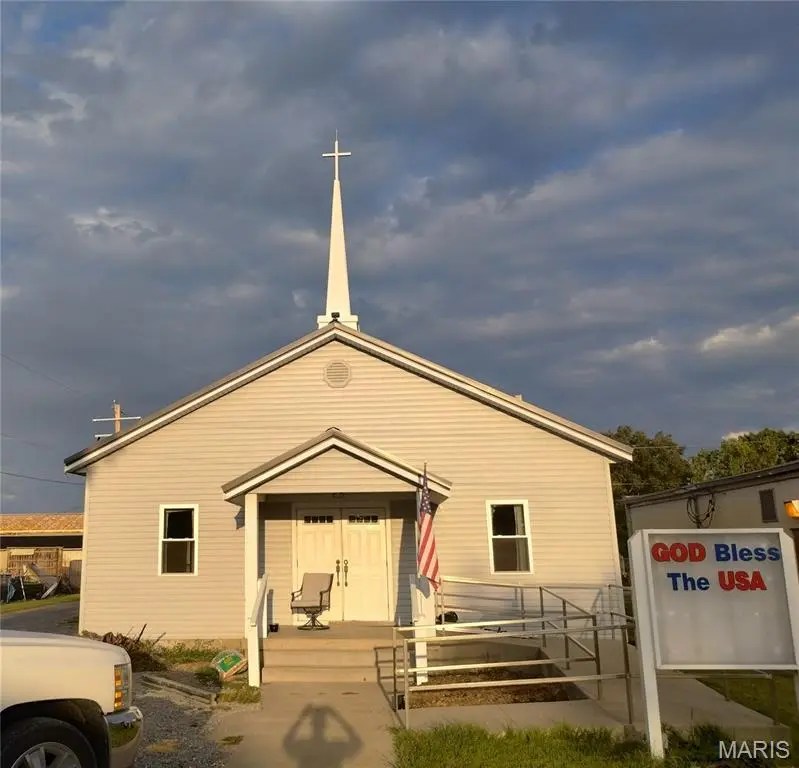
Listing remarks
Unique character meets modern comfort in this beautifully renovated 1950s church conversion, now transformed into a move-in ready, low-maintenance home with 3 bedroom, with the possibility of 5 bedrooms, and 1.5 baths. Thoughtfully updated with over $100,000 in improvements, this one-of-a-kind property blends timeless charm with today’s conveniences. Recent upgrades include all new windows, new doors, new siding, a durable metal roof, updated solid foundation work, R-30 insulation beneath the floors, and fresh interior paint throughout—providing peace of mind and energy efficiency for years to come. Inside, the spacious living area showcases a stunning new wood ceiling, ceiling
Key facts
- 8,973 sq ft lot
- Built 1952
- Listed 33 days
Property features AI
Finance
- Other: Living area reported as 2,340 (assessor)
- Financial info: Lease not considered
Exterior
- Utilities: Public water; Public sewer; Electricity connected (220 volts, Ameren); Natural gas connected
- Home design: Single-family residence; Residential property; One story
- Construction: Vinyl siding; Metal roof
- Exterior features: City lot; Rectangular lot; Lot dimensions approximately 63 x 142
Interior
- Bedrooms: 1 bedroom on the main level
- Bathrooms: 1 full bathroom; 1 half bathroom
- Heating & cooling: Forced air heating (natural gas); Central air conditioning (dual)
- Interior features: One-level living
- Laundry & utility: Main-level laundry
Neighborhood map
What this means for you Summary
Snapshot
- This is a 3-bed/1.5-bath single-family listed at $149k. Condition is rated good.
Deal economics
- At list price, monthly cash flow is $-20 ($-235/yr) — negative.
- To cash-flow at today's rent, offer at most $146k (1.9% below list).
- To meet the 1% rule (rent ≥ 1% of price), the offer needs to be $128k (14.2% below list).
- Recommended offer: $128k (14.2% below list) — sets the bar for 1% rule.
Location & tenants
- Location reads 60/100 on livability (#507 in MO) — a middle-class / working-renter tenant base. Strengths: cost of living A+, housing A+; Watch: crime F, amenities F, commute F.
- Delta R-V (rural): math 25% / reading 35% proficiency, ranked #457 of 535 in MO (top 85%) — families likely to look elsewhere, expect single-tenant / working-renter base with shorter leases.
- Zoned schools: Delta Elem. (math 24% / reading 34%, grade F, #813 of 1,115 statewide, top 75%, 105 students, 54% FRL); Delta High (math 27% / reading 37%, grade F, #356 of 521 statewide, top 71%, 119 students, 60% FRL).
- Market conditions: 1 active listings in the ZIP; 81 units permitted in Cape Girardeau County in 2024 (0 in 5+ unit buildings).
Forward outlook
- In year one you build about $6k of equity ($1k loan paydown + $4k appreciation (3.0% local appreciation)).
- Cape Girardeau County population projected at +17% by 2050 — long-run rental-demand tailwind backs the buy-and-hold thesis.
- At projected returns (3.0% appreciation + 3.0% rent growth), your $42k cash investment doubles in ~7 years — after that, you're playing with house money.
- By year 7, paydown + projected appreciation supports a ~$35k cash-out refi (75% LTV) — recoverable capital for the next deal without selling this one.
Negotiation context
- It's been on market 33 days — a 3% lower offer ($145k) is reasonable based on typical stale-listing flexibility.
Risks & watch-outs
- Watch-outs: built in 1952 — expect roof / HVAC / electrical / plumbing capex.
- Climate carrying-cost: extreme-heat days projected 7→21/yr by 2055 (HVAC capex compounding) — expect insurance premiums to compound above CPI over the hold.
Questions for the listing agent
- What do current leases actually rent for vs. the listed asking? Can we see a recent rent roll and the last 12 months of T-12 income?
- It's been on market 33 days. Have you received any prior offers? Is the seller open to a 14% concession, seller financing, or rate buy-down credit?
- Built in 1952 — when were the roof, HVAC, electrical panel, plumbing, and water heater last replaced?
- Is there a deadline driving the sale (1031 exchange, divorce, estate, relocation)? That informs how much negotiation room exists.
- Schools are F-rated, which usually means shorter tenancies and higher turnover. Who's the typical renter profile here, and what's been the actual vacancy rate?
- Crime grade is F in this area — have there been break-ins, vandalism, or insurance claims at this property in the last 3 years? What carrier currently insures it and at what premium?
- The area grade is low — what's the realistic commute time and amenity access for the typical tenant pool here? Any planned neighborhood developments (good or bad) we should know about?
- What's the average days-on-market for RENTAL listings here right now (not sales)? A rising rental-DOM trend means longer vacancies and softer asking-rent achievability than the comps imply.
- What's the recent tenant-quality profile in this submarket — average credit score on applications, eviction rate, late-payment / NSF rate, and stable-employment percentage? A property-management company in the area should have these aggregated.
- How much new for-sale + rental construction is in the pipeline within 1–3 miles? Heavy new supply typically softens prices + rents 12–24 months out; constrained supply supports both.
Investment metrics
- 1% rule
- 0.86% ✗
- Cap rate
- 6.13%
- Cash-on-cash
- -0.56%
- DSCR
- 0.97
- GRM
- 9.7
CMA / ARV
No comps found within radius.
Projected returns pro-forma
3.0% appreciation · 3.0% rent growth · sell at horizon
- IRR
- 7.0%
- Equity multiple
- 1.40×
- Total profit
- $16,719
- Equity at exit
- $66,997
- IRR
- 9.8%
- Equity multiple
- 2.47×
- Total profit
- $61,320
- Equity at exit
- $103,250
Cash invested: $41,720 (down + closing). Projections, not guarantees.
Landlord ↔ Tenant lean methodology
- Overall (STATE)
- 81 Strongly Landlord-Friendly
- State Missouri
- 81 Strongly Landlord-Friendly · R+10
- County
- — inherits STATE
- City
- — inherits STATE
ZIP-level market 63744
- Active inventory
- 1
- Price-to-rent
- 9.7×
Monthly cashflow live
- Estimated rent
- $1,279 medium interval (Pro) →
- Mortgage (P&I)
- −$781
- Tax est. 1.5%
- −$186 /mo · $2,235/yr
- Insurance
- −$62
- HOA
- −$0
- Vacancy / Maint / Mgmt
- −$269
- Net cashflow
- $-20
Break-even live
Sensitivity live
| Price | -10% $83 | -5% $32 | +0% $-20 | +5% $-71 | +10% $-123 |
|---|---|---|---|---|---|
| Rent | -10% $-121 | -5% $-70 | +0% $-20 | +5% $31 | +10% $81 |
| Rate | -1.0pp $55 | -0.5pp $18 | base $-20 | +0.5pp $-58 | +1.0pp $-98 |
UW: 25.0% down · 7.5% · 30yr · 1.5% tax · 5.0% vac · 8.0% maint · 8.0% mgmt
Financing live
Cash to close
- Down payment
- $37,250
- Closing costs
- $4,470
- Reserves months
- —
- Total cash needed
- —
Loan-product check · same deal, 3 products live
Conventional
25% down · 7.5% · 30yr
- Down + closing
- —
- Monthly P&I
- —
- Monthly cashflow
- —
- DSCR
- —
- Eligible?
- —
Personal DTI + credit; lowest rate.
DSCR
20% down · 8.5% · 30yr
- Down + closing
- —
- Monthly P&I
- —
- Monthly cashflow
- —
- DSCR
- —
- Eligible?
- —
No personal income docs; deal must DSCR.
Hard money
10% down · 12.0% · 12mo
- Down + closing
- —
- Monthly P&I
- —
- Monthly cashflow
- —
- DSCR
- —
- Eligible?
- —
Short-term bridge; refi at stabilization.
Listing history 19 events
-
2026-06-22days on market $149,000 Active 33 DOM
-
2026-06-19days on market $149,000 Active 31 DOM
-
2026-06-18days on market $149,000 Active 30 DOM
-
2026-06-17days on market $149,000 Active 29 DOM
-
2026-06-16days on market $149,000 Active 28 DOM
-
2026-06-15days on market $149,000 Active 27 DOM
-
2026-06-14days on market $149,000 Active 25 DOM
-
2026-06-13days on market $149,000 Active 24 DOM
-
2026-06-10days on market $149,000 Active 22 DOM
-
2026-06-09days on market $149,000 Active 21 DOM
-
2026-06-08days on market $149,000 Active 20 DOM
-
2026-06-07days on market $149,000 Active 19 DOM
-
2026-06-05days on market $149,000 Active 16 DOM
-
2026-06-03days on market $149,000 Active 15 DOM
-
2026-06-02days on market $149,000 Active 14 DOM
-
2026-06-01days on market $149,000 Active 13 DOM
-
2026-05-31days on market $149,000 Active 12 DOM
-
2026-05-30days on market $149,000 Active 11 DOM
-
2026-05-19$149,000 Active
ⓘ Source: listings_history table (triggers on properties + properties_extension) + one-shot
backfill from property_details.listing_events for pre-trigger history.
Climate risk First Street
- Flood 1/10 Low FEMA zone X (unshaded) · 0% chance over 30 yrs
- Wildfire 3/10 Moderate
- Heat 6/10 Major 7 d/yr ≥108°F today · 21 d/yr by 30 yrs out
- Wind 2/10 Low 4% chance of damaging wind over 30 yrs
- Air quality 3/10 Moderate 3 unhealthy d/yr today · 5 by 30 yrs out
Nearby sold comps map
Loading sold comps map…
Walkable amenities ~0.75 mi
Loading nearby amenities…
Taxation est. · year 1
- Rental income
- $15,343
- − Mortgage interest
- −$8,346
- − Property taxes
- −$2,235
- − Insurance
- −$745
- − Repairs & maintenance
- −$1,227
- − Management
- −$1,227
- − Depreciation
- −$4,335
- Taxable loss
- −$2,773
- Est. tax savings @ 24.0%
- +$665
- After-tax cash flow
- $430/yr
For passive investors: Depreciation is non-cash, so a rental often shows a tax loss while cash-flowing — sheltering income. Rental losses are passive: they offset passive income freely, and up to $25,000/yr can offset ordinary (W-2) income if you actively participate and your MAGI is under $100k (phasing out to $0 by $150k); unused losses carry forward. On sale, claimed depreciation is recaptured at up to 25%, and gains may owe capital-gains tax (a 1031 exchange can defer both). Figures are a year-1 estimate at your 24.0% rate — not tax advice; consult a CPA.
Condition & rehab AI · 3 photos
This beautifully renovated church conversion is move-in ready with recent updates and good condition, making it an attractive investment for both resale and rental.
Value-add opportunities
- Both Landscaping — Enhances curb appeal and adds value for both resale and rental.
- Both Paint exterior — Fresh paint improves curb appeal and adds value for both resale and rental.
Renovation cost estimate screening
Value-add ROI direction
- Both Landscaping — Enhances curb appeal and adds value for both resale and rental. ↑
- Both Paint exterior — Fresh paint improves curb appeal and adds value for both resale and rental. ↑
ⓘ Cost ranges are severity-bucket heuristics (US national rule-of-thumb). Get contractor quotes + a written scope before underwriting a rehab budget.
Schools (NCES district)
- District
- Delta R-V
- NCES district ID
- 2910620
- Math proficiency
- 25% ▼ -10.00%
- Reading proficiency
- 35% ▼ -5.00%
- Median HH income
- $41,301
- Composite
- 28.19/100
- National rank
- #12186
- State rank
- #457 of 535 in MO
Livability — Delta
- Score
- 60/100
- State rank
- #507
- US rank
- #19505
Category grades
Schools grade is shown separately in the Schools card above.
Census & demographics
- Census place
- Delta, MO
- Population (ZIP)
- 177
Population outlook (Cape Girardeau County) Hauer SSP2
- Today (2025)
- 84,807 people
- By 2030
- 88,016 · +3.8%
- By 2040
- 93,914 · +10.7%
- By 2050
- 99,541 · +17.4%
- By 2075
- 114,527 · +35.0%
- By 2100
- 121,718 · +43.5%
Race, ethnicity, and origin ACS 2023
- Neighborhood character
- Predominantly White (99%)
- Race & ethnicity
- White 99%
- Common ancestry
- Iranian 3% Serbian 1%
Political lean MEDSL · Cape Girardeau
- 2024 margin
- Solid R (+46.5) · D 26.2% · R 72.7% · Other 1.1%
- 2008→2024 swing
- -12.9pp toward R · 2008: -33.6pp · 2024: -46.5pp
- All cycles
- 2024: R+46.5 2020: R+45.0 2016: R+50.1 2012: R+43.8 2008: R+33.6
Not yet ingested
- Civics
- —
Market trends
- HPI YoY
- —
- Current HPI
- —
- Rent YoY
- —
- Metro
- —
- State GDP YoY
- ▲ 1.84%
- F500 in state
- 20
Industry mix (Fortune 500 HQ in MO)
| Industry | F500 HQs | Revenue |
|---|---|---|
| Healthcare | 1 | $163B |
|
||
| Insurance | 1 | $21B |
|
||
| Industrial Technology | 1 | $17B |
|
||
| Retail | 1 | $16B |
|
||
| Industrial Distribution | 1 | $10B |
|
||
| Utilities | 1 | $9B |
|
||
Price history
1 event — show timeline
- 2026-05-19 Listed $149,000 MARIS as Distributed by MLS Grid
Cash-flow waterfall
monthlySold comps — $/sqft
last 12 mo · ≤1 miLoading sold comps…