4737 Winding Trl · Greensboro, NC
Flood risk 1/10 · Minimal
- FEMA flood zone
- X (unshaded)
- Chance of flooding over 30 yrs
- 0.0%
- Est. flood insurance / yr
- $507 – $1,088
Fire risk 2/10 · Minimal
- Est. fire insurance / yr
- $906 – $1,684
Heat risk 5/10 · Moderate
- Hot days now (above 102°F)
- 7 days/yr
- Hot days in 30 yrs
- 18 days/yr
Wind risk 4/10 · Minor
- Chance of severe wind over 30 yrs
- 12.0%
Air-quality risk 2/10 · Minimal
- Unhealthy air days now
- 1 days/yr
- Unhealthy air days in 30 yrs
- 2 days/yr
Risk factors via First Street. Map © Google.
Why this score? — see what drove the D grade
The composite is a weighted blend of 9 inputs, each scored 0–100. Each bar is that input's sub-score; the figure is the points it added to the 100-point composite (weight × sub-score).
- Cash flow +12.4/30.0
- ARV discount +7.5/15.0
- Condition / age +4.8/5.0
- Livability +4.0/5.0
- DSCR +3.7/10.0
- Schools +3.6/10.0
- 1% rule +3.5/10.0
- Rent growth +2.5/5.0
- Appreciation +0.0/10.0
$402,235
🖨 Deal sheet (PDF) 📄 Offer letter ✓ Due diligence
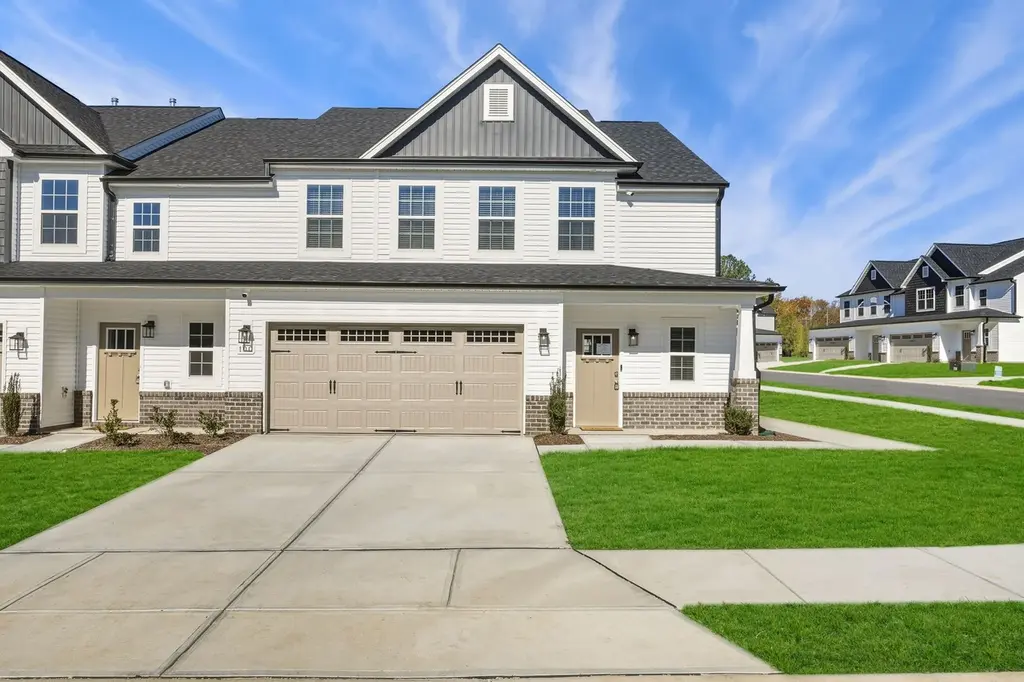
Listing remarks
Discover the Columbus at Townes at Spangler Oaks, a townhome community with easy access to commuter routes, shopping, and dining. This Columbus spans two levels with an open main floor where the kitchen and dining area connect directly to the great room, keeping the whole level in easy conversation with itself. A private patio sits just off the main living area, extending the space outward for evenings that stretch past dinner. The primary suite on the main level sits apart from the rest of the home, with a dual vanity bath and a closet upgrade that holds a full wardrobe with room to spare. Upstairs, two additional bedrooms share a secondary bath with its own dual vanity, and a centrally pl
Key facts
- Generous loft space
- Private patio
- Walk in closets
Tags
Property features AI
Finance
- Financial info: List price $400,235
Exterior
- Parking: 2 garage spaces (2 total parking spaces)
- Home design: Single-family (The Columbus)
- Exterior features: Living area of 2504; Address: 4737 Winding Trl, Summerfield, NC 27358
Interior
- Bedrooms: 4 bedrooms
- Bathrooms: 3 full bathrooms; 1 half bathroom
- Interior features: Spec home (The Columbus plan); Active listing
Neighborhood map
What this means for you Summary
Snapshot
- This is a 4-bed/3.5-bath townhouse listed at $402k. Condition is rated excellent.
Deal economics
- At list price, monthly cash flow is $-68 ($-812/yr) — negative.
- To cash-flow at today's rent, offer at most $392k (2.4% below list).
- To meet the 1% rule (rent ≥ 1% of price), the offer needs to be $343k (14.7% below list).
- Recommended offer: $343k (14.7% below list) — sets the bar for 1% rule.
- Cap rate 6.1% vs local median 3.7% in Greensboro — top-decile yield for the area; either an underpriced asset or a hidden risk that comps aren't pricing in. Stress-test before assuming the spread holds.
Location & tenants
- Location reads 81/100 on livability (#12 in NC, #1,335 nationally) — a professional / high-income tenant draw. Strengths: amenities A+, commute A+, cost of living A+; Watch: employment D, crime F.
- Guilford County Schools (urban): math 39% / reading 45% proficiency, ranked #99 of 178 in NC (top 56%) — families likely to look elsewhere, expect single-tenant / working-renter base with shorter leases.
- Zoned schools: Ep Pearce Elementary (math 80% / reading 79%, grade A, #24 of 1,410 statewide, top 2%, 667 students, 26% FRL); Kernodle Middle (math 62% / reading 60%, grade B+, #40 of 475 statewide, top 9%, 745 students, 40% FRL); Northwest Guilford High (math 72% / reading 64%, grade B, #137 of 535 statewide, top 26%, 1,991 students, 18% FRL) — zoned schools average 28% FRL vs 52% district-wide (24 pts lower); this property's tenant base skews higher-income than the district average.
- Zoned-school proficiency averages 70% at this address vs 42% district-wide (+28 pts) — the actual schools serving this property are materially stronger than the Guilford County Schools average implies; a family-tenant draw the district grade alone would hide.
- Market conditions: 144 active listings in the ZIP; 4 comparable units currently listed for rent nearby; rentals at typical pace (median 25d on market — plan ~3-4 weeks tenant-placement turnaround); 3,843 units permitted in Guilford County in 2024 (2,397 in 5+ unit buildings).
Forward outlook
- Local home prices are declining (-3.0%/yr); year-one equity from $3k of loan paydown is wiped out by about $12k of value loss. Plan a longer hold.
- Guilford County population projected at +26% by 2050 — long-run rental-demand tailwind backs the buy-and-hold thesis.
Negotiation context
- It's been on market 23 days — a 2% lower offer ($396k) is reasonable based on typical stale-listing flexibility.
Risks & watch-outs
- Climate carrying-cost: extreme-heat days projected 7→18/yr by 2055 (HVAC capex compounding) — expect insurance premiums to compound above CPI over the hold.
Questions for the listing agent
- What do current leases actually rent for vs. the listed asking? Can we see a recent rent roll and the last 12 months of T-12 income?
- Is there a deadline driving the sale (1031 exchange, divorce, estate, relocation)? That informs how much negotiation room exists.
- Crime grade is F in this area — have there been break-ins, vandalism, or insurance claims at this property in the last 3 years? What carrier currently insures it and at what premium?
- The area grade is low — what's the realistic commute time and amenity access for the typical tenant pool here? Any planned neighborhood developments (good or bad) we should know about?
- What's the average days-on-market for RENTAL listings here right now (not sales)? A rising rental-DOM trend means longer vacancies and softer asking-rent achievability than the comps imply.
- What's the recent tenant-quality profile in this submarket — average credit score on applications, eviction rate, late-payment / NSF rate, and stable-employment percentage? A property-management company in the area should have these aggregated.
- How much new for-sale + rental construction is in the pipeline within 1–3 miles? Heavy new supply typically softens prices + rents 12–24 months out; constrained supply supports both.
Investment metrics
- 1% rule
- 0.85% ✗
- Cap rate
- 6.09%
- Cash-on-cash
- -0.72%
- DSCR
- 0.97
- GRM
- 9.8
CMA / ARV
No comps found within radius.
Projected returns pro-forma
-3.0% appreciation · 3.0% rent growth · sell at horizon
- IRR
- -17.5%
- Equity multiple
- 0.38×
- Total profit
- $-69,438
- Equity at exit
- $59,975
- IRR
- -9.5%
- Equity multiple
- 0.42×
- Total profit
- $-65,805
- Equity at exit
- $34,778
Cash invested: $112,626 (down + closing). Projections, not guarantees.
Landlord ↔ Tenant lean methodology
- Overall (STATE)
- 85 Strongly Landlord-Friendly
- State North Carolina
- 85 Strongly Landlord-Friendly · R+3
- County
- — inherits STATE
- City
- — inherits STATE
ZIP-level market 27358
- Home prices YoY
- -20.9%
- Active inventory
- 144
- Price-to-rent
- 9.8×
Monthly cashflow live
- Estimated rent
- $3,433 medium interval (Pro) →
- Mortgage (P&I)
- −$2,109
- Tax est. 1.5%
- −$503 /mo · $6,034/yr
- Insurance
- −$168
- HOA
- −$0
- Vacancy / Maint / Mgmt
- −$721
- Net cashflow
- $-68
Break-even live
Sensitivity live
| Price | -10% $210 | -5% $71 | +0% $-68 | +5% $-207 | +10% $-346 |
|---|---|---|---|---|---|
| Rent | -10% $-339 | -5% $-203 | +0% $-68 | +5% $68 | +10% $204 |
| Rate | -1.0pp $135 | -0.5pp $35 | base $-68 | +0.5pp $-172 | +1.0pp $-278 |
UW: 25.0% down · 7.5% · 30yr · 1.5% tax · 5.0% vac · 8.0% maint · 8.0% mgmt
Financing live
Cash to close
- Down payment
- $100,559
- Closing costs
- $12,067
- Reserves months
- —
- Total cash needed
- —
Loan-product check · same deal, 3 products live
Conventional
25% down · 7.5% · 30yr
- Down + closing
- —
- Monthly P&I
- —
- Monthly cashflow
- —
- DSCR
- —
- Eligible?
- —
Personal DTI + credit; lowest rate.
DSCR
20% down · 8.5% · 30yr
- Down + closing
- —
- Monthly P&I
- —
- Monthly cashflow
- —
- DSCR
- —
- Eligible?
- —
No personal income docs; deal must DSCR.
Hard money
10% down · 12.0% · 12mo
- Down + closing
- —
- Monthly P&I
- —
- Monthly cashflow
- —
- DSCR
- —
- Eligible?
- —
Short-term bridge; refi at stabilization.
Rent comps 4 comps
| Address | Beds | Baths | Sqft | Rent | $/sqft | DOM | Units | Dist |
|---|---|---|---|---|---|---|---|---|
| 5510 Faye Dr Greensboro, NC | 4.0 | 3.5 | 2674 | $4,500 | $1.68 | 16d | 1 | 0.48mi |
| 4808 Pine Glen Ct Greensboro, NC | 4.0 | 2.5 | 2319 | $2,450 | $1.06 | 23d | 1 | 0.77mi |
| 4807 Jessup Grove Rd Greensboro, NC | 4.0 | 3.0 | 1860 | $2,065 | $1.11 | 25d | 1 | 1.28mi |
| 4210 Shoal Creek Dr Greensboro, NC | 5.0 | 2.5 | 2695 | $3,300 | $1.22 | 25d | 1 | 1.36mi |
Listing history 16 events
-
2026-06-22days on market $402,235 Active 23 DOM
-
2026-06-18days on market $402,235 Active 20 DOM
-
2026-06-17days on market $402,235 Active 19 DOM
-
2026-06-16days on market $402,235 Active 18 DOM
-
2026-06-15days on market $402,235 Active 17 DOM
-
2026-06-14days on market $402,235 Active 15 DOM
-
2026-06-10days on market $402,235 Active 12 DOM
-
2026-06-09days on market $402,235 Active 11 DOM
-
2026-06-08days on market $402,235 Active 10 DOM
-
2026-06-07pricedays on market $402,235 Active 9 DOM
-
2026-06-03days on market $400,235 Active 5 DOM
-
2026-06-02days on market $400,235 Active 4 DOM
-
2026-06-01days on market $400,235 Active 3 DOM
-
2026-05-31days on market $400,235 Active 2 DOM
-
2026-05-31remarks 699-char remark
-
2026-05-31$400,235 Active 1 DOM
ⓘ Source: listings_history table (triggers on properties + properties_extension) + one-shot
backfill from property_details.listing_events for pre-trigger history.
Climate risk First Street
- Flood 1/10 Low FEMA zone X (unshaded) · 0% chance over 30 yrs
- Wildfire 2/10 Low
- Heat 5/10 Major 7 d/yr ≥102°F today · 18 d/yr by 30 yrs out
- Wind 4/10 Moderate 12% chance of damaging wind over 30 yrs
- Air quality 2/10 Low 1 unhealthy d/yr today · 2 by 30 yrs out
Nearby sold comps map
Loading sold comps map…
Walkable amenities ~0.75 mi
Loading nearby amenities…
Taxation est. · year 1
- Rental income
- $41,196
- − Mortgage interest
- −$22,531
- − Property taxes
- −$6,034
- − Insurance
- −$2,011
- − Repairs & maintenance
- −$3,296
- − Management
- −$3,296
- − Depreciation
- −$11,701
- Taxable loss
- −$7,673
- Est. tax savings @ 24.0%
- +$1,841
- After-tax cash flow
- $1,029/yr
For passive investors: Depreciation is non-cash, so a rental often shows a tax loss while cash-flowing — sheltering income. Rental losses are passive: they offset passive income freely, and up to $25,000/yr can offset ordinary (W-2) income if you actively participate and your MAGI is under $100k (phasing out to $0 by $150k); unused losses carry forward. On sale, claimed depreciation is recaptured at up to 25%, and gains may owe capital-gains tax (a 1031 exchange can defer both). Figures are a year-1 estimate at your 24.0% rate — not tax advice; consult a CPA.
Condition & rehab AI · 13 photos
This meticulously maintained townhouse is move-in ready with excellent condition and high resale and rental potential. Minor updates to paint and landscaping can further enhance its appeal.
Value-add opportunities
- Both Painting exterior and interior walls — Fresh paint enhances curb appeal and interior aesthetics
- Both Landscaping and curb appeal improvements — Well-maintained landscaping can increase both resale and rental value
- Both Add smart home features — Modern technology can increase both resale and rental appeal
Renovation cost estimate screening
Value-add ROI direction
- Both Painting exterior and interior walls — Fresh paint enhances curb appeal and interior aesthetics ↑
- Both Landscaping and curb appeal improvements — Well-maintained landscaping can increase both resale and rental value ↑
- Both Add smart home features — Modern technology can increase both resale and rental appeal ↑
ⓘ Cost ranges are severity-bucket heuristics (US national rule-of-thumb). Get contractor quotes + a written scope before underwriting a rehab budget.
Schools (NCES district)
- District
- Guilford County Schools
- NCES district ID
- 3701920
- Math proficiency
- 39% ▲ 1.00%
- Reading proficiency
- 45% ▲ 1.00%
- Median HH income
- $46,315
- Composite
- 35.78/100
- National rank
- #4842
- State rank
- #99 of 178 in NC
Livability — Greensboro
- Score
- 81/100
- State rank
- #12
- US rank
- #1335
Category grades
Schools grade is shown separately in the Schools card above.
Census & demographics
- Census place
- Greensboro, NC
- City population
- 329,421
- Population (ZIP)
- 15,283
Population outlook (Guilford County) Hauer SSP2
- Today (2025)
- 584,596 people
- By 2030
- 616,851 · +5.5%
- By 2040
- 678,451 · +16.1%
- By 2050
- 734,788 · +25.7%
- By 2075
- 862,985 · +47.6%
- By 2100
- 948,704 · +62.3%
Race, ethnicity, and origin ACS 2023
- Neighborhood character
- Predominantly White (80%)
- Race & ethnicity
- White 80% Hispanic / Latino 7% Asian 6% Two or more races 5% Black 4% Native American 2%
- Hispanic origin (detail)
- Mexican 3%
- Common ancestry
- Slovak 3% Romanian 3% Iranian 2%
- Foreign-born
- 10% · Canada, China, South Korea
- Languages at home
- 90% English-only · Spanish 4% Other Indo-European 2% Arabic 2%
Political lean MEDSL · Guilford
- 2024 margin
- Strong D (+21.8) · D 60.2% · R 38.4% · Other 1.4%
- 2008→2024 swing
- +3.5pp toward D · 2008: 18.4pp · 2024: 21.8pp
- All cycles
- 2024: D+21.8 2020: D+23.1 2016: D+20.0 2012: D+16.5 2008: D+18.4
Not yet ingested
- Civics
- —
Market trends
- HPI YoY
- ▼ -62.58%
- Current HPI
- 237.0528
- Rent YoY
- —
- Metro
- —
- State GDP YoY
- ▲ 3.28%
- F500 in state
- 26
Industry mix (Fortune 500 HQ in NC)
| Industry | F500 HQs | Revenue |
|---|---|---|
| Financial Services | 2 | $213B |
|
||
| Retail | 2 | $95B |
|
||
| Industrial Conglomerate | 1 | $38B |
|
||
| Metals / Steel | 1 | $35B |
|
||
| Utilities | 1 | $30B |
|
||
| Industrial Machinery | 1 | $19B |
|
||
Cash-flow waterfall
monthlySold comps — $/sqft
last 12 mo · ≤1 miLoading sold comps…