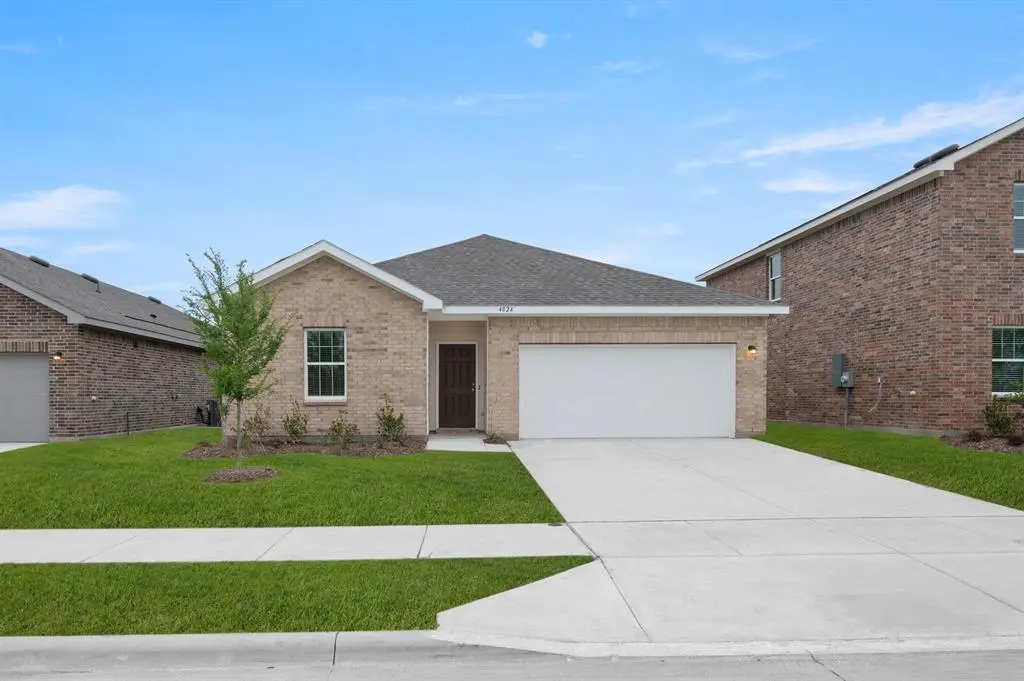
4824 Bass Dr · Fort Worth, TX
Flood risk No data
- FEMA flood zone
- —
- Chance of flooding over 30 yrs
- —
- Est. flood insurance / yr
- —
Fire risk No data
- Est. fire insurance / yr
- —
Heat risk No data
- Hot days now (above threshold)
- —
- Hot days in 30 yrs
- —
Wind risk No data
- Chance of severe wind over 30 yrs
- —
Air-quality risk No data
- Unhealthy air days now
- —
- Unhealthy air days in 30 yrs
- —
Risk factors via First Street. Map © Google.
Why this score? — see what drove the D- grade
The composite is a weighted blend of 9 inputs, each scored 0–100. Each bar is that input's sub-score; the figure is the points it added to the 100-point composite (weight × sub-score).
- Cash flow +12.0/30.0
- ARV discount +7.5/15.0
- Livability +4.0/5.0
- DSCR +3.5/10.0
- Schools +3.5/10.0
- Rent growth +2.9/5.0
- 1% rule +2.6/10.0
- Condition / age +2.5/5.0
- Appreciation +0.0/10.0
$303,990
🖨 Deal sheet 📄 Offer letter ✓ Due diligence
Listing remarks
MLS# 21214246 - Built by Starlight Homes - Ready Now! ~ Special incentive 5-1 ARM at 3.35% Rate. Step into the foyer, where two bedrooms with a shared bath are located at the front of the home. As you continue down the hallway, you’ll pass the laundry room and access to the two-car garage before entering the open-concept kitchen, family room, and dining area. A covered patio sits just off the dining space, and tucked away on the opposite side of the family room is the primary bedroom, complete with a walk-in closet and a primary bath.
Key facts
- Open-concept kitchen
- Walk-in closet
- Covered patio
Tags
Property features AI
Finance
- Other: Municipal Utility District: No; Community features include sidewalks
- Financial info: Treat as clear loan type; No second mortgage
- HOA & community: Mandatory association (Ranch at Duck Creek); HOA management: Vision Communities Management; HOA fee $800 annually (includes management fees)
Exterior
- Parking: 2 covered parking spaces; 2-car garage (single door); Garage dimensions approximately 19' x 19'
- Security: Smoke detector(s)
- Utilities: City water; City sewer; Individual water meter
- Home design: Single family residence; Ranch at Duck Creek community; One story; Property is not attached
- Construction: New construction completed in 2026; Brick and siding exterior; Composition roof; Slab foundation
- Exterior features: Private yard; Back yard fencing; Landscaped lot; Sidewalks; Curbs; Underground utilities
Interior
- Kitchen: Granite counters; Built-in cabinets; Walk-in pantry; Disposal; Electric oven; Electric range; Natural stone/granite type surfaces
- Bedrooms: 3 bedrooms (all on main level); Primary bedroom on main level
- Flooring: Carpet; Luxury vinyl plank
- Bathrooms: 2 full bathrooms
- Heating & cooling: Central air; Electric heating
- Interior features: Open floorplan; Decorative lighting; Granite counters; Pantry; Cable TV available; High speed internet available; Walk-in closet(s); Seven total rooms; One living area; One dining area; Levels: One
- Laundry & utility: Full size washer/dryer area; Washer hookup; Electric dryer hookup; Separate utility room (7 x 6)
Neighborhood map
What this means for you Summary
Snapshot
- This is a 3-bed/2.0-bath other listed at $304k.
Deal economics
- At list price, monthly cash flow is $-75 ($-900/yr) — negative.
- To cash-flow at today's rent, offer at most $291k (4.4% below list).
- To meet the 1% rule (rent ≥ 1% of price), the offer needs to be $230k (24.3% below list).
- Recommended offer: $230k (24.3% below list) — sets the bar for 1% rule.
- Cap rate 6.0% vs local median 3.9% in Fort Worth — top-decile yield for the area; either an underpriced asset or a hidden risk that comps aren't pricing in. Stress-test before assuming the spread holds.
Location & tenants
- Location reads 80/100 on livability (#49 in TX, #1,954 nationally) — a professional / high-income tenant draw. Strengths: amenities A+, cost of living A+, housing A+; Watch: crime F.
- Eagle Mt-Saginaw ISD (urban): math 35% / reading 42% proficiency, ranked #361 of 826 in TX (top 44%) — families likely to look elsewhere, expect single-tenant / working-renter base with shorter leases.
- Zoned schools: Bryson El (math 23% / reading 27%, grade F, #3,013 of 4,322 statewide, top 70%, 547 students, 63% FRL) — zoned schools average 63% FRL vs 36% district-wide (28 pts higher); higher-poverty schools than district average — tighter screening recommended.
- Zoned-school proficiency averages 25% at this address vs 38% district-wide (-14 pts) — the specific schools serving this property underperform the Eagle Mt-Saginaw ISD average; the district grade overstates school quality for this exact location.
- Market conditions: Rents rising (+1.5%/yr); 1050 active listings in the ZIP; 40 comparable units currently listed for rent nearby; rentals at typical pace (median 21d on market — plan ~3-4 weeks tenant-placement turnaround); solid renter incomes; 18,938 units permitted in Tarrant County in 2024 (8,336 in 5+ unit buildings).
Forward outlook
- Local home prices are declining (-3.0%/yr); year-one equity from $2k of loan paydown is wiped out by about $9k of value loss. Plan a longer hold.
- Tarrant County population projected at +41% by 2050 — long-run rental-demand tailwind backs the buy-and-hold thesis.
Negotiation context
- It's been on market 52 days — a 3% lower offer ($295k) is reasonable based on typical stale-listing flexibility.
Questions for the listing agent
- What do current leases actually rent for vs. the listed asking? Can we see a recent rent roll and the last 12 months of T-12 income?
- It's been on market 52 days. Have you received any prior offers? Is the seller open to a 24% concession, seller financing, or rate buy-down credit?
- What does the HOA fee cover, when was the last increase, and are there any pending special assessments or reserve-fund shortfalls?
- Is there a deadline driving the sale (1031 exchange, divorce, estate, relocation)? That informs how much negotiation room exists.
- Schools are D-rated, which usually means shorter tenancies and higher turnover. Who's the typical renter profile here, and what's been the actual vacancy rate?
- Crime grade is F in this area — have there been break-ins, vandalism, or insurance claims at this property in the last 3 years? What carrier currently insures it and at what premium?
- The area grade is low — what's the realistic commute time and amenity access for the typical tenant pool here? Any planned neighborhood developments (good or bad) we should know about?
- What's the average days-on-market for RENTAL listings here right now (not sales)? A rising rental-DOM trend means longer vacancies and softer asking-rent achievability than the comps imply.
- What's the recent tenant-quality profile in this submarket — average credit score on applications, eviction rate, late-payment / NSF rate, and stable-employment percentage? A property-management company in the area should have these aggregated.
- How much new for-sale + rental construction is in the pipeline within 1–3 miles? Heavy new supply typically softens prices + rents 12–24 months out; constrained supply supports both.
Investment metrics
- 1% rule
- 0.76% ✗
- Cap rate
- 6.00%
- Cash-on-cash
- -1.06%
- DSCR
- 0.95
- GRM
- 11.0
CMA / ARV
No comps found within radius.
Projected returns pro-forma
-3.0% appreciation · 1.51% rent growth · sell at horizon
- IRR
- -19.6%
- Equity multiple
- 0.32×
- Total profit
- $-57,531
- Equity at exit
- $45,326
- IRR
- -15.6%
- Equity multiple
- 0.18×
- Total profit
- $-70,166
- Equity at exit
- $26,283
Cash invested: $85,117 (down + closing). Projections, not guarantees.
Landlord ↔ Tenant lean methodology
- Overall (STATE)
- 87 Strongly Landlord-Friendly
- State Texas
- 87 Strongly Landlord-Friendly · R+5
- County
- — inherits STATE
- City
- — inherits STATE
ZIP-level market 76179
- Rents YoY
- 1.5%
- Active inventory
- 1050
- Price-to-rent
- 11.0×
Monthly cashflow live
- Estimated rent
- $2,301 high interval (Pro) →
- Mortgage (P&I)
- −$1,594
- Tax from tax record
- −$105 /mo · $1,263/yr
- Insurance
- −$127
- HOA
- −$67
- Vacancy / Maint / Mgmt
- −$483
- Net cashflow
- $-75
Break-even live
UW: 25.0% down · 7.5% · 30yr · 1.5% tax · 5.0% vac · 8.0% maint · 8.0% mgmt
Financing live
Cash to close
- Down payment
- $75,998
- Closing costs
- $9,120
- Reserves months
- —
- Total cash needed
- —
Loan-product check · same deal, 3 products live
Conventional
25% down · 7.5% · 30yr
- Down + closing
- —
- Monthly P&I
- —
- Monthly cashflow
- —
- DSCR
- —
- Eligible?
- —
Personal DTI + credit; lowest rate.
DSCR
20% down · 8.5% · 30yr
- Down + closing
- —
- Monthly P&I
- —
- Monthly cashflow
- —
- DSCR
- —
- Eligible?
- —
No personal income docs; deal must DSCR.
Hard money
10% down · 12.0% · 12mo
- Down + closing
- —
- Monthly P&I
- —
- Monthly cashflow
- —
- DSCR
- —
- Eligible?
- —
Short-term bridge; refi at stabilization.
Rent comps 40 comps
| Address | Beds | Baths | Sqft | Rent | $/sqft | DOM | Units | Dist |
|---|---|---|---|---|---|---|---|---|
| 4900 Bass Dr Fort Worth, TX | 4.0 | 3.0 | 1910 | $2,700 | $1.41 | 21d | 1 | 0.03mi |
| 8249 Muscovy Dr Fort Worth, TX | 4.0 | 2.5 | 2095 | $2,599 | $1.24 | 15d | 1 | 0.10mi |
| 8261 Bufflehead Dr Fort Worth, TX | 4.0 | 2.0 | 1883 | $2,295 | $1.22 | 24d | 1 | 0.15mi |
| 8348 Hawkview Dr Fort Worth, TX | 4.0 | 2.5 | 2121 | $3,000 | $1.41 | 13d | 1 | 0.20mi |
| 8453 Shallow Creek Dr Fort Worth, TX | 3.0 | 3.0 | 1947 | $2,195 | $1.13 | 24d | 1 | 0.22mi |
| 8453 Shallow Creek Dr Fort Worth, TX | 3.0 | 2.5 | 1947 | $2,195 | $1.13 | 7d | 1 | 0.22mi |
| 4725 Harlequin Dr Fort Worth, TX | 3.0 | 2.0 | 1636 | $2,250 | $1.38 | 5d | 1 | 0.24mi |
| 4900 Old Ember Ln Fort Worth, TX | 3.0 | 2.0 | 1260 | $1,500 | $1.19 | 7d | 1 | 0.25mi |
| 4705 Harlequin Dr Fort Worth, TX | 4.0 | 2.0 | 1721 | $2,300 | $1.34 | 24d | 1 | 0.27mi |
| 4536 Skipador Dr Fort Worth, TX | 3.0 | 2.0 | 1236 | $2,000 | $1.62 | 4d | 1 | 0.33mi |
| 8408 Buck Mountain Pass Fort Worth, TX | 4.0 | 2.5 | 2131 | $2,375 | $1.11 | 24d | 1 | 0.34mi |
| 8205 Buck Mountain Pass Fort Worth, TX | 3.0 | 2.0 | 1316 | $1,995 | $1.52 | 13d | 1 | 0.36mi |
| 8204 Buck Mountain Pass Fort Worth, TX | 3.0 | 2.0 | 1638 | $2,100 | $1.28 | 3d | 1 | 0.38mi |
| 8633 Star Thistle Dr Fort Worth, TX | 3.0 | 2.0 | 1777 | $2,000 | $1.13 | 17d | 1 | 0.44mi |
| 8660 Boswell Meadows Dr Fort Worth, TX | 3.0 | 2.0 | 1298 | $1,845 | $1.42 | 2d | 1 | 0.50mi |
| 725 Gray Wash Dr Unit Labs Fort Worth, TX | 3.0 | 2.0 | 1888 | $2,100 | $1.11 | 24d | 1 | 0.53mi |
| 8520 Little Acorn Dr Fort Worth, TX | 4.0 | 2.0 | 1836 | $2,300 | $1.25 | 24d | 1 | 0.60mi |
| 8517 Centerboard Ln Fort Worth, TX | 4.0 | 2.0 | 1773 | $2,400 | $1.35 | 24d | 1 | 0.67mi |
| 4900 Cedar Springs Dr Fort Worth, TX | 3.0 | 2.0 | 1227 | $1,825 | $1.49 | 24d | 1 | 0.72mi |
| 4817 Cedar Springs Dr Fort Worth, TX | 3.0 | 2.0 | 1388 | $1,809 | $1.30 | 17d | 1 | 0.73mi |
| 7656 Northumberland Dr Fort Worth, TX | 3.0 | 2.0 | 2007 | $2,325 | $1.16 | 22d | 1 | 0.74mi |
| 544 Fox Dr Saginaw, TX | 3.0 | 2.0 | 1320 | $1,870 | $1.42 | 13d | 1 | 0.78mi |
| 4964 Creek Ridge Trl Fort Worth, TX | 3.0 | 2.5 | 2177 | $2,140 | $0.98 | 22d | 1 | 0.80mi |
| 701 Saginaw Square Blvd Unit 9128 Saginaw, TX | 2.0 | 2.0 | 1150 | $1,599 | $1.39 | 24d | 1 | 0.81mi |
| 701 Saginaw Square Blvd Unit 222 Saginaw, TX | 2.0 | 2.0 | 1139 | $1,419 | $1.25 | 24d | 1 | 0.81mi |
| 701 Saginaw Square Blvd Fort Worth, TX | 2.0 | 2.0 | 1140 | $1,629 | $1.43 | 5d | 1 | 0.81mi |
| 6933 Meadow Way Ln Fort Worth, TX | 4.0 | 2.5 | 1942 | $2,021 | $1.04 | 22d | 1 | 0.82mi |
| 6933 Meadow Way Ln Fort Worth, TX | 4.0 | 2.5 | 1942 | $1,955 | $1.01 | 21d | 1 | 0.82mi |
| 6848 Valley Creek Dr Fort Worth, TX | 3.0 | 2.0 | 1537 | $1,975 | $1.28 | 24d | 1 | 0.82mi |
| 8916 Highland Orchard Dr Fort Worth, TX | 3.0 | 2.5 | 1776 | $2,200 | $1.24 | 4d | 1 | 0.86mi |
| 4545 Waterford Dr Fort Worth, TX | 4.0 | 2.5 | 1960 | $2,086 | $1.06 | 13d | 1 | 0.88mi |
| 6812 Valley Creek Dr Fort Worth, TX | 4.0 | 2.0 | 1764 | $1,950 | $1.11 | 21d | 1 | 0.92mi |
| 6824 Turtle Stream Dr Fort Worth, TX | 3.0 | 2.0 | 1575 | $1,965 | $1.25 | 5d | 1 | 0.97mi |
| 7504 Innisbrook Ln Fort Worth, TX | 4.0 | 2.0 | 1991 | $2,395 | $1.20 | 24d | 1 | 0.98mi |
| 425 Park Center Blvd Saginaw, TX | 3.0 | 2.0 | 1752 | $2,045 | $1.17 | 5d | 1 | 0.99mi |
| 6701 Meadow Way Ln Fort Worth, TX | 4.0 | 2.0 | 1532 | $1,950 | $1.27 | 22d | 1 | 1.01mi |
| 421 Commonwealth Dr Fort Worth, TX | 3.0 | 2.0 | 1699 | $2,250 | $1.32 | 5d | 1 | 1.02mi |
| 5344 Brahma Trl Fort Worth, TX | 3.0 | 2.0 | 1720 | $2,195 | $1.28 | 7d | 1 | 1.04mi |
| 5344 Brahma Trl Fort Worth, TX | 3.0 | 2.0 | 1720 | $2,295 | $1.33 | 24d | 1 | 1.04mi |
| 751 N Saginaw Blvd Unit 2102 Saginaw, TX | 2.0 | 2.0 | 1139 | $1,435 | $1.26 | 13d | 1 | 1.04mi |
HOA detail
- Monthly dues
- $67 · $804/yr
Listing history 3 events
-
2026-05-11status Pending
-
2026-04-02price $303,990
-
2026-03-20$312,990 Active
ⓘ Source: listings_history table (triggers on properties + properties_extension) + one-shot
backfill from property_details.listing_events for pre-trigger history.
Tax reassessment forecast TX · Resets to sale price
- Current annual tax
- $1,263 · $105/mo
- Projected year-2 tax
- $5,563 · $464/mo
- Expected delta
- +$4,300/yr (+$358/mo · 340.5%)
ⓘ Screening estimate from a state-policy table — verify with the county assessor before closing.
Nearby sold comps map
Loading sold comps map…
Walkable amenities ~0.75 mi
Loading nearby amenities…
Taxation est. · year 1
- Rental income
- $27,616
- − Mortgage interest
- −$17,028
- − Property taxes
- −$1,263
- − Insurance
- −$1,520
- − Repairs & maintenance
- −$2,209
- − Management
- −$2,209
- − HOA
- −$804
- − Depreciation
- −$8,843
- Taxable loss
- −$6,261
- Est. tax savings @ 24.0%
- +$1,503
- After-tax cash flow
- $602/yr
For passive investors: Depreciation is non-cash, so a rental often shows a tax loss while cash-flowing — sheltering income. Rental losses are passive: they offset passive income freely, and up to $25,000/yr can offset ordinary (W-2) income if you actively participate and your MAGI is under $100k (phasing out to $0 by $150k); unused losses carry forward. On sale, claimed depreciation is recaptured at up to 25%, and gains may owe capital-gains tax (a 1031 exchange can defer both). Figures are a year-1 estimate at your 24.0% rate — not tax advice; consult a CPA.
Schools (NCES district)
- District
- Eagle Mt-Saginaw ISD
- NCES district ID
- 4817700
- Math proficiency
- 35% ▼ -16.00%
- Reading proficiency
- 42% ▼ -9.00%
- Median HH income
- $72,781
- Composite
- 35.41/100
- National rank
- #4945
- State rank
- #361 of 826 in TX
Livability — Fort Worth
- Score
- 80/100
- State rank
- #49
- US rank
- #1954
Category grades
Schools grade is shown separately in the Schools card above.
Census & demographics
- Census place
- Fort Worth, TX
- County
- Tarrant County · 2,033,669 people
- City population
- 911,619
- Metro
- Dallas-Fort Worth-Arlington, TX
- Population (ZIP)
- 80,090
- Household income
- $107,428
- Rent vs Own
- Severe rent burden
- 1494.0
Population outlook (Tarrant County) Hauer SSP2
- Today (2025)
- 2,380,417 people
- By 2030
- 2,578,900 · +8.3%
- By 2040
- 2,974,995 · +25.0%
- By 2050
- 3,350,489 · +40.8%
- By 2075
- 4,216,909 · +77.2%
- By 2100
- 4,741,527 · +99.2%
Race, ethnicity, and origin ACS 2023
- Neighborhood character
- Diverse neighborhood (Simpson 0.63)
- Race & ethnicity
- White 53% Hispanic / Latino 28% Two or more races 14% Black 12% Asian 4%
- Hispanic origin (detail)
- Mexican 22% Puerto Rican 2%
- Common ancestry
- Slovak 2% Lithuanian 2% Italian 1%
- Foreign-born
- 8% · Canada, Jamaica
- Languages at home
- 81% English-only · Spanish 15% Other Asian/Pacific 2% Other Indo-European 1%
Political lean MEDSL · Tarrant
- 2024 margin
- Lean R (+5.1) · D 46.7% · R 51.9% · Other 1.4%
- 2008→2024 swing
- +6.6pp toward D · 2008: -11.7pp · 2024: -5.1pp
- All cycles
- 2024: R+5.1 2020: D+0.2 2016: R+8.7 2012: R+15.7 2008: R+11.7
Not yet ingested
- Civics
- —
Market trends
- HPI YoY
- ▼ -137.12%
- Current HPI
- 237.6676
- Rent YoY
- ▲ 1.51%
- Metro
- Dallas-Fort Worth-Arlington, TX
- State GDP YoY
- ▲ 3.95%
- F500 in state
- 110
Industry mix (Fortune 500 HQ in TX)
| Industry | F500 HQs | Revenue |
|---|---|---|
| Energy | 16 | $1,198B |
|
||
| Technology | 5 | $198B |
|
||
| Engineering / Construction | 4 | $72B |
|
||
| Energy Services | 3 | $60B |
|
||
| Utilities | 3 | $41B |
|
||
| Healthcare | 2 | $330B |
|
||
Price history
-2.9% since first listed3 events — show timeline
- 2026-05-11 Pending — NTREIS
- 2026-04-02 Price Changed $303,990 NTREIS
- 2026-03-20 Listed $312,990 NTREIS
Property tax history
-0.9%/yrLatest (2025): $1,263 · -0.9% YoY. Source: county tax records.
Cash-flow waterfall
monthlySold comps — $/sqft
last 12 mo · ≤1 miLoading sold comps…