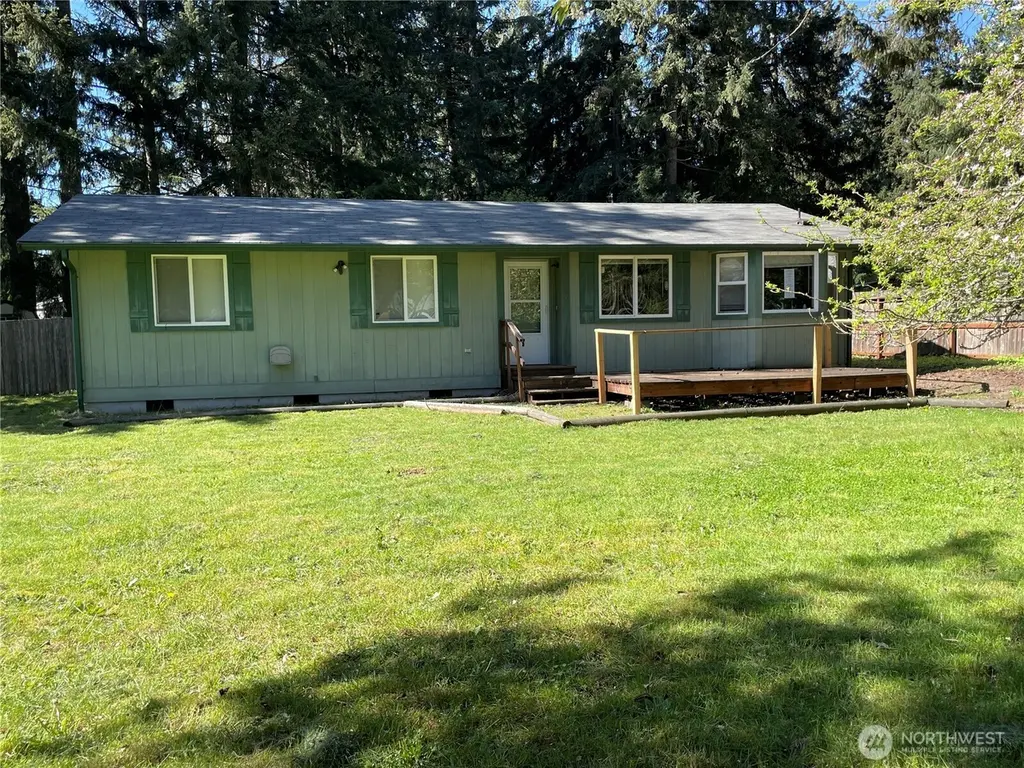
17827 Upland Dr SE · McKenna, WA
Flood risk 1/10 · Minimal
- FEMA flood zone
- X (unshaded)
- Chance of flooding over 30 yrs
- 0.0%
- Est. flood insurance / yr
- $507 – $1,088
Fire risk 3/10 · Minor
- Est. fire insurance / yr
- $604 – $1,122
Heat risk 2/10 · Minimal
- Hot days now (above 89°F)
- 7 days/yr
- Hot days in 30 yrs
- 14 days/yr
Wind risk 1/10 · Minimal
- Chance of severe wind over 30 yrs
- —
Air-quality risk 6/10 · Moderate
- Unhealthy air days now
- 7 days/yr
- Unhealthy air days in 30 yrs
- 9 days/yr
Risk factors via First Street. Map © Google.
Why this score? — see what drove the C- grade
The composite is a weighted blend of 9 inputs, each scored 0–100. Each bar is that input's sub-score; the figure is the points it added to the 100-point composite (weight × sub-score).
- ARV discount +15.0/15.0
- Cash flow +12.9/30.0
- Schools +4.8/10.0
- DSCR +3.9/10.0
- Rent growth +3.9/5.0
- 1% rule +3.6/10.0
- Livability +3.4/5.0
- Condition / age +2.5/5.0
- Appreciation +0.0/10.0
$298,000
🖨 Deal sheet (PDF) 📄 Offer letter ✓ Due diligence
Listing remarks
Affordably priced in highly desired gated Clearwood community. Buy now in time for summer fun! 3 bedroom 1.75 bath home with primary suite. Large . 26 acres quiet cul-de-sac lot with room to expand. Enjoy coffee on the wood deck and grow some veggies or flowers in the raised garden beds. Fenced back yard for privacy and/or pets. Storage shed. 3 Lakes for boating, fishing, swimming at the beaches. BBQ pits for parties, playgrounds, tennis & basketball courts, heated swimming pool & jacuzzi, plus several miles of hiking trails to enjoy nature! Apple and cherry trees.
Key facts
- Wood deck
- Fenced back yard
- Quiet cul de sac lot
Tags
Property features AI
Finance
- Other: Offers review date: Monday, May 25, 2026
- Financial info: Listing terms: Conventional
- HOA & community: HOA: Clearwood HOA; HOA fee $175 per month covering common area and road maintenance; Community waterfront / private beach access; Level topography
Exterior
- Parking: Driveway parking; Off-street parking
- Security: Partially fenced; Security gate
- Utilities: Electric energy source; Community water (Clearwood HOA); Septic sewer; Puget Sound Energy power; Electric water heater
- Home design: Single-family residence, one-story; Main level entry; Has view; Average condition
- Construction: Wood construction; Composition roof; Block foundation; Built on lot
- Exterior features: Wood exterior products; Partially fenced lot; Gated entry; Outbuildings; Garden space; Cul-de-sac lot
Interior
- Kitchen: Dishwasher; Garbage disposal; Microwave; Refrigerator; Stove/Range
- Bedrooms: Three bedrooms (all on the main level)
- Flooring: Vinyl flooring; Carpet
- Bathrooms: One full bathroom; One three-quarter bathroom; Two bathrooms on the main level
- Heating & cooling: Wall furnace heating; No cooling system
- Interior features: Water heater; Partial security fencing and security gate
- Laundry & utility: Washer; Water heater located in the laundry room
Neighborhood map
What this means for you Summary
Snapshot
- This is a 3-bed/2.0-bath single-family listed at $298k.
Deal economics
- At list price, monthly cash flow is $-20 ($-246/yr) — negative.
- To cash-flow at today's rent, offer at most $294k (1.2% below list).
- To meet the 1% rule (rent ≥ 1% of price), the offer needs to be $257k (13.8% below list).
- Recommended offer: $257k (13.8% below list) — sets the bar for 1% rule.
- Cap rate 6.2% vs local median 3.7% in McKenna — top-decile yield for the area; either an underpriced asset or a hidden risk that comps aren't pricing in. Stress-test before assuming the spread holds.
Location & tenants
- Location reads 67/100 on livability (#300 in WA) — a middle-class / working-renter tenant base. Strengths: employment A+, housing A+, crime A-; Watch: health & safety C-, amenities F, commute F.
- Yelm School District (rural): math 48% / reading 59% proficiency, ranked #108 of 291 in WA (top 37%) — acceptable for families but not a draw, mixed tenant base, ~2y average lease.
- Zoned schools: Lackamas Elementary (310 students, 55% FRL); Ridgeline Middle School (574 students, 46% FRL); Yelm High School 12 (1,634 students, 45% FRL) — zoned schools average 49% FRL vs 34% district-wide (15 pts higher); higher-poverty schools than district average — tighter screening recommended.
- Market conditions: Rents rising fast (+5.8%/yr); 434 active listings in the ZIP; 1 comparable units currently listed for rent nearby; solid renter incomes; 1,222 units permitted in Thurston County in 2024 (508 in 5+ unit buildings).
- This rent runs 33% of the median local income ($92k/yr) — at the standard rent-burdened threshold; future hikes will face affordability resistance.
Forward outlook
- Local home prices are declining (-3.0%/yr); year-one equity from $2k of loan paydown is wiped out by about $9k of value loss. Plan a longer hold.
- Thurston County population projected at +27% by 2050 — long-run rental-demand tailwind backs the buy-and-hold thesis.
Negotiation context
- It's been on market 19 days — a 2% lower offer ($294k) is reasonable based on typical stale-listing flexibility.
- 4 sale attempts since 20y ago with the ask held roughly flat each time — persistent listings suggest the price (not the market) is what's stuck; bring a comps-based counter.
Questions for the listing agent
- What do current leases actually rent for vs. the listed asking? Can we see a recent rent roll and the last 12 months of T-12 income?
- What does the HOA fee cover, when was the last increase, and are there any pending special assessments or reserve-fund shortfalls?
- Is there a deadline driving the sale (1031 exchange, divorce, estate, relocation)? That informs how much negotiation room exists.
- Schools are B-rated — typically a magnet for longer-tenancy family renters. What's the average tenant stay here, and is there a school-zone premium baked into asking?
- What's the average days-on-market for RENTAL listings here right now (not sales)? A rising rental-DOM trend means longer vacancies and softer asking-rent achievability than the comps imply.
- What's the recent tenant-quality profile in this submarket — average credit score on applications, eviction rate, late-payment / NSF rate, and stable-employment percentage? A property-management company in the area should have these aggregated.
- How much new for-sale + rental construction is in the pipeline within 1–3 miles? Heavy new supply typically softens prices + rents 12–24 months out; constrained supply supports both.
Investment metrics
- 1% rule
- 0.86% ✗
- Cap rate
- 6.21%
- Cash-on-cash
- -0.29%
- DSCR
- 0.99
- GRM
- 9.7
CMA / ARV
- ARV (on-the-fly)
- $391,950
- Comps found
- 12
Show comp detail 12 sales within ~0.75 mi
| Address | Dist | Beds/Ba | Sqft | Sold | Price | $/sf | Match |
|---|---|---|---|---|---|---|---|
| 22526 Clearland Ln SE | 0.06mi | 3/2.0 | 1,260 (+4%) | 6mo | $380,000 | $302 | 85 |
| 17834 Rising Ct SE | 0.16mi | 3/2.0 | 1,272 (+6%) | 3mo | $411,000 | $323 | 81 |
| 17804 Clear Lake Blvd SE | 0.06mi | 3/2.0 | 1,316 (+9%) | 2mo | $434,950 | $331 | 80 |
| 22429 Clearview Ct SE | 0.14mi | 3/2.0 | 1,292 (+7%) | 3mo | $420,000 | $325 | 79 |
| 18441 Blue Hills Loop SE | 0.64mi | 3/2.0 | 1,211 (+0%) | 2mo | $403,000 | $333 | 68 |
| 22127 N Clear Lake Blvd SE | 0.38mi | 3/2.0 | 1,303 (+8%) | 3mo | $455,000 | $349 | 67 |
| 17924 E Clear Lake Blvd SE | 0.06mi | 2/1.0 (-1) | 1,364 (+13%) | 7mo | $298,400 | $219 | 61 |
| 22418 N Clear Lake Blvd SE | 0.45mi | 3/2.0 | 1,298 (+8%) | 8mo | $435,000 | $335 | 60 |
| 18305 Parkcrest Ct SE | 0.42mi | 3/2.0 | 1,362 (+13%) | 4mo | $430,000 | $316 | 56 |
| 18417 Blue Hills Loop SE | 0.60mi | 3/2.0 | 1,316 (+9%) | 2mo | $415,000 | $315 | 55 |
| 21932 SE Promontory Ct | 0.69mi | 3/2.0 | 1,144 (-5%) | 7mo | $326,250 | $285 | 54 |
| 18425 Rampart Dr SE | 0.50mi | 2/1.0 (-1) | 1,088 (-10%) | 6mo | $369,000 | $339 | 46 |
Match score weights: distance 35% · size 25% · config 20% · recency 20%. Top-matched comps best support the ARV.
Projected returns pro-forma
-3.0% appreciation · 5.78% rent growth · sell at horizon
- IRR
- -13.7%
- Equity multiple
- 0.49×
- Total profit
- $-42,180
- Equity at exit
- $44,433
- IRR
- -1.0%
- Equity multiple
- 0.93×
- Total profit
- $-6,212
- Equity at exit
- $25,766
Cash invested: $83,440 (down + closing). Projections, not guarantees.
Landlord ↔ Tenant lean methodology
- Overall (STATE)
- 28 Tenant-Leaning
- State Washington
- 28 Tenant-Leaning · D+8
- County
- — inherits STATE
- City
- — inherits STATE
ZIP-level market 98597
- Rents YoY
- 5.8%
- Active inventory
- 434
- Price-to-rent
- 9.7×
Monthly cashflow live
- Estimated rent
- $2,567 medium interval (Pro) →
- Mortgage (P&I)
- −$1,563
- Tax from tax record
- −$187 /mo · $2,241/yr
- Insurance
- −$124
- HOA
- −$175
- Vacancy / Maint / Mgmt
- −$539
- Net cashflow
- $-20
Break-even live
Sensitivity live
| Price | -10% $148 | -5% $64 | +0% $-20 | +5% $-105 | +10% $-189 |
|---|---|---|---|---|---|
| Rent | -10% $-223 | -5% $-122 | +0% $-20 | +5% $81 | +10% $182 |
| Rate | -1.0pp $130 | -0.5pp $55 | base $-20 | +0.5pp $-98 | +1.0pp $-176 |
UW: 25.0% down · 7.5% · 30yr · 1.5% tax · 5.0% vac · 8.0% maint · 8.0% mgmt
Financing live
Cash to close
- Down payment
- $74,500
- Closing costs
- $8,940
- Reserves months
- —
- Total cash needed
- —
Loan-product check · same deal, 3 products live
Conventional
25% down · 7.5% · 30yr
- Down + closing
- —
- Monthly P&I
- —
- Monthly cashflow
- —
- DSCR
- —
- Eligible?
- —
Personal DTI + credit; lowest rate.
DSCR
20% down · 8.5% · 30yr
- Down + closing
- —
- Monthly P&I
- —
- Monthly cashflow
- —
- DSCR
- —
- Eligible?
- —
No personal income docs; deal must DSCR.
Hard money
10% down · 12.0% · 12mo
- Down + closing
- —
- Monthly P&I
- —
- Monthly cashflow
- —
- DSCR
- —
- Eligible?
- —
Short-term bridge; refi at stabilization.
Rent comps 1 comps
| Address | Beds | Baths | Sqft | Rent | $/sqft | DOM | Units | Dist |
|---|---|---|---|---|---|---|---|---|
| 18525 Woodside Dr SE Yelm, WA | 3.0 | 2.0 | 1232 | $2,299 | $1.87 | 14d | 1 | 0.76mi |
HOA detail
- Monthly dues
- $175 · $2,100/yr
- Likely covers
- landscapingpoolsecurity
Listing history 13 events
-
2026-05-09$298,000 Active
-
2022-03-18soldstatus $350,000 Closed
-
2022-02-12status Pending
-
2022-01-14$350,000 Active
-
2011-05-13status Pending
-
2011-05-13soldstatus $69,000 Sold
-
2011-05-03status Pending Inspection
-
2011-04-14price $70,000
-
2011-03-31$74,900 Active
-
2006-02-28soldstatus $167,000
-
2006-02-28soldstatus $167,000
-
2006-01-07$167,000
-
1995-07-31soldstatus $79,900
ⓘ Source: listings_history table (triggers on properties + properties_extension) + one-shot
backfill from property_details.listing_events for pre-trigger history.
Tax reassessment forecast WA · Resets to sale price
- Current annual tax
- $2,241 · $187/mo
- Projected year-2 tax
- $2,920 · $243/mo
- Expected delta
- +$679/yr (+$57/mo · 30.3%)
ⓘ Screening estimate from a state-policy table — verify with the county assessor before closing.
Climate risk First Street
- Flood 1/10 Low FEMA zone X (unshaded) · 0% chance over 30 yrs
- Wildfire 3/10 Moderate
- Heat 2/10 Low 7 d/yr ≥89°F today · 14 d/yr by 30 yrs out
- Wind 1/10 Low
- Air quality 6/10 Major 7 unhealthy d/yr today · 9 by 30 yrs out
Nearby sold comps map
Loading sold comps map…
Walkable amenities ~0.75 mi
Loading nearby amenities…
Taxation est. · year 1
- Rental income
- $30,808
- − Mortgage interest
- −$16,693
- − Property taxes
- −$2,241
- − Insurance
- −$1,490
- − Repairs & maintenance
- −$2,465
- − Management
- −$2,465
- − HOA
- −$2,100
- − Depreciation
- −$8,669
- Taxable loss
- −$5,314
- Est. tax savings @ 24.0%
- +$1,275
- After-tax cash flow
- $1,030/yr
For passive investors: Depreciation is non-cash, so a rental often shows a tax loss while cash-flowing — sheltering income. Rental losses are passive: they offset passive income freely, and up to $25,000/yr can offset ordinary (W-2) income if you actively participate and your MAGI is under $100k (phasing out to $0 by $150k); unused losses carry forward. On sale, claimed depreciation is recaptured at up to 25%, and gains may owe capital-gains tax (a 1031 exchange can defer both). Figures are a year-1 estimate at your 24.0% rate — not tax advice; consult a CPA.
Schools (NCES district)
- District
- Yelm School District
- NCES district ID
- 5310140
- Math proficiency
- 48% ▲ 1.00%
- Reading proficiency
- 59% ▲ 1.00%
- Median HH income
- $58,328
- Composite
- 48.34/100
- National rank
- #4685
- State rank
- #108 of 291 in WA
Livability — McKenna
- Score
- 67/100
- State rank
- #300
- US rank
- #10587
Category grades
Schools grade is shown separately in the Schools card above.
Census & demographics
- County
- Thurston County · 269,345 people
- City population
- 61
- Metro
- Olympia-Lacey-Tumwater, WA
- Population (ZIP)
- 26,669
- Household income
- $92,219
- Rent vs Own
- Severe rent burden
- 259.0
Population outlook (Thurston County) Hauer SSP2
- Today (2025)
- 308,239 people
- By 2030
- 326,483 · +5.9%
- By 2040
- 359,890 · +16.8%
- By 2050
- 391,800 · +27.1%
- By 2075
- 468,024 · +51.8%
- By 2100
- 519,890 · +68.7%
Race, ethnicity, and origin ACS 2023
- Neighborhood character
- Predominantly White (76%)
- Race & ethnicity
- White 76% Two or more races 10% Hispanic / Latino 10% Black 3% Pacific Islander 2% Asian 2%
- Hispanic origin (detail)
- Mexican 7% Puerto Rican 1%
- Common ancestry
- Portuguese 5% Romanian 4% Lithuanian 3%
- Foreign-born
- 7% · Canada, South Korea
- Languages at home
- 90% English-only · Spanish 6% German/W. Germanic 1% Other Asian/Pacific 1%
Political lean MEDSL · Thurston
- 2024 margin
- Strong D (+20.4) · D 58.5% · R 38.1% · Other 3.5%
- 2008→2024 swing
- -1.3pp toward R · 2008: 21.7pp · 2024: 20.4pp
- All cycles
- 2024: D+20.4 2020: D+18.6 2016: D+15.4 2012: D+19.0 2008: D+21.7
Not yet ingested
- Civics
- —
Market trends
- HPI YoY
- ▼ -192.07%
- Current HPI
- 326.4361
- Rent YoY
- ▲ 5.78%
- Metro
- Olympia-Lacey-Tumwater, WA
- State GDP YoY
- ▲ 4.65%
- F500 in state
- 22
Industry mix (Fortune 500 HQ in WA)
| Industry | F500 HQs | Revenue |
|---|---|---|
| Retail | 2 | $269B |
|
||
| Technology / Retail | 1 | $638B |
|
||
| Technology | 1 | $245B |
|
||
| Telecommunications | 1 | $38B |
|
||
| Food / Beverage | 1 | $36B |
|
||
| Automotive / Trucks | 1 | $34B |
|
||
Price history
+273.0% since first listed13 events — show timeline
- 2026-05-09 Listed $298,000 NWMLS as Distributed by MLS Grid
- 2022-03-18 Sold (MLS) $350,000 NWMLS as Distributed by MLS Grid
- 2022-02-12 Pending — NWMLS as Distributed by MLS Grid
- 2022-01-14 Listed $350,000 NWMLS as Distributed by MLS Grid
- 2011-05-13 Pending — NWMLS as Distributed by MLS Grid
- 2011-05-13 Sold (MLS) $69,000 NWMLS as Distributed by MLS Grid
- 2011-05-03 Pending — NWMLS as Distributed by MLS Grid
- 2011-04-14 Price Changed $70,000 NWMLS as Distributed by MLS Grid
- 2011-03-31 Listed $74,900 NWMLS as Distributed by MLS Grid
- 2006-02-28 Sold (Public Records) $167,000 Public Records
- 2006-02-28 Sold (MLS) $167,000 NWMLS as Distributed by MLS Grid
- 2006-01-07 Listed $167,000 NWMLS as Distributed by MLS Grid
- 1995-07-31 Sold (Public Records) $79,900 Public Records
Property tax history
+2.2%/yrLatest (2026): $2,241 · +6.2% YoY. Source: county tax records.
Cash-flow waterfall
monthlySold comps — $/sqft
last 12 mo · ≤1 miLoading sold comps…