 Multi-family
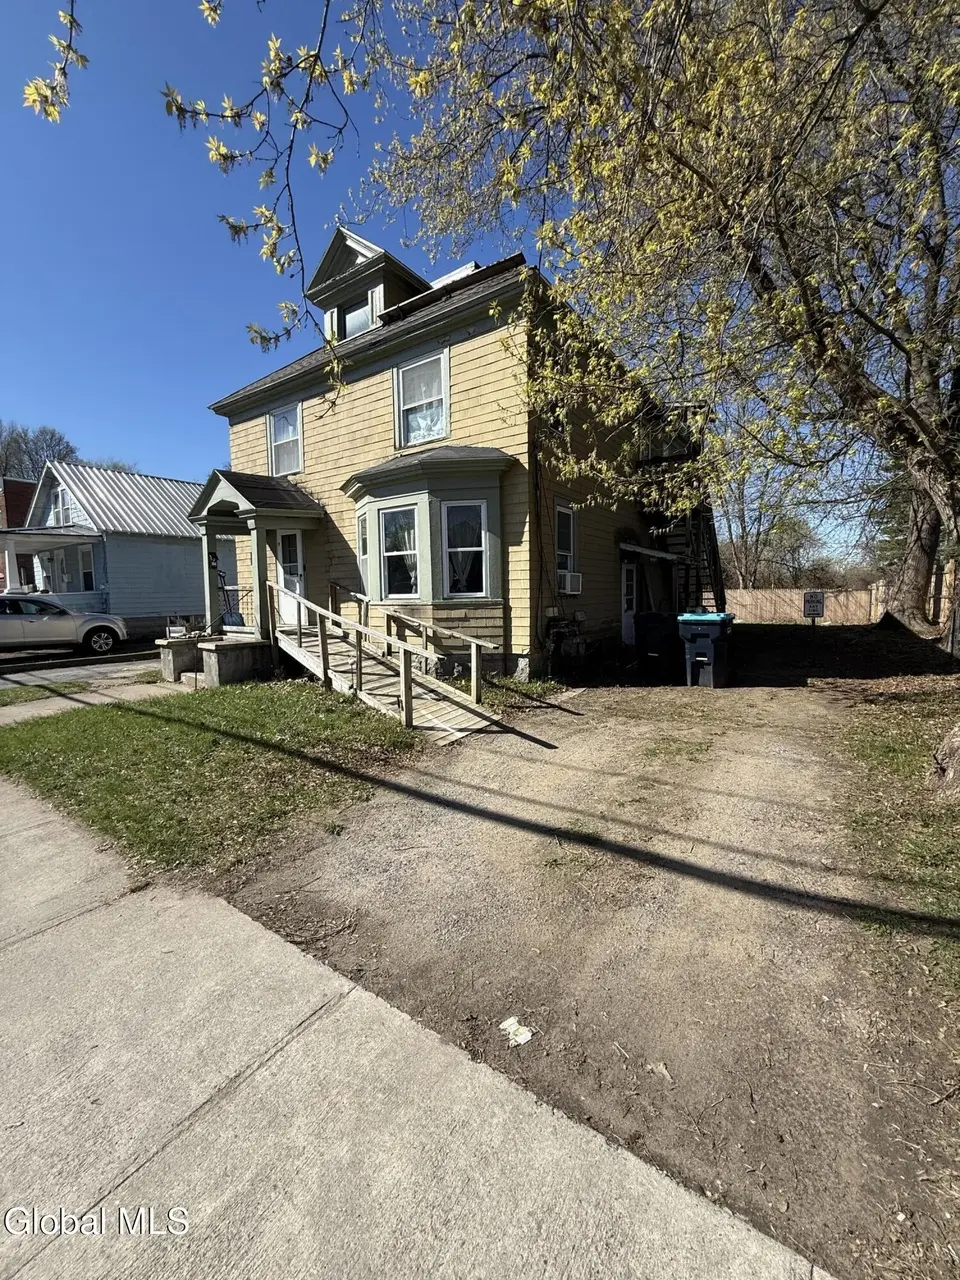
9 Feeder St · Hudson Falls, NY
Flood risk 1/10 · Minimal
- FEMA flood zone
- —
- Chance of flooding over 30 yrs
- 0.0%
- Est. flood insurance / yr
- —
Fire risk 3/10 · Minor
- Est. fire insurance / yr
- $691 – $1,283
Heat risk 3/10 · Minor
- Hot days now (above 96°F)
- 7 days/yr
- Hot days in 30 yrs
- 16 days/yr
Wind risk 2/10 · Minimal
- Chance of severe wind over 30 yrs
- 3.0%
Air-quality risk 1/10 · Minimal
- Unhealthy air days now
- 0 days/yr
- Unhealthy air days in 30 yrs
- 0 days/yr
Risk factors via First Street. Map © Google.
Why this score? — see what drove the A grade
The composite is a weighted blend of 9 inputs, each scored 0–100. Each bar is that input's sub-score; the figure is the points it added to the 100-point composite (weight × sub-score).
- Cash flow +30.0/30.0
- ARV discount +15.0/15.0
- 1% rule +10.0/10.0
- DSCR +10.0/10.0
- Appreciation +10.0/10.0
- Schools +3.7/10.0
- Livability +3.5/5.0
- Rent growth +2.5/5.0
- Condition / age +2.5/5.0
$165,000
🖨 Deal sheet (PDF) 📄 Offer letter ✓ Due diligence
Multi-family units
County records classify this as Multi-Family (2-4 Unit). Listing-text estimate: 1 unit. estimate disagrees with records
Listing remarks
Great opportunity to own a multi-family investment property with strong income potential. The first-floor unit features a spacious 3-bedroom layout, while the second-floor unit offers 2 bedrooms. Ideal for owner-occupants or investors looking to generate consistent cash flow. Don't miss your chance to add this solid property to your portfolio.
Key facts
- 3,920 sq ft lot
- 4 parking spots
- Built 1930
Property features AI
Finance
- Financial info: Owner pays trash collection; Tenants pay heat, electricity, internet, cable TV, and snow removal; Property has 2 total units
Exterior
- Parking: Off-street parking; Driveway; 4 total parking spaces
- Security: Carbon monoxide detector(s)
- Utilities: 100 Amp electric service; Public water; Public sewer; Cable available
- Home design: Duplex; Fixer condition
- Construction: Shingle roof; Asbestos and drywall construction materials; Stone and other foundation
- Exterior features: Front porch; Rear covered porch; Wood fencing around backyard; Level, cleared lot
Interior
- Bedrooms: Unit 1: 3 bedrooms; Unit 2: 2 bedrooms
- Flooring: Carpet; Hardwood; Laminate; Linoleum
- Bathrooms: 2 full bathrooms (one on 1st level, one on 2nd level); Unit 1: 1 full bath; Unit 2: 1 full bath
- Heating & cooling: Electric heating; Forced air; Natural gas heating
- Interior features: Paddle fan; High-speed internet
- Laundry & utility: Washer hookup; Electric dryer hookup; Laundry located in basement
Neighborhood map
What this means for you Summary
Snapshot
- This is a 4-bed/2.0-bath multifamily listed at $165k.
Deal economics
- At list price, monthly cash flow is $816 ($10k/yr) — positive.
- The deal already cash-flows at list — no discount required.
- Meets the 1% rule at list price ($3k rent vs $165k).
- Recommended offer: $160k (3.0% below list) — sets the bar for market timing.
- Cap rate 12.2% vs local median 3.9% in Hudson Falls — top-decile yield for the area; either an underpriced asset or a hidden risk that comps aren't pricing in. Stress-test before assuming the spread holds.
Location & tenants
- Location reads 69/100 on livability (#481 in NY) — a middle-class / working-renter tenant base. Strengths: housing A+, health & safety A+, cost of living A-; Watch: crime D, employment D, amenities F.
- Hudson Falls Central School District (suburban): math 39% / reading 47% proficiency, ranked #486 of 590 in NY (top 82%) — families likely to look elsewhere, expect single-tenant / working-renter base with shorter leases.
- Zoned schools: Hudson Falls Primary School (math 42% / reading 47%, grade F, #1,277 of 2,108 statewide, top 64%, 429 students, 42% FRL); Hudson Falls Middle School (math 16% / reading 44%, grade F, #539 of 729 statewide, top 74%, 498 students, 39% FRL); Hudson Falls High School (math 87% / reading 77%, grade A, #452 of 1,100 statewide, top 44%, 694 students, 38% FRL) — zoned schools at 40% FRL track the district average.
- Market conditions: 58 active listings in the ZIP; 106 units permitted in Washington County in 2024 (0 in 5+ unit buildings).
Forward outlook
- In year one you build about $18k of equity ($1k loan paydown + $16k appreciation (10.0% local appreciation)).
- Washington County population projected at -20% by 2050 — secular population decline; favor cash flow + early exit over multi-decade hold.
- At projected returns (10.0% appreciation + 3.0% rent growth), your $46k cash investment doubles in ~2 years — after that, you're playing with house money.
- By year 3, paydown + projected appreciation supports a ~$45k cash-out refi (75% LTV) — recoverable capital for the next deal without selling this one.
Negotiation context
- It's been on market 56 days — a 3% lower offer ($160k) is reasonable based on typical stale-listing flexibility.
- 2 sale attempts since 13y ago with the ask held roughly flat each time — persistent listings suggest the price (not the market) is what's stuck; bring a comps-based counter.
Risks & watch-outs
- Watch-outs: built in 1930 — expect roof / HVAC / electrical / plumbing capex.
Questions for the listing agent
- It's been on market 56 days. Have you received any prior offers? Is the seller open to a 3% concession, seller financing, or rate buy-down credit?
- Built in 1930 — when were the roof, HVAC, electrical panel, plumbing, and water heater last replaced?
- Is there a deadline driving the sale (1031 exchange, divorce, estate, relocation)? That informs how much negotiation room exists.
- Crime grade is D in this area — have there been break-ins, vandalism, or insurance claims at this property in the last 3 years? What carrier currently insures it and at what premium?
- What's the average days-on-market for RENTAL listings here right now (not sales)? A rising rental-DOM trend means longer vacancies and softer asking-rent achievability than the comps imply.
- What's the recent tenant-quality profile in this submarket — average credit score on applications, eviction rate, late-payment / NSF rate, and stable-employment percentage? A property-management company in the area should have these aggregated.
- How much new apartment / multifamily construction is in the pipeline within 1–3 miles? Heavy new supply (>2% of stock underway) typically softens rents 12–24 months out; light construction supports rent growth.
Investment metrics
- 1% rule
- 1.58% ✓
- Cap rate
- 12.23%
- Cash-on-cash
- 21.20%
- DSCR
- 1.94
- GRM
- 5.3
CMA / ARV
- ARV (median comp)
- $320,767
- List price
- $165,000
- Delta
- -48.56%
- Verdict
- UNDERPRICED
- Comps
- 20 within 1.0 mi
Show comp detail 7 sales within ~0.75 mi
| Address | Dist | Beds/Ba | Sqft | Sold | Price | $/sf | Match |
|---|---|---|---|---|---|---|---|
| 280 Main St | 0.07mi | 4/3.0 | 1,856 (-6%) | 2mo | $90,000 | $48 | 81 |
| 21-23 Maple Ave | 0.41mi | 4/2.0 | 1,914 (-3%) | 0mo | $245,000 | $128 | 75 |
| 6 N Oak St | 0.32mi | 4/2.0 | 1,960 (-1%) | 20mo | $191,000 | $97 | 66 |
| 17-19 Maple Ave | 0.43mi | 4/2.0 | 1,914 (-3%) | 17mo | $220,000 | $115 | 61 |
| 8 Hudson Pl | 0.67mi | 4/2.0 | 1,994 (+1%) | 18mo | $152,500 | $76 | 52 |
| 3 Hudson Pl | 0.66mi | 5/2.0 (+1) | 1,820 (-8%) | 2mo | $180,000 | $99 | 49 |
| 60 River St | 0.44mi | 4/2.0 | 1,740 (-12%) | 23mo | $165,000 | $95 | 40 |
Match score weights: distance 35% · size 25% · config 20% · recency 20%. Top-matched comps best support the ARV.
Projected returns pro-forma
10.0% appreciation · 3.0% rent growth · sell at horizon
- IRR
- 40.1%
- Equity multiple
- 4.07×
- Total profit
- $141,941
- Equity at exit
- $148,645
- IRR
- 34.6%
- Equity multiple
- 9.17×
- Total profit
- $377,316
- Equity at exit
- $320,559
Cash invested: $46,200 (down + closing). Projections, not guarantees.
Landlord ↔ Tenant lean methodology
- Overall (STATE)
- 15 Strongly Tenant-Friendly
- State New York
- 15 Strongly Tenant-Friendly · D+10
- County
- — inherits STATE
- City
- — inherits STATE
ZIP-level market 12839
- Home prices YoY
- 8.5%
- Active inventory
- 58
- Price-to-rent
- 9.5×
Monthly cashflow live
- Estimated rent
- $2,601 medium interval (Pro) →
- Mortgage (P&I)
- −$865
- Tax from tax record
- −$305 /mo · $3,656/yr
- Insurance
- −$69
- HOA
- −$0
- Vacancy / Maint / Mgmt
- −$546
- Net cashflow
- $816
Break-even live
Sensitivity live
| Price | -10% $910 | -5% $863 | +0% $816 | +5% $769 | +10% $723 |
|---|---|---|---|---|---|
| Rent | -10% $611 | -5% $713 | +0% $816 | +5% $919 | +10% $1,022 |
| Rate | -1.0pp $899 | -0.5pp $858 | base $816 | +0.5pp $773 | +1.0pp $730 |
2-unit breakdown (identical units grouped — click to expand)
| Units | Beds | Baths | Est. rent |
|---|---|---|---|
| 1× unit | 3 | 1 | $1,451 |
| 1× unit | 2 | 1 | $1,150 |
| Total (2 units) | $2,601 | ||
UW: 25.0% down · 7.5% · 30yr · 1.5% tax · 5.0% vac · 8.0% maint · 8.0% mgmt
Financing live
Cash to close
- Down payment
- $41,250
- Closing costs
- $4,950
- Reserves months
- —
- Total cash needed
- —
Loan-product check · same deal, 3 products live
Conventional
25% down · 7.5% · 30yr
- Down + closing
- —
- Monthly P&I
- —
- Monthly cashflow
- —
- DSCR
- —
- Eligible?
- —
Personal DTI + credit; lowest rate.
DSCR
20% down · 8.5% · 30yr
- Down + closing
- —
- Monthly P&I
- —
- Monthly cashflow
- —
- DSCR
- —
- Eligible?
- —
No personal income docs; deal must DSCR.
Hard money
10% down · 12.0% · 12mo
- Down + closing
- —
- Monthly P&I
- —
- Monthly cashflow
- —
- DSCR
- —
- Eligible?
- —
Short-term bridge; refi at stabilization.
Listing history 20 events
-
2026-06-21days on market $165,000 Active 56 DOM
-
2026-06-18days on market $165,000 Active 53 DOM
-
2026-06-17days on market $165,000 Active 52 DOM
-
2026-06-16days on market $165,000 Active 51 DOM
-
2026-06-15days on market $165,000 Active 50 DOM
-
2026-06-14days on market $165,000 Active 48 DOM
-
2026-06-13days on market $165,000 Active 47 DOM
-
2026-06-10days on market $165,000 Active 45 DOM
-
2026-06-09days on market $165,000 Active 44 DOM
-
2026-06-08days on market $165,000 Active 43 DOM
-
2026-06-07days on market $165,000 Active 42 DOM
-
2026-06-03days on market $165,000 Active 38 DOM
-
2026-06-02days on market $165,000 Active 37 DOM
-
2026-06-01days on market $165,000 Active 36 DOM
-
2026-05-31days on market $165,000 Active 35 DOM
-
2026-05-31days on market $165,000 Active 34 DOM
-
2026-05-01price $165,000 345-char remark
-
2026-04-26$172,000 Active 345-char remark
-
2014-11-25historical
-
2013-11-25$74,900
ⓘ Source: listings_history table (triggers on properties + properties_extension) + one-shot
backfill from property_details.listing_events for pre-trigger history.
Tax reassessment forecast NY · Partial reset (capped growth)
- Current annual tax
- $3,656 · $305/mo
- Projected year-2 tax
- $3,656 · $305/mo
- Expected delta
- $0/yr ($0/mo · 0.0%)
ⓘ Screening estimate from a state-policy table — verify with the county assessor before closing.
Climate risk First Street
- Flood 1/10 Low 0% chance over 30 yrs
- Wildfire 3/10 Moderate
- Heat 3/10 Moderate 7 d/yr ≥96°F today · 16 d/yr by 30 yrs out
- Wind 2/10 Low 3% chance of damaging wind over 30 yrs
- Air quality 1/10 Low 0 unhealthy d/yr today · 0 by 30 yrs out
Nearby sold comps map
Loading sold comps map…
Walkable amenities ~0.75 mi
Loading nearby amenities…
Taxation est. · year 1
- Rental income
- $31,212
- − Mortgage interest
- −$9,243
- − Property taxes
- −$3,656
- − Insurance
- −$825
- − Repairs & maintenance
- −$2,497
- − Management
- −$2,497
- − Depreciation
- −$4,800
- Taxable income
- $7,695
- Est. tax owed @ 24.0%
- −$1,847
- After-tax cash flow
- $7,947/yr
For passive investors: Depreciation is non-cash, so a rental often shows a tax loss while cash-flowing — sheltering income. Rental losses are passive: they offset passive income freely, and up to $25,000/yr can offset ordinary (W-2) income if you actively participate and your MAGI is under $100k (phasing out to $0 by $150k); unused losses carry forward. On sale, claimed depreciation is recaptured at up to 25%, and gains may owe capital-gains tax (a 1031 exchange can defer both). Figures are a year-1 estimate at your 24.0% rate — not tax advice; consult a CPA.
Schools (NCES district)
- District
- Hudson Falls Central School District
- NCES district ID
- 3614970
- Math proficiency
- 39% ▼ -8.00%
- Reading proficiency
- 47% ▲ 6.00%
- Median HH income
- $46,019
- Composite
- 36.57/100
- National rank
- #4635
- State rank
- #486 of 590 in NY
Livability — Hudson Falls
- Score
- 69/100
- State rank
- #481
- US rank
- #8482
Category grades
Schools grade is shown separately in the Schools card above.
Census & demographics
- Census place
- Hudson Falls, NY
- Population (ZIP)
- 13,618
Population outlook (Washington County) Hauer SSP2
- Today (2025)
- 59,576 people
- By 2030
- 57,618 · -3.3%
- By 2040
- 52,751 · -11.5%
- By 2050
- 47,514 · -20.2%
- By 2075
- 35,690 · -40.1%
- By 2100
- 24,807 · -58.4%
Race, ethnicity, and origin ACS 2023
- Neighborhood character
- Predominantly White (89%)
- Race & ethnicity
- White 89% Hispanic / Latino 4% Two or more races 4%
- Common ancestry
- Lithuanian 8% Slovak 5% Estonian 3%
- Foreign-born
- 5% · Canada, Guatemala
- Languages at home
- 92% English-only · Spanish 4% Other Indo-European 2% German/W. Germanic 2%
Political lean MEDSL · Washington
- 2024 margin
- Strong R (+21.2) · D 39.4% · R 60.6%
- 2008→2024 swing
- -22.0pp toward R · 2008: 0.8pp · 2024: -21.2pp
- All cycles
- 2024: R+21.2 2020: R+15.6 2016: R+20.2 2012: D+1.6 2008: D+0.8
Not yet ingested
- Civics
- —
Market trends
- HPI YoY
- ▲ 25.92%
- Current HPI
- 331.6315
- Rent YoY
- —
- Metro
- —
- State GDP YoY
- ▲ 2.60%
- F500 in state
- 92
Industry mix (Fortune 500 HQ in NY)
| Industry | F500 HQs | Revenue |
|---|---|---|
| Financial Services | 10 | $950B |
|
||
| Consumer Goods | 9 | $162B |
|
||
| Insurance | 4 | $225B |
|
||
| Telecommunications | 2 | $144B |
|
||
| Pharmaceuticals | 2 | $112B |
|
||
| Media / Entertainment | 2 | $69B |
|
||
Price history
+120.3% since first listed4 events — show timeline
- 2026-05-01 Price Changed $165,000 Global MLS
- 2026-04-26 Listed $172,000 Global MLS
- 2014-11-25 Listing Removed — Global MLS
- 2013-11-25 Listed $74,900 Global MLS
Property tax history
+3.0%/yrLatest (2025): $3,656 · +15.8% YoY. Source: county tax records.
Cash-flow waterfall
monthlySold comps — $/sqft
last 12 mo · ≤1 miLoading sold comps…