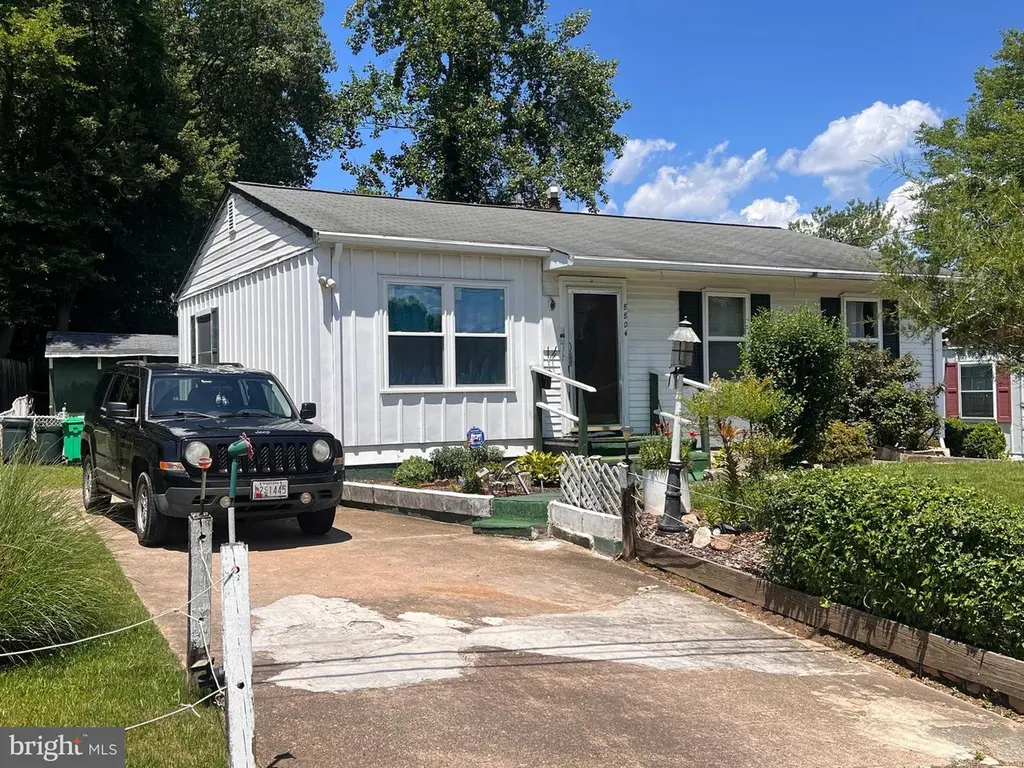
8804 Mchenry Ln · Lanham, MD
Flood risk 1/10 · Minimal
- FEMA flood zone
- X (unshaded)
- Chance of flooding over 30 yrs
- 0.0%
- Est. flood insurance / yr
- $473 – $860
Fire risk 3/10 · Minor
- Est. fire insurance / yr
- $755 – $1,403
Heat risk 7/10 · Major
- Hot days now (above 104°F)
- 7 days/yr
- Hot days in 30 yrs
- 15 days/yr
Wind risk 5/10 · Moderate
- Chance of severe wind over 30 yrs
- 23.0%
Air-quality risk 5/10 · Moderate
- Unhealthy air days now
- 6 days/yr
- Unhealthy air days in 30 yrs
- 7 days/yr
Risk factors via First Street. Map © Google.
Why this score? — see what drove the F grade
The composite is a weighted blend of 9 inputs, each scored 0–100. Each bar is that input's sub-score; the figure is the points it added to the 100-point composite (weight × sub-score).
- ARV discount +9.8/15.0
- Cash flow +8.2/30.0
- Livability +3.3/5.0
- Condition / age +2.5/5.0
- DSCR +2.2/10.0
- 1% rule +2.1/10.0
- Rent growth +2.0/5.0
- Schools +1.7/10.0
- Appreciation +0.0/10.0
$360,000
🖨 Deal sheet 📄 Offer letter ✓ Due diligence
Listing remarks MLS
Owner has done many improvements over the years. remodeled kitchen newer Roof and HVAC system. Great Starter home. Enjoy the large deck on back of house. Long driveway for 2-3 cars. THIS IS FHA SHORT SELL. FHA ALLOWS ONLY 1 % CLOSING HELP. Show and sell. Owner requests no showings before 12:00 Noon
Key facts
- 6,301 sq ft lot
- 2 parking spots
- Built 1959
Property features AI
Finance
- Other: Total below-grade area estimated at 925; Above-grade finished area recorded as 925; Below-grade finished area estimated at 925; Ground rent payment frequency: annually
Exterior
- Parking: Two total garage and parking spaces; Concrete driveway with two driveway spaces; On-street parking available
- Security: Pets allowed with no pet restrictions
- Utilities: Public water; Public sewer; Natural gas available; Electric available (120/240V); Cable TV available; Hot water: natural gas
- Home design: Detached single-family home; Two levels; Fee simple ownership; Property in average condition; Not in a federal flood zone; No tidal water
- Construction: Frame construction; Slab foundation; Roof: unknown; Built year source: assessor
- Exterior features: Rear fencing; Level lot
Interior
- Kitchen: Dishwasher; Icemaker; Oven (single); Gas range; Refrigerator; Exhaust fan
- Basement: Fully finished lower level with connecting stairway; Heated, poured concrete foundation; Sump pump and windows; Daylight/partial and improved
- Bedrooms: Four bedrooms on the main level; Entry-level bedroom
- Flooring: Wood floors
- Bathrooms: Two full bathrooms (both on the main level)
- Heating & cooling: 90% efficiency forced air heating (natural gas); Central air conditioning (electric)
- Interior features: Combination kitchen/dining; Ceiling fan(s); Family room off kitchen; Traditional floor plan; Eat-in kitchen; Wood floors; Estimated living area
- Laundry & utility: Washer and dryer in unit; Laundry located on lower floor; Water heater
Neighborhood map
What this means for you Summary
Snapshot
- This is a 4-bed/1.0-bath single-family listed at $360k.
Deal economics
- At list price, monthly cash flow is $-333 ($-4k/yr) — negative.
- To cash-flow at today's rent, offer at most $301k (16.3% below list).
- To meet the 1% rule (rent ≥ 1% of price), the offer needs to be $255k (29.1% below list).
- Recommended offer: $255k (29.1% below list) — sets the bar for 1% rule.
- Cap rate 5.2% vs local median 4.2% in Lanham — meaningfully above typical; check what's discounted (condition, days-on-market, listing class) to confirm the premium yield is real.
Location & tenants
- Location reads 66/100 on livability (#244 in MD) — a middle-class / working-renter tenant base. Strengths: employment A+, housing A+; Watch: health & safety C-, crime D, schools D-.
- Prince George'S County Public Schools (suburban): math 8% / reading 24% proficiency, ranked #21 of 24 in MD (top 88%) — low school quality limits family demand, transient renter base, plan for 1-2y turnover.
- Market conditions: Rents soft (-1.9%/yr); 124 active listings in the ZIP; 3 comparable units currently listed for rent nearby; rentals leasing fast (median 2d on market — plan ~1-2 weeks tenant-placement turnaround); solid renter incomes; 1,481 units permitted in Prince George's County in 2024 (0 in 5+ unit buildings).
Forward outlook
- Local home prices are declining (-3.0%/yr); year-one equity from $2k of loan paydown is wiped out by about $11k of value loss. Plan a longer hold.
- Prince George's County population projected at +18% by 2050 — long-run rental-demand tailwind backs the buy-and-hold thesis.
Negotiation context
- Only 6 days on market — expect competitive offers; lowballing is unlikely to land.
- 3 sale attempts since 14y ago with the ask held roughly flat each time — persistent listings suggest the price (not the market) is what's stuck; bring a comps-based counter.
- Current owner paid $145k; list at $360k implies a 148% gain — meaningful room to come down on a strong offer.
Risks & watch-outs
- Watch-outs: built in 1959 — expect roof / HVAC / electrical / plumbing capex.
- Climate carrying-cost: moderate wind risk, 23% chance of damaging wind over 30y; extreme-heat days projected 7→15/yr by 2055 (HVAC capex compounding) — expect insurance premiums to compound above CPI over the hold.
Questions for the listing agent
- What do current leases actually rent for vs. the listed asking? Can we see a recent rent roll and the last 12 months of T-12 income?
- Built in 1959 — when were the roof, HVAC, electrical panel, plumbing, and water heater last replaced?
- Is there a deadline driving the sale (1031 exchange, divorce, estate, relocation)? That informs how much negotiation room exists.
- Schools are D-rated, which usually means shorter tenancies and higher turnover. Who's the typical renter profile here, and what's been the actual vacancy rate?
- Crime grade is D in this area — have there been break-ins, vandalism, or insurance claims at this property in the last 3 years? What carrier currently insures it and at what premium?
- The area grade is low — what's the realistic commute time and amenity access for the typical tenant pool here? Any planned neighborhood developments (good or bad) we should know about?
- What's the average days-on-market for RENTAL listings here right now (not sales)? A rising rental-DOM trend means longer vacancies and softer asking-rent achievability than the comps imply.
- What's the recent tenant-quality profile in this submarket — average credit score on applications, eviction rate, late-payment / NSF rate, and stable-employment percentage? A property-management company in the area should have these aggregated.
- How much new for-sale + rental construction is in the pipeline within 1–3 miles? Heavy new supply typically softens prices + rents 12–24 months out; constrained supply supports both.
Investment metrics
- 1% rule
- 0.71% ✗
- Cap rate
- 5.18%
- Cash-on-cash
- -3.96%
- DSCR
- 0.82
- GRM
- 11.8
CMA / ARV
- ARV (on-the-fly)
- $379,250
- Comps found
- 12
Show comp detail 12 sales within ~0.75 mi
| Address | Dist | Beds/Ba | Sqft | Sold | Price | $/sf | Match |
|---|---|---|---|---|---|---|---|
| 5513 Cordona St | 0.13mi | 4/2.0 | 1,040 (+12%) | 4mo | $360,000 | $346 | 66 |
| 9212 Morley Rd | 0.18mi | 3/1.5 (-1) | 1,000 (+8%) | 8mo | $410,000 | $410 | 65 |
| 5521 Belva St | 0.17mi | 4/2.5 | 1,036 (+12%) | 3mo | $351,000 | $339 | 64 |
| 9209 Roxanne Dr | 0.04mi | 4/2.0 | 1,000 (+8%) | 21mo | $450,000 | $450 | 64 |
| 9300 Worrell Ave | 0.44mi | 3/2.0 (-1) | 988 (+7%) | 1mo | $450,000 | $455 | 58 |
| 9304 Kimbark Ave | 0.42mi | 3/1.5 (-1) | 999 (+8%) | 9mo | $400,000 | $400 | 53 |
| 9110 Kinzer St | 0.14mi | 5/2.0 (+1) | 1,056 (+14%) | 12mo | $480,000 | $455 | 51 |
| 6129 Naval Ave | 0.65mi | 3/1.5 (-1) | 820 (-11%) | 1mo | $310,000 | $378 | 43 |
| 6005 Magnolia Ct | 0.54mi | 5/2.5 (+1) | 994 (+8%) | 12mo | $450,000 | $453 | 41 |
| 5411 Arnold Dr | 0.41mi | 3/1.0 (-1) | 1,050 (+14%) | 20mo | $390,000 | $371 | 37 |
| 9213 Rolling View Dr | 0.39mi | 3/2.0 (-1) | 1,050 (+14%) | 18mo | $435,000 | $414 | 35 |
| 9344 Worrell Ave | 0.59mi | 3/2.0 (-1) | 1,032 (+12%) | 21mo | $415,000 | $402 | 27 |
Match score weights: distance 35% · size 25% · config 20% · recency 20%. Top-matched comps best support the ARV.
Projected returns pro-forma
-3.0% appreciation · 0.0% rent growth · sell at horizon
- IRR
- -26.2%
- Equity multiple
- 0.14×
- Total profit
- $-87,054
- Equity at exit
- $53,677
- IRR
- -35.9%
- Equity multiple
- -0.31×
- Total profit
- $-132,189
- Equity at exit
- $31,126
Cash invested: $100,800 (down + closing). Projections, not guarantees.
Landlord ↔ Tenant lean methodology
- Overall (STATE)
- 27 Tenant-Leaning
- State Maryland
- 27 Tenant-Leaning · D+14
- County
- — inherits STATE
- City
- — inherits STATE
ZIP-level market 20706
- Rents YoY
- -1.9%
- Active inventory
- 124
- Price-to-rent
- 11.8×
Monthly cashflow live
- Estimated rent
- $2,552 medium interval (Pro) →
- Mortgage (P&I)
- −$1,888
- Tax from tax record
- −$311 /mo · $3,731/yr
- Insurance
- −$150
- HOA
- −$0
- Vacancy / Maint / Mgmt
- −$536
- Net cashflow
- $-333
Break-even live
UW: 25.0% down · 7.5% · 30yr · 1.5% tax · 5.0% vac · 8.0% maint · 8.0% mgmt
Financing live
Cash to close
- Down payment
- $90,000
- Closing costs
- $10,800
- Reserves months
- —
- Total cash needed
- —
Loan-product check · same deal, 3 products live
Conventional
25% down · 7.5% · 30yr
- Down + closing
- —
- Monthly P&I
- —
- Monthly cashflow
- —
- DSCR
- —
- Eligible?
- —
Personal DTI + credit; lowest rate.
DSCR
20% down · 8.5% · 30yr
- Down + closing
- —
- Monthly P&I
- —
- Monthly cashflow
- —
- DSCR
- —
- Eligible?
- —
No personal income docs; deal must DSCR.
Hard money
10% down · 12.0% · 12mo
- Down + closing
- —
- Monthly P&I
- —
- Monthly cashflow
- —
- DSCR
- —
- Eligible?
- —
Short-term bridge; refi at stabilization.
Rent comps 3 comps
| Address | Beds | Baths | Sqft | Rent | $/sqft | DOM | Units | Dist |
|---|---|---|---|---|---|---|---|---|
| 5345 85th Ave New Carrollton, MD | 1.0–3.0 | 1.0–2.0 | 979 | $2,149 | $2.19 | 1d | 18 | 0.94mi |
| 4050 Garden City Dr Hyattsville, MD | 3.0 | 1.0–3.0 | 757 | $2,908 | $3.84 | 2d | 28 | 1.35mi |
| 7742 Finns Ln Lanham, MD | 2.0–3.0 | 1.0–2.0 | 975 | $2,000 | $2.05 | 5d | 5 | 1.39mi |
Listing history 4 events
-
2026-06-13statusdays on market $360,000 Pending 6 DOM
-
2026-06-10days on market $360,000 Active 2 DOM
-
2026-06-08remarks 94-char remark
-
2026-06-08$360,000 Active 1 DOM
ⓘ Source: listings_history table (triggers on properties + properties_extension) + one-shot
backfill from property_details.listing_events for pre-trigger history.
Tax reassessment forecast MD · Partial reset (capped growth)
- Current annual tax
- $3,731 · $311/mo
- Projected year-2 tax
- $3,828 · $319/mo
- Expected delta
- +$96/yr (+$8/mo · 2.6%)
ⓘ Screening estimate from a state-policy table — verify with the county assessor before closing.
Climate risk First Street
- Flood 1/10 Low FEMA zone X (unshaded) · 0% chance over 30 yrs
- Wildfire 3/10 Moderate
- Heat 7/10 Severe 7 d/yr ≥104°F today · 15 d/yr by 30 yrs out
- Wind 5/10 Major 23% chance of damaging wind over 30 yrs
- Air quality 5/10 Major 6 unhealthy d/yr today · 7 by 30 yrs out
Nearby sold comps map
Loading sold comps map…
Walkable amenities ~0.75 mi
Loading nearby amenities…
Taxation est. · year 1
- Rental income
- $30,624
- − Mortgage interest
- −$20,166
- − Property taxes
- −$3,731
- − Insurance
- −$1,800
- − Repairs & maintenance
- −$2,450
- − Management
- −$2,450
- − Depreciation
- −$10,473
- Taxable loss
- −$10,446
- Est. tax savings @ 24.0%
- +$2,507
- After-tax cash flow
- $-1,486/yr
For passive investors: Depreciation is non-cash, so a rental often shows a tax loss while cash-flowing — sheltering income. Rental losses are passive: they offset passive income freely, and up to $25,000/yr can offset ordinary (W-2) income if you actively participate and your MAGI is under $100k (phasing out to $0 by $150k); unused losses carry forward. On sale, claimed depreciation is recaptured at up to 25%, and gains may owe capital-gains tax (a 1031 exchange can defer both). Figures are a year-1 estimate at your 24.0% rate — not tax advice; consult a CPA.
Schools (NCES district)
- District
- Prince George'S County Public Schools
- NCES district ID
- 2400510
- Math proficiency
- 8% ▼ -11.00%
- Reading proficiency
- 24% ▼ -9.00%
- Median HH income
- $73,967
- Composite
- 16.82/100
- National rank
- #9151
- State rank
- #21 of 24 in MD
Livability — Lanham
- Score
- 66/100
- State rank
- #244
- US rank
- #12106
Category grades
Schools grade is shown separately in the Schools card above.
Census & demographics
- Census place
- Lanham, MD
- County
- Prince Georges County · 919,866 people
- City population
- 43,225
- Metro
- Washington-Arlington-Alexandria, DC-VA-MD-WV
- Population (ZIP)
- 42,612
- Household income
- $104,523
- Rent vs Own
- Severe rent burden
- 641.0
Population outlook (Prince George's County) Hauer SSP2
- Today (2025)
- 1,005,426 people
- By 2030
- 1,048,416 · +4.3%
- By 2040
- 1,123,425 · +11.7%
- By 2050
- 1,183,220 · +17.7%
- By 2075
- 1,306,202 · +29.9%
- By 2100
- 1,408,179 · +40.1%
Race, ethnicity, and origin ACS 2023
- Neighborhood character
- Diverse neighborhood (Simpson 0.58)
- Race & ethnicity
- Black 59% Hispanic / Latino 26% Two or more races 10% White 7% Asian 5%
- Hispanic origin (detail)
- Mexican 9% Dominican 2%
- Common ancestry
- Hispanic 1% Swiss 1%
- Foreign-born
- 37% · Canada, United Kingdom, Vietnam
- Languages at home
- 60% English-only · Spanish 23% French/Haitian/Cajun 4% Other Indo-European 3%
Political lean MEDSL · Prince George's
- 2024 margin
- Solid D (+75.2) · D 86.3% · R 11.2% · Other 2.5%
- 2008→2024 swing
- -3.3pp toward R · 2008: 78.5pp · 2024: 75.2pp
- All cycles
- 2024: D+75.2 2020: D+80.5 2016: D+81.0 2012: D+80.9 2008: D+78.5
Not yet ingested
- Civics
- —
Market trends
- HPI YoY
- ▼ -279.37%
- Current HPI
- 284.8481
- Rent YoY
- ▼ -1.85%
- Metro
- Washington-Arlington-Alexandria, DC-VA-MD-WV
- State GDP YoY
- ▲ 2.97%
- F500 in state
- 12
Industry mix (Fortune 500 HQ in MD)
| Industry | F500 HQs | Revenue |
|---|---|---|
| Aerospace / Defense | 1 | $71B |
|
||
| Utilities | 1 | $25B |
|
||
| Hotels | 1 | $24B |
|
||
| Consumer Goods | 1 | $7B |
|
||
| Real Estate | 1 | $6B |
|
||
| Chemicals | 1 | $2B |
|
||
Price history
+2435.2% since first listed11 events — show timeline
- 2026-06-08 Listed $360,000 BRIGHT MLS
- 2013-01-30 Sold (Public Records) $145,000 Public Records
- 2013-01-19 Delisted — MRIS
- 2013-01-17 Sold (MLS) $145,000 BRIGHT MLS
- 2013-01-17 Sold (MLS) $145,000 MRIS
- 2012-08-10 Pending — MRIS
- 2012-08-09 Listing Removed — BRIGHT MLS
- 2012-07-27 Listed $150,000 MRIS
- 2012-07-26 Listed $150,000 BRIGHT MLS
- 1996-07-31 Sold (Public Records) $109,900 Public Records
- 1959-08-07 Sold (Public Records) $14,200 Public Records
Property tax history
+6.1%/yrLatest (2025): $3,731 · +3.9% YoY. Source: county tax records.
Cash-flow waterfall
monthlySold comps — $/sqft
last 12 mo · ≤1 miLoading sold comps…