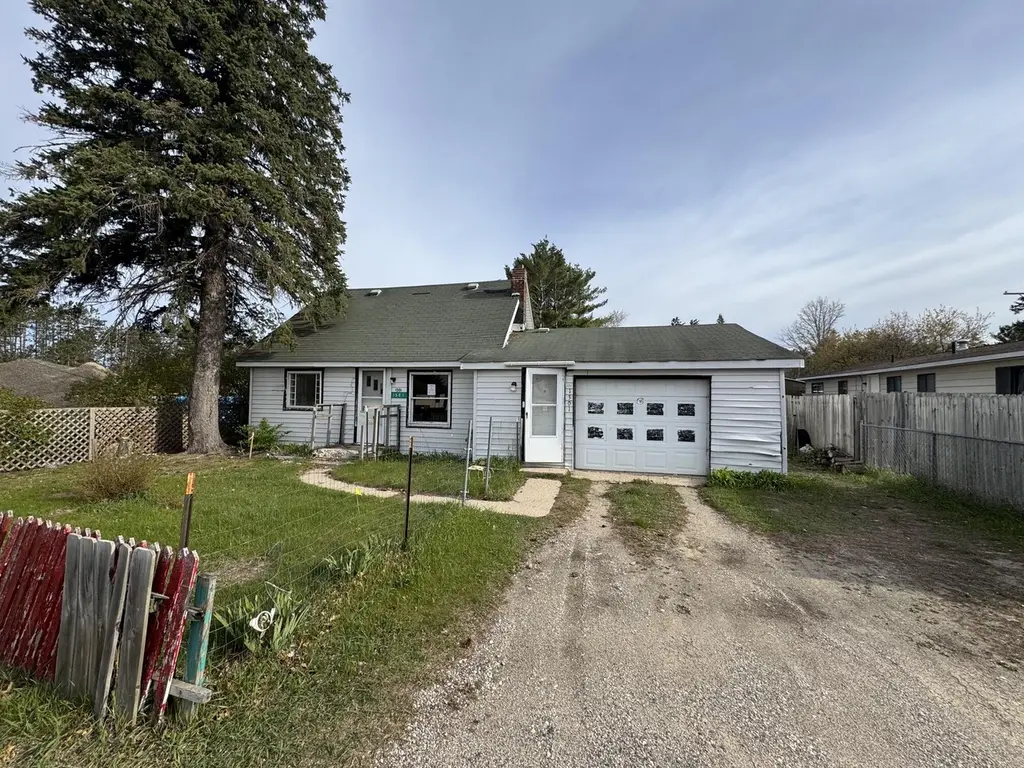
1301 N Down River Rd · Grayling, MI
Flood risk 1/10 · Minimal
- FEMA flood zone
- X (unshaded)
- Chance of flooding over 30 yrs
- 0.0%
- Est. flood insurance / yr
- $507 – $1,088
Fire risk 3/10 · Minor
- Est. fire insurance / yr
- $784 – $1,456
Heat risk 1/10 · Minimal
- Hot days now (above 93°F)
- 7 days/yr
- Hot days in 30 yrs
- 13 days/yr
Wind risk 1/10 · Minimal
- Chance of severe wind over 30 yrs
- —
Air-quality risk 2/10 · Minimal
- Unhealthy air days now
- 0 days/yr
- Unhealthy air days in 30 yrs
- 1 days/yr
Risk factors via First Street. Map © Google.
Why this score? — see what drove the B- grade
The composite is a weighted blend of 9 inputs, each scored 0–100. Each bar is that input's sub-score; the figure is the points it added to the 100-point composite (weight × sub-score).
- Cash flow +30.0/30.0
- DSCR +10.0/10.0
- 1% rule +8.4/10.0
- ARV discount +7.5/15.0
- Schools +3.9/10.0
- Livability +3.6/5.0
- Rent growth +2.5/5.0
- Condition / age +2.5/5.0
- Appreciation +0.0/10.0
$56,288
🖨 Deal sheet 📄 Offer letter ✓ Due diligence
Listing remarks
Charming opportunity in the heart of Grayling! This 3-bedroom, 1-bath home with a 1-car garage makes a great first-time home or investment property. Conveniently located close to schools, the hospital, shopping, and everyday amenities. Enjoy the comfort of in-town living with plenty of potential to make it your own. Whether you're looking to start out, downsize, or expand your investment portfolio, this home is worth a look! Message Inserted (05/14/2026 11:26 AM) On: 1301 N DOWN RIVER ROAD, GRAYLING MI 49738. This property is posted on the MyNextBid auction website. All offers must be submitted through this link: https://mynextbid.com/property/2859/-1301- N-Down-River-Road-Grayling-MI-49
Key facts
- Close to hospital
- Close to schools
- Close to shopping
Tags
Property features AI
Exterior
- Parking: Attached garage (1 car)
- Utilities: Public water; Public sewer
- Home design: Single-family residence; Residential property
- Exterior features: Paved road access; .17-acre lot
Interior
- Bathrooms: 1 full bathroom
- Heating & cooling: Wall furnace heating
- Interior features: Crawl space basement
- Laundry & utility: Main-level laundry
Neighborhood map
What this means for you Summary
Snapshot
- This is a 2-bed/1.0-bath single-family listed at $56k.
Deal economics
- At list price, monthly cash flow is $258 ($3k/yr) — positive.
- The deal already cash-flows at list — no discount required.
- Meets the 1% rule at list price ($755 rent vs $56k).
- Recommended offer: $55k (3.0% below list) — sets the bar for market timing.
- Cap rate 11.8% vs local median 3.0% in Grayling — top-decile yield for the area; either an underpriced asset or a hidden risk that comps aren't pricing in. Stress-test before assuming the spread holds.
Location & tenants
- Location reads 71/100 on livability (#269 in MI) — a middle-class / working-renter tenant base. Strengths: crime A+, cost of living A+, housing A+; Watch: schools D, amenities F, commute F.
- Crawford Ausable Schools (town): math 43% / reading 50% proficiency, ranked #140 of 540 in MI (top 26%) — families likely to look elsewhere, expect single-tenant / working-renter base with shorter leases.
- Market conditions: 161 active listings in the ZIP; 75 units permitted in Crawford County in 2024 (32 in 5+ unit buildings).
Forward outlook
- Local home prices are declining (-3.0%/yr); year-one equity from $389 of loan paydown is wiped out by about $2k of value loss. Plan a longer hold.
- Crawford County population projected at -22% by 2050 — secular population decline; favor cash flow + early exit over multi-decade hold.
- At projected returns (-3.0% appreciation + 3.0% rent growth), your $16k cash investment doubles in ~7 years — after that, you're playing with house money.
Negotiation context
- It's been on market 35 days — a 3% lower offer ($55k) is reasonable based on typical stale-listing flexibility.
Risks & watch-outs
- Watch-outs: built in 1955 — expect roof / HVAC / electrical / plumbing capex.
Questions for the listing agent
- It's been on market 35 days. Have you received any prior offers? Is the seller open to a 3% concession, seller financing, or rate buy-down credit?
- Built in 1955 — when were the roof, HVAC, electrical panel, plumbing, and water heater last replaced?
- Is there a deadline driving the sale (1031 exchange, divorce, estate, relocation)? That informs how much negotiation room exists.
- Schools are D-rated, which usually means shorter tenancies and higher turnover. Who's the typical renter profile here, and what's been the actual vacancy rate?
- What's the average days-on-market for RENTAL listings here right now (not sales)? A rising rental-DOM trend means longer vacancies and softer asking-rent achievability than the comps imply.
- What's the recent tenant-quality profile in this submarket — average credit score on applications, eviction rate, late-payment / NSF rate, and stable-employment percentage? A property-management company in the area should have these aggregated.
- How much new for-sale + rental construction is in the pipeline within 1–3 miles? Heavy new supply typically softens prices + rents 12–24 months out; constrained supply supports both.
Investment metrics
- 1% rule
- 1.34% ✓
- Cap rate
- 11.80%
- Cash-on-cash
- 19.67%
- DSCR
- 1.88
- GRM
- 6.2
CMA / ARV
- ARV (median comp)
- $132,000
- List price
- $56,288
- Delta
- -57.36%
- Verdict
- UNDERPRICED
- Comps
- 3 within 1.0 mi
Projected returns pro-forma
-3.0% appreciation · 3.0% rent growth · sell at horizon
- IRR
- 11.7%
- Equity multiple
- 1.46×
- Total profit
- $7,314
- Equity at exit
- $8,393
- IRR
- 20.7%
- Equity multiple
- 2.74×
- Total profit
- $27,477
- Equity at exit
- $4,867
Cash invested: $15,761 (down + closing). Projections, not guarantees.
Landlord ↔ Tenant lean methodology
- Overall (STATE)
- 62 Landlord-Friendly
- State Michigan
- 62 Landlord-Friendly · EVEN
- County
- — inherits STATE
- City
- — inherits STATE
ZIP-level market 49738
- Home prices YoY
- -19.5%
- Active inventory
- 161
- Price-to-rent
- 6.2×
Monthly cashflow live
- Estimated rent
- $755 medium interval (Pro) →
- Mortgage (P&I)
- −$295
- Tax from tax record
- −$20 /mo · $237/yr
- Insurance
- −$23
- HOA
- −$0
- Vacancy / Maint / Mgmt
- −$159
- Net cashflow
- $258
Break-even live
UW: 25.0% down · 7.5% · 30yr · 1.5% tax · 5.0% vac · 8.0% maint · 8.0% mgmt
Financing live
Cash to close
- Down payment
- $14,072
- Closing costs
- $1,689
- Reserves months
- —
- Total cash needed
- —
Loan-product check · same deal, 3 products live
Conventional
25% down · 7.5% · 30yr
- Down + closing
- —
- Monthly P&I
- —
- Monthly cashflow
- —
- DSCR
- —
- Eligible?
- —
Personal DTI + credit; lowest rate.
DSCR
20% down · 8.5% · 30yr
- Down + closing
- —
- Monthly P&I
- —
- Monthly cashflow
- —
- DSCR
- —
- Eligible?
- —
No personal income docs; deal must DSCR.
Hard money
10% down · 12.0% · 12mo
- Down + closing
- —
- Monthly P&I
- —
- Monthly cashflow
- —
- DSCR
- —
- Eligible?
- —
Short-term bridge; refi at stabilization.
Listing history 17 events
-
2026-06-18days on market $56,288 Active 35 DOM
-
2026-06-17days on market $56,288 Active 34 DOM
-
2026-06-16days on market $56,288 Active 33 DOM
-
2026-06-15pricedays on market $56,288 Active 32 DOM
-
2026-06-13days on market $59,250 Active 30 DOM
-
2026-06-12days on market $59,250 Active 29 DOM
-
2026-06-09days on market $59,250 Active 26 DOM
-
2026-06-08days on market $59,250 Active 25 DOM
-
2026-06-07days on market $59,250 Active 24 DOM
-
2026-06-07days on market $59,250 Active 23 DOM
-
2026-06-04days on market $59,250 Active 20 DOM
-
2026-06-02days on market $59,250 Active 19 DOM
-
2026-06-01days on market $59,250 Active 18 DOM
-
2026-05-31days on market $59,250 Active 17 DOM
-
2026-05-31days on market $59,250 Active 16 DOM
-
2026-05-14$59,250 Active 735-char remark
-
2005-08-15soldstatus $55,900
ⓘ Source: listings_history table (triggers on properties + properties_extension) + one-shot
backfill from property_details.listing_events for pre-trigger history.
Tax reassessment forecast MI · Partial reset (capped growth)
- Current annual tax
- $237 · $20/mo
- Projected year-2 tax
- $552 · $46/mo
- Expected delta
- +$315/yr (+$26/mo · 132.8%)
ⓘ Screening estimate from a state-policy table — verify with the county assessor before closing.
Climate risk First Street
- Flood 1/10 Low FEMA zone X (unshaded) · 0% chance over 30 yrs
- Wildfire 3/10 Moderate
- Heat 1/10 Low 7 d/yr ≥93°F today · 13 d/yr by 30 yrs out
- Wind 1/10 Low
- Air quality 2/10 Low 0 unhealthy d/yr today · 1 by 30 yrs out
Nearby sold comps map
Loading sold comps map…
Walkable amenities ~0.75 mi
Loading nearby amenities…
Taxation est. · year 1
- Rental income
- $9,064
- − Mortgage interest
- −$3,153
- − Property taxes
- −$237
- − Insurance
- −$281
- − Repairs & maintenance
- −$725
- − Management
- −$725
- − Depreciation
- −$1,637
- Taxable income
- $2,305
- Est. tax owed @ 24.0%
- −$553
- After-tax cash flow
- $2,547/yr
For passive investors: Depreciation is non-cash, so a rental often shows a tax loss while cash-flowing — sheltering income. Rental losses are passive: they offset passive income freely, and up to $25,000/yr can offset ordinary (W-2) income if you actively participate and your MAGI is under $100k (phasing out to $0 by $150k); unused losses carry forward. On sale, claimed depreciation is recaptured at up to 25%, and gains may owe capital-gains tax (a 1031 exchange can defer both). Figures are a year-1 estimate at your 24.0% rate — not tax advice; consult a CPA.
Schools (NCES district)
- District
- Crawford Ausable Schools
- NCES district ID
- 2611030
- Math proficiency
- 43% ▼ -10.00%
- Reading proficiency
- 50% ▬ 0.00%
- Median HH income
- $40,396
- Composite
- 38.94/100
- National rank
- #4086
- State rank
- #140 of 540 in MI
Livability — Grayling
- Score
- 71/100
- State rank
- #269
- US rank
- #6631
Category grades
Schools grade is shown separately in the Schools card above.
Census & demographics
- Population (ZIP)
- 9,599
Population outlook (Crawford County) Hauer SSP2
- Today (2025)
- 13,042 people
- By 2030
- 12,520 · -4.0%
- By 2040
- 11,292 · -13.4%
- By 2050
- 10,157 · -22.1%
- By 2075
- 8,338 · -36.1%
- By 2100
- 6,765 · -48.1%
Race, ethnicity, and origin ACS 2023
- Neighborhood character
- Predominantly White (93%)
- Race & ethnicity
- White 93% Two or more races 4% Hispanic / Latino 2%
- Common ancestry
- Romanian 8% Lithuanian 7% Slovak 4%
- Foreign-born
- 1% · Canada
Political lean MEDSL · Crawford
- 2024 margin
- Solid R (+33.8) · D 32.5% · R 66.2% · Other 1.3%
- 2008→2024 swing
- -32.1pp toward R · 2008: -1.7pp · 2024: -33.8pp
- All cycles
- 2024: R+33.8 2020: R+30.7 2016: R+32.8 2012: R+11.0 2008: R+1.7
Not yet ingested
- Civics
- —
Market trends
- HPI YoY
- ▼ -68.14%
- Current HPI
- 280.922
- Rent YoY
- —
- Metro
- —
- State GDP YoY
- ▲ 1.37%
- F500 in state
- 28
Industry mix (Fortune 500 HQ in MI)
| Industry | F500 HQs | Revenue |
|---|---|---|
| Automotive Parts | 3 | $48B |
|
||
| Automotive | 2 | $372B |
|
||
| Chemicals | 1 | $45B |
|
||
| Automotive Retail | 1 | $29B |
|
||
| Healthcare / Medical Devices | 1 | $23B |
|
||
| Automotive Technology | 1 | $20B |
|
||
Price history
+0.7% since first listed3 events — show timeline
- 2026-06-14 Price Changed $56,288 WWMLS
- 2026-05-14 Listed $59,250 WWMLS
- 2005-08-15 Sold (Public Records) $55,900 Public Records
Property tax history
-10.3%/yrLatest (2025): $237 · -44.6% YoY. Source: county tax records.
Cash-flow waterfall
monthlySold comps — $/sqft
last 12 mo · ≤1 miLoading sold comps…